i
November 2012
Ina Anreiter
Bachelor in Biology
Epigenetics and Behavioural Plasticity:
Drosophila euchromatin histone metiltransferase and foraging
A thesis submitted in fulfillment of the requirements for the degree of Masters in
Molecular Genetics and Biomedicine
Supervisor: Dr. Marla Sokolowski, Principal Investigator, University of Toronto
Co-Supervisor: Dr. Sofia Pereira, Research A., Instituto Superior de Agronomia
Masters Defense Committee:
Chair: Dr. José Sampaio
External Examiner: Dr. Carlos Ribeiro
Research supervisor: Dr. Sofia Pereira
i
―In nature's infinite book of secrecy, A little I can read.‖
— William Shakespeare in Antony and Cleopatra.iii
Epigenetics and Behavioural Plasticity:
Drosophila euchromatin histone metiltransferase and foraging
Copyright 2012 Ina Anreiter, FCT/UNL, UNL
The Faculty of Science and Technology and the New University of Lisbon is perpetually entitled and without geographical boundaries, to archive and publish this dissertation through printed copies reproduced on paper or digital form, or by any other means known or hereafter invented, and to promote it by scientific repositories and allow for its copying and distribution for educational or research but not commercial purposes, as long as credit is given to the author and publisher.
v
Acknowledgments
First and foremost I would like to express my gratitude to my supervisors, Marla Sokolowski and Sofia Pereira. I am forever thankful for the guidance, the support and the help in all stages of this project. The encouragement to work independently and the trust they deposited in my work gave me the opportunity to mature professionally as well as personally.
My sincere thanks go to all the members of the Sokolab, for making me feel at home from the first day onwards, for the insightful discussions over lunch breaks, for never being short on advice and help and for providing the best working environment one could wish for. Working on your side was both inspiring and enjoyable.
Special thanks go to Bryon Hughson for being a wonderful teacher and introducing me to world of Drosophila and behaviour. To Aaron Allen without whom I would have been ―molecularly‖ lost. And last but not least, to Oscar Vasquez for the westerns, for helping me keep my sanity and for all the fun. Being able to discuss my work with you all was fundamental for this project.
I am thankful to Jamie Kramer who kindly provided the flies that made this project possible. I also would like to thank Joel Levine and his lab for sharing their precious space for a month and Jennifer Mitchell for access to the thermo cycler.
Finally, I want to thank my family and friends, who helped and believed in me the whole way through. It is easy to take risks knowing you have that thick of a cushion to fall back on.
vii
Abstract
The foraging gene in D. melanogaster underlies a natural polymorphism with two variants called rover and sitter. These variants differ in a suite of phenotypes which are plastic when exposed to varying environmental parameters. Although the phenotypic differences between rovers and sitters are evident, the underlying molecular mechanisms involved are not completely understood. Recently, a histone methyltransferase (EHMT) was found to methylate histones at the foraging promoter region, suggesting a possible interaction of these two genes. This work provides strong evidence that EHMT significantly affects several phenotypic traits linked to the foraging gene. EHMT is needed for the plastic response to food-deprivation seen in larval feeding behaviour, evident as food-deprived larvae lacking EHMT show the same behaviour as fed larva, while larva with functional EHMT significantly reduce their path-lengths when food-deprived. Furthermore, the loss of functional EHMT affects sitter but not rover adult foraging behaviour in food-deprived flies, suggesting an epigenetic interaction between EHMT and the foraging alleles. EHMT mutants also have higher fat storage levels and survive longer during starvation. And finally, EHMT mutants and revertants do not differ significantly in overall foraging RNA expression in fed and food-deprived feeding regimes, but show substantial differences in the foraging protein isoforms expressed. Taken together, this thesis provides proof that
EHMT epigenetically regulates traits influenced by the foraging gene and that this regulation is linked
to environmental cues. Considering that both foraging and EHMT have homologues in many species and have been associated to a series of human diseases, the results herein are also interesting from a human perspective.
ix
Resumo
Em Drosophila melanogaster, existem dois variantes fenotípicos associados a um polimorfismo natural com origem no gene foraging, nomeadamente ―rovers‖ e ―sitters‖. Estes variantes diferem num grande número de características fenotípicas e exibem plasticidade comportamental em resposta ao ambiente. Apesar de as diferenças fenotípicas entre ―rovers‖ e ―sitters‖ serem evidentes, os mecanismos moleculares subjacentes não são completamente conhecidos. A recente descoberta que a metil-transferase EHMT metila histonas na zona promotora de foraging, sugere uma possível interacção na modulação fenotípica. No presente projecto são apresentadas provas de que o gene EHMT influencia significativamente fenótipos associados ao gene foraging. EHMT é necessário para a plasticidade no comportamento em resposta à privação de comida uma vez que larvas sem EHMT funcional não têm resposta comportamental à ausência de comida. Por outro lado, em adultos a perda de função de EHMT afecta o comportamneto alimentar em ―sitters‖ mas não em ―rovers‖. Além disso, mutantes de EHMT acumulam mais reservas de lípidos e sobrevivem mais tempo na ausência de nutrientes do que indivíduos com EHMT funcional. Finalmente, os níveis de expressão do gene foraging não são significativemente affectados por EHMT ou pelo regime alimentar, mas os níveis proteicos das diferentes isoformas codificadas por foraging differem substancialmente com a funcionalidade de EHMT e com o regime alimentar. Assim, este trabalho apresenta evidências que EHMT regula epigenéticamente características controladas pelo gene foraging e que esta regulação depende de factores ambientais. Tendo em conta que tanto
foraging como EHMT têm homólogos em muitas espécies e foram associados a uma série de
patologias humanas, estes resultados são interessantes numa perspectiva humana.
xi
Table of Contents
Abstract
... vii
Resumo ... ix
List of Tables
... xiii
List of Figures
... xv
1 – Introduction ... 1
2 - Materials and Methods
... 11
2.1 - Fly Stocks
... 11
2.2 –Stock Maintenance and Starvation Treatments ... 12
2.3 – Viability Test ... 13
2.4 – Sterility Test ... 13
2.5 – Larval Path Length Test... 14
2.6 – Adult Foraging Assay ... 15
2.7 – Starvation Resistance Assay ... 16
2.8 – Total Triglyceride and Protein Quantification ... 17
2.9 – foraging RNA and Protein Extraction ... 19
2.10 – foraging RNA Quantification ... 20
2.11 – foraging Protein Quantification ... 22
2.12 – Statistical Analysis ... 22
3 – Results ... 23
3.1 – Developmental effects of EHMT
DD1and for
R... 23
3.2 – Homozygous EHMT
DD1;for
Rmales and females are sterile
... 24
3.3 – The loss of functional EHMT affects larval foraging behaviour ... 25
... 28
3.4 – The loss of EHMT affects adult foraging behaviour ... 29
3.5 - EHMT mutants survive longer under food deprivation
... 31
3.6 – The loss of EHMT results in higher triglyceride storage levels ... 35
3.7 – Quantitative Real-Time PCR did not detect major differences in for gene expression
associated to EHMT
... 38
xii
3.8 –Variations in FOR protein expression between strains and feeding regimes ... 41
4 – Discussion ... 43
Supplementary Data
... 59
S1 - Kruskal-Wallis One Way Analysis of Variance on Ranks for Larval Path Length
experiment 1 ... 59
S2 - All Pairwise Multiple Comparison Procedures (Holm-Sidak method) for Larval Path
Length Experiment 2
... 61
S3 - All Pairwise Multiple Comparison Procedures (Student-Newman-Keuls Method) for
Starvation Resistance Assay ... 63
S4 - All Pairwise Multiple Comparison Procedures (Holm-Sidak method) for Total
xiii
List of Tables
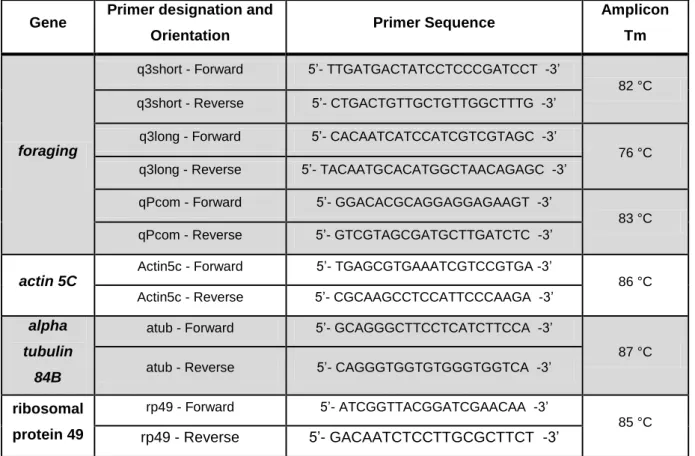
TABLE 2.1 - OLIGONUCLEOTIDES USED FOR PCR AMPLIFICATION OF FOR CODING SEQUENCES AND
REFERENCE GENES. ... 26
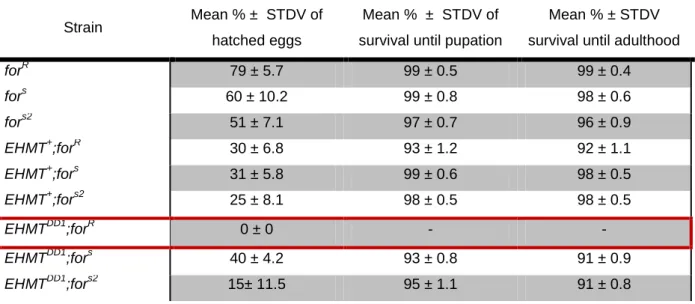
TABLE 3.1–PERCENTAGE VIABILITY AT VARIOUS DEVELOPMENTAL STAGES. ... 25
TABLE 3.6-MEAN WEIGHT (MG), PROTEIN AND TRIGLYCERIDES OF 4 ADULT FEMALES ±SE ... 28
TABLE 3.8–RELATIVE DIFFERENCES IN FOR PROTEIN CONCENTRATION USING EHMT+;FORS AS REFERENCE
xv
List of Figures
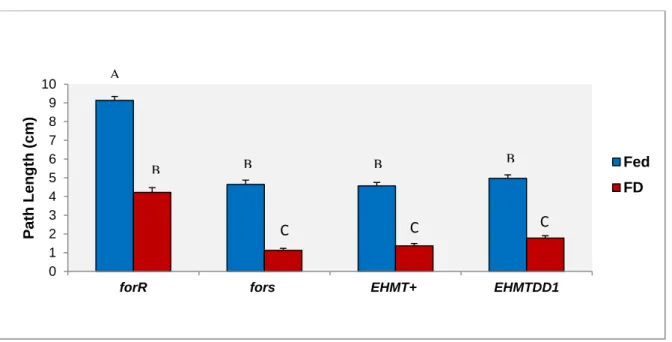
FIGURE 3.3.1 –LARVAL FORAGING EXPERIMENT 1.MEAN LARVAL PATH LENGTH (CENTIMETERS) ±SE FOR STRAINS FORR, FORS, EHMT+AND EHMTDD1. POOLED DATA FOR SEX AND FOR 3 REPLICATE DAYS WHERE 110< N <120 LARVA WERE TESTED PER STRAIN. LETTERS REPRESENT STATISTICAL GROUPS AND MEANS WITH THE SAME LETTER ARE NOT SIGNIFICANTLY DIFFERENT.FED AND FD STAND FOR FED AND FOOD DEPRIVED CONDITIONS. ... 26
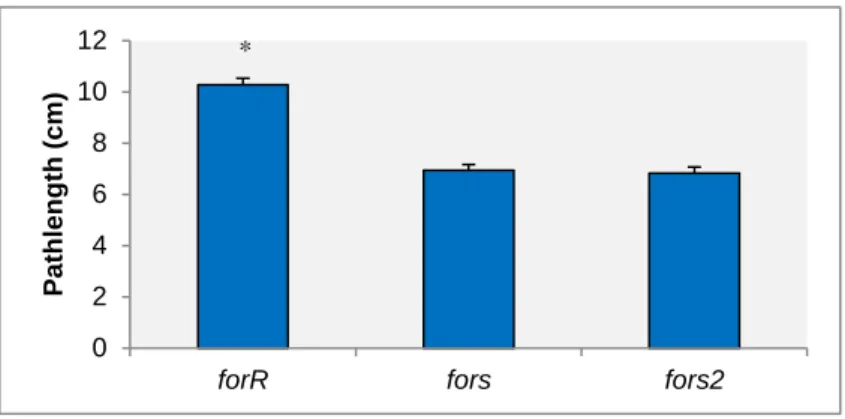
FIGURE 3.3.2 –CONTROLS FOR SECOND LARVAL FORAGING EXPERIMENT. MEAN LARVAL PATH LENGTH
(CENTIMETERS)±SE FOR STRAINS FORR, FORS, AND FORS2.DATA POOLED OVER 4 REPLICATE DAYS AND
130< N <140 LARVA/STRAIN.BARS WITH ASTERISKS SHOW SIGNIFICANT DIFFERENCES IN MEANS. ... 26
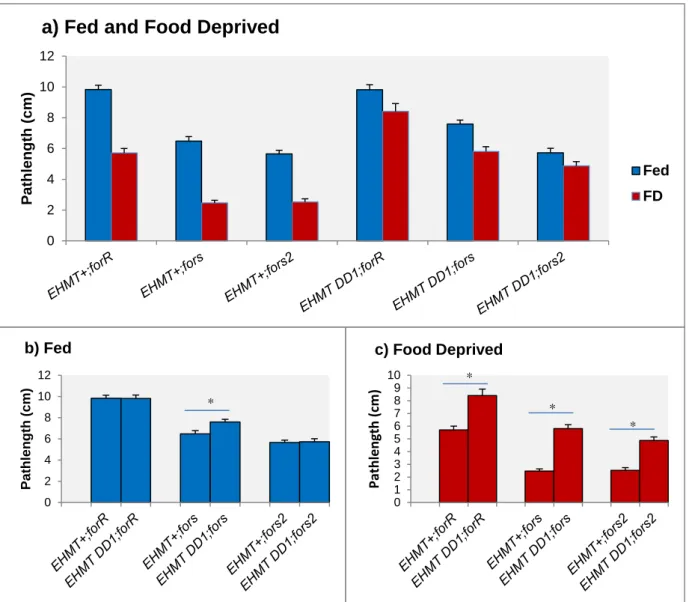
FIGURE 3.3.3-MEAN LARVAL PATH LENGTH (CENTIMETERS)±SE FOR STRAINS EHMT+;FORR,EHMT+;FORS,
EHMT+;FORS2, EHMTDD1;FORR, EHMTDD1;FOR S AND EHMTDD1;FORS2, DEMONSTRATING: A) COMPARISON BETWEEN FED AND FOOD DEPRIVED LARVAE B) COMPARISON BETWEEN STRAINS IN FED LARVAE C) COMPARISON BETWEEN STRAINS IN 4H FOOD DEPRIVED LARVAE. DATA POOLED OVER 5
REPLICATE DAYS FOR ALL STRAINS. 130 < N < 140 LARVA/STRAIN. BARS WITH ASTERISKS SHOW SIGNIFICANT DIFFERENCES IN MEANS ... 28
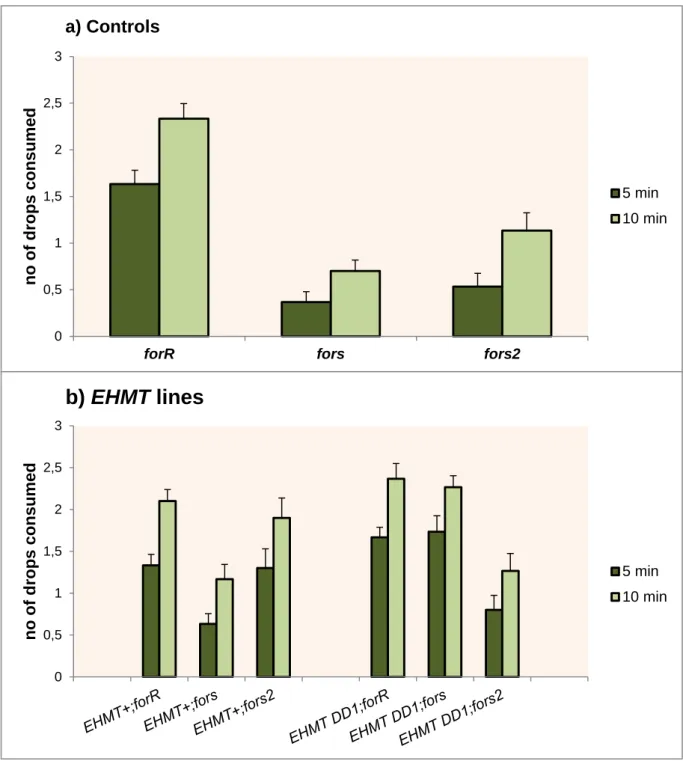
FIGURE 3.4–MEAN SUCROSE DROPS CONSUMED ±SE FOR ALL STRAINS, DEMONSTRATING A)LABORATORY ROVER, SITTER AND FORS2 CONTROLS AT 5MIN AND 10MIN. B) EHMT MUTANTS AND REVERTANTS ON ROVER, SITTER AND FORS2 BACKGROUNDS AT 5 MIN AND 10 MIN.DATA COLLECTED OVER 10 DAYS WITH
24H FOOD DEPRIVED 5-6 DAYS OLD FEMALES. N =30 INDIVIDUALS/STRAIN.BARS WITH ASTERISKS SHOW SIGNIFICANT DIFFERENCES IN MEANS. ... 30
FIGURE 3.5.1–SURVIVAL RATES FOR FEMALES FLIES OF ALL STRAINS, DEMONSTRATING A) FORR, FORS AND
FORS2 CONTROL LINES AND B) EHMT+;FORR, EHMT+;FORS, EHMT+;FORS2, EHMTDD1;FORR,
EHMTDD1;FOR S AND EHMTDD1;FORS2.ISERTS SHOW THE MEAN TIME (H) TO 80%,50% AND 20% OF FLIES ALIVE ± STANDARD ERROR. ... 30
xvi
FIGURE 3.5.2–SURVIVAL RATES FOR MALE FLIES OF ALL STRAINS, DEMONSTRATING A) FORR, FORS AND FORS2 CONTROL LINES AND B) EHMT+;FORR,EHMT+;FORS,EHMT+;FORS2,EHMTDD1;FORR,EHMTDD1;FOR S
AND EHMTDD1;FORS2. ISERTS SHOW THE MEAN TIME (H) TO 80%, 50% AND 20% OF FLIES ALIVE ±
STANDARD ERROR. ... 30
FIGURE 3.6–MEAN ±SE PROTEIN-TRIGLYCERIDE RATIO OF 10 BIOLOGICAL REPLICATES FOR ALL STRAINS.
FED AND FD STAND FOR FED AND FOOD DEPRIVED CONDITIONS. INLET SHOWS THE LABORATORY CONTROL STRAINS.. ... 30
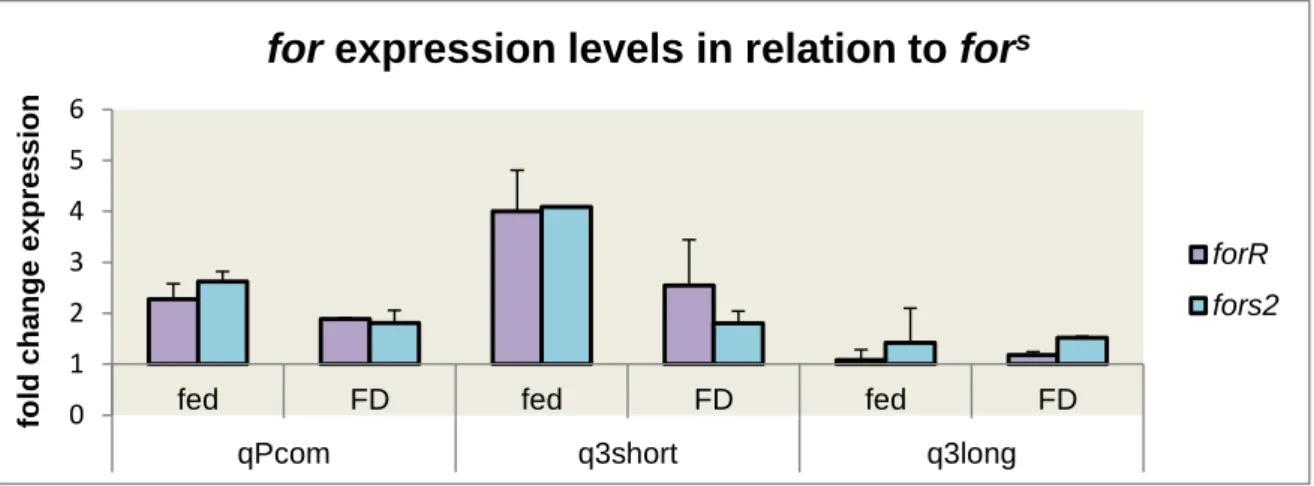
FIGURE 3.7.1- FOR RNA EXPRESSION LEVELS FOR FED AND FOOD-DEPRIVED FORR AND FORS2 USING Α
-TUBULIN AND ACTIN5C AS REFERENCE GENES AND IN COMPARISON TO FORS EXPRESSION LEVELS.DATA PRESENTED FOR 3 FORAGING PRIMER PAIRS: QPCOM, Q3SHORT AND Q3LONG... ... 30
FIGURE 3.7.2-FOR RNA EXPRESSION LEVELS FOR FED AND FOOD-DEPRIVED EHMT+;FORR,EHMT+;FORS2,
EHMTDD1;FORR, EHMTDD1;FORS AND EHMTDD1;FORS2 USING Α-TUBULIN AND ACTIN5C AS REFERENCE
GENES AND IN COMPARISON TO EHMT+;FORS EXPRESSION LEVELS.DATA PRESENTED FOR ALL 3 FOR
-PRIMER PAIRS: QPCOM, Q3SHORT AND Q3LONG.... ... 30
FIGURE 3.7.3 – FOR RNA EXPRESSION LEVELS FOR FED EHMTDD1;FORR, EHMTDD1;FORS AND
EHMTDD1;FORS2 COMPARING TO AND EHMT+;FORR ,EHMT+;FORS EHMT+;FORS2 RESPECTIVELY.CTS EQUILIBRATED TO Α-TUBULIN AND ACTIN5C. DATA PRESENTED FOR ALL 3 FOR-PRIMER PAIRS: QPCOM,
Q3SHORT AND Q3LONG.... ... 30
FIGURE 3.8– WESTERN BLOT FOR FED AND FOOD-DEPRIVED (FD) FLIES OF EHMT+;FORR, EHMT+;FORS,
EHMTDD1;FORR AND EHMTDD1;FOR S STRAINS WHERE:BAND#1 AND BAND#3 CORRESPOND TO FOR
ISOFORM P1;BAND#4 CORRESPONDS TO ISOFORM P3;BAND#2 ORIGINATES FROM UNSPECIFIC BINDING OF THE ANTIBODY AND BAND#5 CORRESPONDS TO A UNIDENTIFIED FOR ISOFORM.... ... 30
1
1 – Introduction
The big question in behavioural genetics is to understand the interrelationship of genetic mechanisms and behavior, studying how genes are regulated throughout the development of an organism and how they give rise to different phenotypes. At the level of the individual, the ability of an organism to change its phenotype in response to variations in the environment is defined as phenotypic plasticity. Between individuals, differences in behaviour originate not only in allelic variation at the genetic level but also in different levels of plasticity in a changing environment. The complex interactions of genes and environment become evident with such differences in behavioural response to environmental parameters.
Questions about how gene-environment interplay (GEI) works (through genotype by environment interactions and/or epigenetic regulation), and how big the role of each of these factors is in modulating behavior are fundamental to biology, psychology and medicine.
The fruit fly Drosophila melanogaster (D. melanogaster) has been largely used as model organism in both these fields, due to its many advantages. Firstly, D. melanogaster is a small species with a short life cycle that can be easily reared in the laboratory to produce large numbers of progeny. Secondly, genetic methods and tools have been developed for D. melanogaster to an extent that far exceeds that of any other complex multi-cellular organism. In addition, the high level of homology of genes and cellular pathways between D. melanogaster and humans makes the fruit fly an excellent tool for understanding and modeling specific human diseases (Beckingham et al, 2005).
A brief description of the D. melanogaster life cycle follows below. The developmental period of the fruit fly varies with temperature, ranging from 7 days at 28 °C to over 50 days at 12 °C. At standard laboratory 25ºC and under ideal rearing conditions, the development time is 8.5 days, but under adverse environmental conditions, like crowding or poor food quality, development time increases, while the emerging flies are smaller (Bakker, 1961). At 25 ºC and good rearing conditions, 1st instar larvae hatch 12–15 h after the eggs have been laid and grow for about 4 days while molting twice (into 2nd- and 3rd-instar larvae), at about 24 h and 48 h after hatching. During this period larvae feed continuously on food substrate at a feeding rate that is age related. The feeding rate increases during the 1st and 2nd larval instars, reaching a maximum during the first half of the 3rd larval instar (Sewell et
al, 1975 ). This is important because larval feeding behaviour measurably affects the rate of larval
development (Sewell and Connolly, 1975), pupation time (Bakker, 1961; 1969) and egg-to-adult viability (Ohnishi, 1979). About 96 h after hatching late 3rd instar larva stop feeding and start
2
wandering in search of a pupation site. Pupae undergo a four-day-long metamorphosis, after which the adults emerge (Ashburner and Thompson, 1978). The first days after eclosion are critical for cuticle formation and fat storage accumulation and during this period flies are more susceptible to environmental stress (Ashburner, 1989).
The D. melanogaster foraging gene and its pleiotropy
The D. melanogaster foraging gene (for) encodes a cGMP dependent protein kinase (PKG; Kalderon and Rubin, 1989; Osborne et al, 1997), a signaling molecule with varied influences on behaviour and a large degree of pleiotropy (pleiotropy occurs when multiple phenotypic traits are influenced by one gene) and plasticity. for is a complex gene that can be linked to a large suite of behavioural phenotypes not only in D. melanogaster but in many other species as well (such as the honey bee, ants, nematodes and mammals). The natural behavioural polymorphisms, plasticity and pleiotropy associated to for have provided an excellent model for studying how natural variation in a single major gene influences phenotypic traits in diverse taxa, from perspectives as varied as ethology, evolution, genetics and neuropharmacology (Reaume and Sokolowski, 2009).
In the fruit fly for has first been associated with larval foraging strategies. In 1980, Sokolowski identified a natural occurring dimorphism in feeding patterns of fruit fly larva. Depending on the distances the larvae travel while foraging they can be divided into two phenotypical groups: either rovers or sitters. While larvae exhibiting the sitter phenotype travel relatively short distances when on a food substrate, rovers show considerably longer path lengths. The expression of this difference in larval locomotory behaviour depends on the availability of food, since on a non-nutritive substrate there is no difference in rover/sitter moving patterns (Sokolowski et al, 1983; Kaun, et al, 2007a). Genetic analysis using chromosomal substitutions between isogenic stocks, showed that that this behaviour was linked to the second chromosome and that the rover phenotype has complete dominance over the sitter phenotype (deBelle and Sokolowski, 1987). Nevertheless, the rover and sitter phenotypes are both naturally maintained in wild populations, and as several studies showed, populations in the wild have about 70% rovers to 30% sitters (Sokolowski, 1980; 1982; Sokolowski et
al, 1997). Interestingly, despite the strong association between the rover/sitter for “alleles‖ and the
larval feeding patterns, the phenotypes are plastic when exposed to varying environmental parameters. For instance, expression of the larval foraging behaviour was found to be conditional on the availability of food in the environment during larval development, as food-deprived larva showed a considerable reduction in the amount of locomotory behaviour while foraging. Nevertheless, since starvation reduced locomotory rates in both rovers and sitters, the allelic differences in path length were maintained (Graf and Sokolowski, 1989).
Later studies showed that the effects of for are not limited to larval foraging behaviour. A correlation between the rover and sitter larval foraging phenotypes and the preference for pupation sites was also found. Although differences in pupation sites couldn‘t be attributed to for alone
3
(pupation height is a polygenic character influenced by many genes with additive effects on the major autosomes), it was evident that sitters in nature prefer to pupate on their feeding substrate (rotting fruit), while rovers move away from the fruit to pupate. In laboratory vials this difference can also be seen in how high larvae pupate on the vial walls, with sitters pupating preferentially closer to the food than rovers (Sokolowski, 1985). Further investigations of these correlated behavioural traits in rovers and sitters demonstrated that high animal rearing densities selected for the rover phenotype in laboratory populations, while low animal rearing densities selected for the sitter phenotype, this means that density-dependent natural selection produces changes in this trait (Sokolowski et al, 1997).
Pereira and Sokolowski (1993) showed that the rover/sitter polymorphism in feeding strategies is maintained beyond the larval stage. D. melanogaster rover and sitter strains isolated from nature differ in the distance adult flies walk after feeding per unit time; this is, after feeding on a sucrose drop, rovers move away from the food source, while sitters spend more time circling around the spot. Like in larvae, this variation results from different alleles at the foraging locus, evident as mutagenized rover flies carrying a sitter-like foraging allele on a rover genetic background (the fors2 foraging allele) also
exhibited sitter behaviour in this adult assay (Pereira and Sokolowski, 1993). Considering that fors2 mutant flies have the same genetic background as rovers, differing only in the foraging allele, fors2 data provides strong evidence that the observed behavioural differences are a function of for.
Still in regard to food related traits, it has been shown that rover larvae have lower food intake than sitter and fors2 mutant larvae, higher levels of glucose absorption and preferential allocation of glucose to lipids. These differences are dependent on rearing conditions such as food quality or availability. The reduction of quantity and/or quality of the available food results in an overall rise in food intake in both rovers and sitters and rover/sitter differences are lost. Nevertheless, rover larvae maintain higher absorption efficiency but also have more rapid development and higher survivorship compared to sitters and fors2 when food is limited and they are grown with their own variants (Kaun et
al, 2007a).
Furthermore, there are also foraging related differences at the neuronal level in D.
melanogaster. In adult flies, there is an allelic difference in olfactory-related behaviour that can be
attributed to the foraging rover and sitter alleles. Sitters show a much higher response in the ability to migrate towards the source of a fly medium attractant than rovers and this difference cannot be attributed to general olfactory deficits. Deficiency mapping with fors2 mutants revealed that this phenotype originated from the foraging locus. This suggests that PKG signaling pathways are involved in olfactory related responses to food (Shaver et al, 1998).
Additionally, for independently affects sensory responsiveness and habituation in adult flies. An assay, in which the response to sucrose (proboscis extension) was tested, showed that rovers are more responsive to sucrose than sitter and fors2 flies, but that this difference decreases with food deprivation. The fact that rovers also show lower habituation indexes under repetitive testing conditions than sitter and fors2 flies indicates that for also has a function in non-associative learning (Scheiner et al, 2004).
Renger et al (1999) showed that there also are physiological and morphological variations in nervous systems of the rover and sitter allelic variants isolated from natural populations. Whole-cell
4
current clamping revealed distinct excitability patterns, with spontaneous activities and excessive evoked firing in sitter, but not rover neurons, as well as reduced voltage-dependent K+ currents in sitter neurons. In addition, sitters show more diffuse motor axon terminal projections with increased ectopic nerve entry points in larval muscles. Data from forS2 and two other mutant sitter strains confirmed that these phenotypes are part of for‘s multiple functions (Renger et al, 1999).
More recently, sitters have been shown to have poorer short-term memory but better long-term memory than rovers in an associative olfactory learning paradigm. This difference was linked to expression of for in the mushroom bodies evident as by selectively increasing the level of PKG in the mushroom bodies of transgenic sitter flies (with the UAS-GAL4 system), their behavior became rover-like (Mery et al, 2007). It had been shown before that the mushroom bodies are central to olfactory learning processes in D. melanogaster (Heisenberg, 2003). Olfactory conditioning was also significantly influenced by for expression in the mushroom bodies of larvae, where rovers showed faster memory acquisition and longer retention than sitters and fors2 (Kaun et al, 2007b).
Finally, the natural foraging variants also differ in their response to environmental stress, such as heat or anoxic conditions. Sitters are considerably more thermotolerant, maintaining normal synaptic transmission at significantly higher temperatures than rovers. Pharmacological manipulations of the PKG pathway showed that this was directly related to PKG activity (Dawson-Scully et al, 2007). The same seems to be the case with hypoxia (Reaume and Sokolowski, 2009). In addition, sitters survive longer when there is no food available (Donlea et al, 2012), this could be related to the fact that sitters have higher fat storage levels than rovers (Kent et al, 2009).
Considering all of the above, the D. melanogaster foraging gene presents an excellent model to study GEIs.
Molecular structure and expression patterns of foraging
Although the phenotypic differences between rovers and sitters are evident, so far it is not clear from where these differences originate at a molecular level. There has been identified a large number of polymorphisms in the nucleotide sequence of the natural for allelic variants, but none have been directly linked to the plasticity observed in the rover/sitter phenotypes (Aaron Allen, personal communication).
As mentioned above, foraging encodes for one of two cGMP-dependent protein kinases (PKG) in D. melanogaster (dg1 and for/dg2), PKGs are signaling molecules that act as key mediators of the nitric oxide (NO)/cGMP signaling pathway by phosphorylating serines and threonines on many cellular proteins. Unfortunately it is still unclear how exactly PKG acts at a cellular level since it remains mostly unknown what genes and molecules are involved up and downstream in the PKG signaling cascade.
Nevertheless, there is extensive data on for expression patterns available on fly base (FlyBase, 2012). Overall expression of foraging is highest in early embryogenesis (0 - 4 h old embryos), after that, expression decreases to a moderate level when the embryos are about 12 h old and increases
5
again to higher level until the end of embryogenesis. Lowest expression levels, are observed in L1, L2 and early L3 larvae. In late L3 larvae expression increases again and is maintained during the first 24 h of pupation. In the last 24 h of pupation, expression decreases to L1/L2 larva levels. In adults, there is a sex difference in expression levels, while males only show moderate overall expression, females show levels twice as high (modENCODE Temporal Expression Data; Graveley et al, 2011). In more detail, in L3 larva the highest for expression is found in the fat body and trachea, lower but still high expression levels are seen in the midgut, hindgut and salivary glands, and moderate expression is found in the central nervous system and the malpighian tubules. In Adults, the highest expression levels are found in female spermatheca, but levels are also very high in the fat body, ovaries, crop and head. Moderate levels are found in tissues of the digestive tract (FlyAtlas Anatomical Expression Data; Chintapalli et al, 2007). In summary, for is expressed at all developmental stages and in all analyzed tissues, but the temporal and spatial distribution varies greatly.
Structurally, the foraging gene comprises about 35000 base pairs and is located on the long arm of chromosome 2 (deBelle et al, 1989). There are 11 annotated transcripts of for that code for 11 annotated PKG isoforms, transcribed by 4 known promoters (FlyBase, 2012), but unpublished data from the Sokolowski Lab (Aaron Allen, personal communication) shows evidence for at least another 10 transcripts, all with open reading frames. If the different isoforms of PKG vary in their functions, and how their expression varies across development stage and tissues, remains mostly unknown.
Interestingly, Osborne et al (1997) showed that rovers and sitters differ in PKG activity levels. Rover larvae showed higher for RNA expression (for the 3 transcripts known at the time), as well as higher PKG protein levels and higher PKG activity than sitter larvae. Since transgenic sitters expressing a for complementary DNA from rover showed transformation of larval foraging behaviour to rover type, the behavioural polymorphism observed in food search can be linked to natural variation in PKG activity. The same was the case for adult flies, were for RNA levels, PKG protein levels and PKG activity were higher in rover heads than in sitter heads (Osborne et al, 1997). Immunohistochemical analyses with a for-specific antibody showed that FORAGING (FOR) localizes to neurons in the adult brain as well as to the antennal nerve, which carries axons of the olfactory, auditory, and mechanosensory neurons. In addition, FOR expression in the optic lobes suggested a function in reception and/or processing of visual stimuli. However, rovers and sitters did not show obvious differences in FOR spatial distribution (Belay et al, 2007). It is possible that the rover-sitter differences observed in neuronal behaviours depend on expression levels of a specific FOR isoform, or expression at a specific developmental stage.
Importance of foraging in other species
As mentioned earlier, homologs of for exist across many other species where they are associated to a variety of behaviors and molecular functions. In the honey bee, expression levels of the for homolog Amfor play a role in phototaxis and seem to determine the transition from nursing behaviour to foraging behaviour, thus defining division of labour in bee hives (Ben-Shahar et al, 2002;
6
2003). In harvester ants, task-specific expression levels of Pbfor also determine colony organization by influencing foraging behaviour, and mediating the switch between foraging and defense behaviour (Ingram et al, 2005; Lucas and Sokolowski, 2008). In C.elegans, the for homolog egl-4 has been found to play a role in sensory neurons for modulation of sensory information and to regulate growth and locomotory behaviour (Fujiwara et al, 2002; L‘Etoile et al, 2002). In mammals, cGMP-dependent protein kinases are expressed in many different tissues including smooth muscle, platelets, intestine, and brain (Pfeifer et al, 1999). More specifically, in mice, cGMP signaling is important for axonal growth (Schmidt et al, 2002), plays a role in nociceptive transmission in the spinal cord (Tegeder et al, 2004) and is involved in the regulation of cocaine-related effects on behaviour (Jouvert et al, 2004). Furthermore cGMP-dependent protein kinase I (cGKI) is required for cerebellar long-term depression (lasting activity-dependent reduction in the efficacy of neuronal synapses) and specific forms of motor learning (Feil et al, 2003), as well as age- and protein synthesis-dependent hippocampal long-term potentiation (long-lasting enhancement in signal transmission between neurons; Kleppisch et al, 2003).
The human homologue of for (PRGK1) has also been associated with a series of metabolic pathways and functions. In inflammatory immune response, protein levels of Interleukin 6 are dependent on the concentration of components of the cGMP/PKG pathway (Siednienko et al, 2011). Also, PRKG1 seems to be involved in endothelial dysfunction and other vascular diseases, being a regulator of blood pressure and vascular tone in endothelial and smooth muscle cells (Gebska et al, 2008; Tang et al, 2003 ). In addition, as one of the main receptors for cGMP, PKGs mediate most of the effects of cGMP elevating drugs, such as nitric oxide-releasing agents and phosphodiesterase inhibitors which are used for the treatment of angina pectoris and erectile dysfunction, respectively (Kim et al, 2011). Polymorphisms in PRKG1 have been found to be associated with Type 2 diabetes (Saxena et al, 2007).
Epigenetic modulation of gene expression in Drosophila
Considering all that is known about the foraging gene and its role in behavioural phenotypes and physiological processes, one of the big questions that come to mind is how this gene is regulated. Over the past few years researchers in many fields have progressively focused on understanding differences in gene expression that are not mediated at the DNA sequence level. Examples of such mechanisms underlying the differential expression of genes are DNA methylation and histone modifications. Stable alterations of this kind are said to be ‗epigenetic‘, because they are heritable in the short term but do not involve mutations of the DNA itself (Cheung and Lau, 2005). Epigenetic processes are important for development, but they can also arise in mature organisms, either by random change or under influence of the environment (Jaenish and Bird, 2003).
Until recently, epigenetic research has been primarily focused on mammalian model systems, and although DNA methylation has been described in several other insect species (Field et al, 2004),
7
researchers had failed to detect methylated bases in the D. melanogaster genome. Several studies reporting the complete absence of DNA methylation in fly embryos (Urieli-Shoval et al, 1982), pupae (Patel and Gopinathan, 1987) and adults (Bird and Taggart, 1980; Rae and Steele, 1979) have led to the assumption that the fruit fly belongs to an atypical group of animals with no detectable genomic DNA methylation (Bird, 1995). This was countered by the discovery of cytosine methylation in early development stages of fly embryos by the eukaryotic DNA methyltransferase Dnmt2, the single candidate DNA methyltransferase gene in the Drosophila genome (Gowher et al, 2000; Lyko et al, 2000).
But epigenetic regulation is not mediated by DNA methylation alone. Other important factors are the methylation and acetylation of nucleosome histones, processes that are major determinants of chromatin structure and gene expression. On one hand, histone acetylation directly affects the condensation state of the DNA by removing the positive charge on the histones, and thereby decreasing the interaction of the N termini of histones with the negatively charged phosphate groups of DNA. On the other hand, methylation marks act as general signaling platforms, by specifically recruiting effector proteins to characteristic landmarks along the DNA.
Contrary to DNA methylation, histone modifications are a well-known phenomenon in D.
melanogaster (for review see Boros, 2012) and recently the Drosophila euchromatin histone methyltransferase (EHMT), a member of a conserved protein family that methylates histone 3 at lysine
9 (H3K9), was found to methylate histones in the region of the foraging gene promoters (Kramer et al, 2011).
Methylation of H3K9 is generally associated with formation of heterochromatin and consequently gene repression (Bannister et al, 2001; Jacobs et al, 2001; Lachner et al, 2001). Besides EHMT, there are two other known H3K9-specific HMTases in Drosophila that have been well characterized. SU(VAR)3-9 was shown to di- and trimethylate H3K9 at the chromocenter (Schotta et
al, 2002; Ebert et al, 2004) and DmSETDB1 mono- and dimethylates H3K9 in euchromatin,
dimethylates H3K9 on chromosome 4, and is required for silencing of variegating transgenes on chromosome 4 (Seum et al, 2007). EHMT was first identified by Stabell et al (2006), where it was described as the Drosophila homolog of the mammalian G9a, a histone methyltransferase that mono- and di-methylates H3K9 at euchromatic loci. In vitro, EHMT specifically mono-, di- and trimethylates lysines 9 and 27 at histone 3 and lysine 8, 12 or 16 in histone 4, a methylation pattern that is mainly correlated with gene silencing in the euchromatic region of the DNA (Martin and Zhang, 2005). Stabel
et al reported that dG9a (EHMT) RNA was present in low amounts in 0–3 h old embryos, but with
these transcripts probably being from maternal origin, since in 3–6 h old embryos the expression of
EHMT was barely detectable. In late embryogenesis and throughout larval development the
expression of EHMT was low but clearly discernible, with a slightly elevated expression during the third larval instar. There were no transcripts detectable in pupae, and in adult flies the expression was restricted to the gonads in both sexes. Interestingly, EHMT protein seems to accumulate in the ovary nurse cells, from where it is dumped into the growing oocyte, which indicates a role for EHMT in germ cell formation. Furthermore, the results suggested that EHMT is required for normal development, since RNAi knock out flies failed to undergo the transition from 3rd instar larvae to pupation. A role for
8
EHMT in regulation of genes correlated to ecdysone responsive signaling, especially during the onset
of metamorphosis and wing development was therefore proposed (Stabell et al, 2006).
Contrary to these results, Seum et al (2007) described EHMT as being a non-essential gene that is not required for fly viability. They reported homozygous deletion mutants to be viable and fertile, with no particular phenotype and could not find any EHMT mediated H3K9 methyltransferase activity
in vivo (Seum et al, 2007).
Recently, Kramer et al (2011) dissected the neuronal function of EHMT and found that EHMT mutants are viable and develop normally, but that EHMT regulates specific aspects of neuronal development and function. The study provided evidence that EHMT is widely expressed in the central nervous system and that it induces H3K9 dimethylation at about 5% of the euchromatic genome. The loss of EHMT in null mutants resulted in a decrease in dendrite branching in sensory neurons of the peripheral nervous system and in altered locomotory behaviour, as well as impaired non-associative learning and short- and long-term memory. Interestingly, many of the genes involved in the non-associative learning process are involved in cAMP and cGMP second messenger signaling pathways (Engel and Wu, 2009) and the fact that memory could be restored upon re-expression of EHMT in the nervous system of the adults suggests that EHMT mediates a dynamic epigenetic regulation in neurons (Kramer et al, 2010).
The relationship between transcriptional plasticity mediated by EHMT and behavioural phenotypes is also interesting from a human perspective, since mammals have two known EHMT paralogs (EHMT1/GLP and EHMT2/G9a) that form a heterodimeric complex which, like in flies, mediates gene repression by H3K9 dimethylation (Tachibana et al, 2005). In mice EHMT is essential for early embryogenesis and functional mutations in EHMT have been associated with severe growth retardation and early lethality (Tachibana et al, 2002) as well as cocaine addiction (Maze et al, 2010). In humans loss of function mutations in EHMT are one of the causes of Kleefstra Syndrome, a neurodevelopmental disorder that is characterized by autistic-like features and severe intellectual disability (Kleefstra et al, 2006). In addition, EHMT targets include fly orthologs of many genes underlying syndromic and non-syndromic forms of intellectual disability (Kramer et al, 2011).
The relationship of EHMT and foraging
Since the interplay between genes, transcriptional regulation, behaviours and environment is still poorly understood, it is important to find models that permit the study of these interactions. Taking into account the functional significance of for and EHMT and the fact that EHMT methylates histones in the for promoter region (evident as methylation at the for promoter is lost in EHMT null mutants), as well as the pleiotropy and multitude of physiological processes and phenotypes associated with EHMT and for, these two genes provide an excellent model to study both the genetic and environmental contributions to individual variations in animal behaviour.
With this project we aimed to shed light on how for is regulated and what mechanism(s) underlie the phenotypic differences between rovers and sitters, as well as test the hypothesis that epigenetic
9
regulation mediates plasticity in response to changing environmental conditions. For this, we started to tease apart interactions between EHMT and for, working with double mutants of these genes and performing a series of behavioural and molecular tests.
Results showed that the loss of EHMT significantly affects several phenotypic traits linked to
foraging. EHMT mutants showed higher fat storage levels and survived longer during starvation. In
addition, food related movement patterns in larva and adults were affected. Interestingly, the effect of
EHMT (or the loss of it) does not always seem to affect rovers and sitters equally, and in a general
way, sitters seem to be more affected than rovers. Moreover, in some cases, the effect of the loss of
EHMT only became evident by altering environmental parameters like food availability, suggesting that
11
2 - Materials and Methods
2.1 - Fly Stocks
The D. melanogaster rover and sitter lines were obtained from Sokolowski Lab central stocks maintained at the University of Toronto, Canada. EHMT+, EHMTDD1, EHMT+;forR/CyO, EHMT+;fors/CyO, EHMT+;fors2/CyO, EHMTDD1;forR/CyO, EHMTDD1;for/CyOs and EHMTDD1;fors2/CyO
lines were kindly provided by Jamie Kramer (University of Nijmegen, Netherlands).
The homozygous rover and sitter lines originated from wild type stocks that were selected for the forR and fors alleles based on rover or sitter phenotypes in larva path length assays (de Belle and Sokolowski, 1987). These lines have been repeatedly tested over many generations to ensure they maintain the rover and sitter larval foraging phenotypes.
The fors2 line is a mutant line consisting of a sitter allele in a forR second and third chromosome genetic background (Pereira and Sokolowski, 1993), and a simplified description of how it was generated is briefly described below. Homozygous forR males were exposed to gamma irradiation and subsequently crossed to homozygous fors females. Since forR is dominant over fors, F1 individuals expressing a sitter phenotype were selected to screen for mutations in the foraging gene (deBelle et
al, 1989). The resulting fors2 line is homozygous for a mutation in for which results in sitter larval behaviour on a rover genetic background.
EHMTDD1 and EHMT+ are P-element excision lines, derived from a reversion event where element KG01242 was inserted in the 5‘ UTR of the EHMT gene. EHMTDD1
was obtained by imperfect KG01242 excision, resulting in a 870 basepair deletion downstream of the original P-element insertion site, which includes the EHMT translational start site. EHMT+ served as a control in all experiments
and is a precise transposon excision line that represents the same genetic background as the deletion line. The original P-element line had an y1 mutated background, this is, a loss of function mutation in the yellow gene that results in defect body pigmentation, where mutant flies exhibit lighter body pigmentation than wild type flies. This background permitted detection of the P-element that has a functional yellow allele. Since yellow segregates with EHMT, after successful excision of KG01242, all excision lines show the y1 phenotype. Absence of functional and truncated EHMT in the EHMTDD1 line and presence of functional EHMT in the EHMT+ line have been previously confirmed by western blot
12
and immunohistochemistry analysis. Importantly, the neighbor gene, CG3038, was not affected by the deletion; consequently, EHMTDD1 is a strong and specific loss of function mutant and most likely a complete null allele (Kramer et al, 2011).
Initially, we obtained lines from Jamie Kramer which were made by crossing the EHMTDD1,
EHMT+, forR, fors and fors2 lines described above. These lines (EHMT+;forR/CyO, EHMT+;fors/CyO, EHMT+;fors2/CyO, EHMTDD1;forR/CyO, EHMTDD1;fors/CyOand EHMTDD1;fors2/CyO ) are homozygous
for the X chromosome with a y1 mutation and have either the EHMTDD1or EHMT+ allele; heterozygous for the second chromosome from forR , fors or fors2 lines and a CyO balancer chromosome. To obtain homozygous for lines, heterozygotes were crossed and CyO phenotypical marker (curly wings) selected against. The resulting lines were therefore homozygous for the X and 2nd chromosome and uncontrolled for the 3rd and 4th chromosomes. Since the EHMTDD1;forR is not viable as a homozygous population, this stock was maintained using the 2nd chromosome balancer CyO (EHMTDD1;forR/CyO).
These heterozygous populations originate 25 % healthy but sterile homozygous EHMTDD1;forR progeny each generation and only homozygous flies were used as test animals. The genotypes used for all subsequent tests were therefore: EHMT+;forR, EHMT+;fors, EHMT+;fors2, EHMTDD1;forR,
EHMTDD1;for s and EHMTDD1;fors2.
2.2 –Stock Maintenance and Starvation Treatments
Stock populations were kept on standard Sokolowski Lab medium (see below) at 20 ºC and 40 -60 % humidity with a 12 h light/dark cycle with lights on at 0800 h. Stock populations were changed into new vials every 15 days. Test populations were reared on standard Sokolowski Lab medium at 25 ºC and 60 % humidity with a 12 h light/dark cycle with lights on at 0800 h. The standard fly medium was prepared by mixing an autoclaved solution A (200 g sucrose, 16 g agar, 1 g KH2PO4, 8 g KNa Tartrate, 0.5 g NaCl, 0.5 g CaCl2, 0.5 g MgCl2, and Fe2(SO4)3 in 800 mL of dH2O) with solution B (25 g of dried yeast in 200 mL of dH2O at 50 ºC) and adding 5 mL of propionic acid. Either 60 mL polystyrene fly vials with matching buzzplugs and 10 mL of fly medium or 60 oz plastic culture bottles with matching buzzplugs and 25 mL of standard medium were used.
For food deprivation, fly vials were prepared with 10 mL of 1 % agar. A 2 mL eppendorf tube, filled with tap water and capped with a cotton disc, was embedded in the agar; this provided the flies with water to reduce any exacerbating effects of dehydration on the starvation stress. Food deprivation vials were stored at 4 ºC under airtight conditions for no more than 2 days.
To select first instar larva for behavioural experiments, grape juice agar was used, as the dark purple color medium provides increased contrast for picking larvae from the surface. The grape juice agar was prepared bringing 1.8 g of agar in 50 mL of dH2O and 45 mL of purple grape juice to a boil, cooling to 55 ºC and adding 2.5 mL acetate and 2.5 mL ethanol to prevent fungus from forming on the plates. The lids of 35x10 mm petri plates (these 35X10 mm lids fit perfectly into the holding bottles used in larval experiments) were filled to the rim with grape juice agar and stored at 4 ºC. To obtain
13
eggs, grape plates were fitted in the top opening of 60 oz plastic bottles with a hole cut in the side plugged with a sponge for air circulation. Once selected, first instar larva were placed in 100x15 mm petri dishes with 35 mL of standard medium for fed conditions and 35 mL of 1 % agar for food deprived conditions and allowed to develop under standard conditions.
2.3 – Viability Test
Viability tests were performed on EHMT+;forR, EHMT+;fors, EHMT+;fors2, EHMTDD1;forR,
EHMTDD1;for s and EHMTDD1;fors2 and forR , fors and fors2 strains. To control for larval density and ensure a healthy feeding environment, parental populations were set up using 5-6 days old flies. 15 virgin females and 8 males were introduced into standard rearing vials and individuals eclosed from these vials tested for viability. Once eclosed, 15 virgin females and 5 males were collected using CO2 anesthesia and aged separately for 5 - 6 days in fresh vials. After 5 - 6 days, males and female flies were placed together in holding bottles with grape plates containing yeast paste (pure yeast and water) to increase egg production. These populations were given an acclimatization period of 48 h, during which the grape plates were replaced every 24 h. After 48 h new grape plates were introduced and females were allowed to lay eggs for 4 h. Eggs were counted and 100 eggs were transferred on to 100 x 15 mm petri dishes with standard fly medium. L1 larva were counted after 24 and 32 h and introduced into rearing vials, in groups of 20 larvae. After 168 h and 10 days the number of pupae and the number of eclosed flies was scored. The animals were kept at 25 ºC and 60 % humidity with a 12 h light/dark cycle at all times and the test was repeated 5 times.
2.4 – Sterility Test
To further analyze the sterility EHMTDD1;forR strain, homozygous EHMTDD1;forR were crossed to wild type rover flies, where 15 virgin EHMTDD1;forR females and 5 EHMTDD1;forR males were crossed to 5 wild type forR males and 15 virgin forR females, respectively. The flies were allowed to lay eggs for 24 h on newly introduced grape plates, and the plates containing eggs incubated without flies for another 24 h. After this time, grape plates were screened for the presence of larva every 24 h for 2 days. The animals were kept at 25 ºC and 60 % humidity with a 12 h light/dark cycle at all times and the test was repeated 5 times.
14
2.5 – Larval Path Length Test
For the larval path length test, populations were built up in bottles for 3 generations. At this time, the eclosed progeny of the 3rd generation was collected over 3 days. Flies were then aged for 5 - 6 days before setting up the experiment. To obtain test larvae, these flies were transferred into holding bottles with grape plates to which a dab of thick yeast paste had been added in order to increase egg production. These bottles were incubated for an initial period of 24 h with grape plates facing down to ensure the flies were acclimatized to their new environment, at which time the plates replaced and incubated with flies for a further 24 h. After this 48 h, flies were removed and plates incubated for 20 h before clearing all eclosed larvae. For collection of precisely staged larvae, cleared plates were incubated for 4 h and test larvae collected.
Due to the large number of strain-treatment combinations tested, and the importance of exact timing, the strains were randomly divided into 3 test groups. In test group 1, a fresh grape plate was placed in the holding bottles at 1:00 pm; whereas fresh grape plates were added to bottles in test group 2 and 3 at 2 pm and 3 pm, respectively. As described above, flies were allowed to lay eggs on these grape plates for 24 h at which time grape plates were substituted and flies allowed to lay eggs for another 24 h. The grape plates with eggs were incubated for 20 h and cleared of all larvae using a probe under the microscope (i.e. test group 1, 2 and 3 were cleared of larva at 9, 10 and 11 am, respectively). The cleared plates were incubated for a further 4 h and first instar larva picked and placed on Petri dishes containing 35 mL of Drosophila medium (100 larvae were placed on each plate to control for density). Test group 1, 2 and 3 larvae were collected at 1, 2 and 3 pm, respectively. To obtain 3rd instar larva, plates were incubated for 92 h and 80 late 3rd instar larva (92 ± 0.5 h old) were then picked, rinsed with water and divided into 2 groups. The first group was placed into 100 x 15 mm petri dishes with 2 circular 50 mm diameter nutrient medium discs, the second group was food deprived in 100 x 15 mm petri dishes with 2 circular 50 mm diameter 1 % agar discs. Larva were incubated for another 4 h and then tested. Animals were kept at 25 ºC and 60 % humidity with a 12 h light/dark cycle at all times.
The larval foraging path length assay (Pereira et al, 1995) was developed to assess rover-sitter movement differences of Drosophila larva during foraging. The test measures the distance an individual larva travels during foraging over a 5 min period. The set up for this assay consists of plexiglass plates thinly spread with a homogeneous yeast suspension made of distilled water and Fleischmann‘s bakers‘ yeast in a 2:1 ratio by weight. This yeast paste permits to see the path a larva travelled during the test period. Each black plexiglas plate (25 cm width, 57 cm length, 0.5 cm height) has ten 0.5 mm deep circular wells of 8.5 cm diameter arranged in a 2 X 5 fashion. This set up permits the testing of a large number of larvae simultaneously.
For behavioural testing, larvae were gently picked from the food or agar using a small paintbrush, rinsed with dH2O to remove remaining food particles, and individual larvae placed in the center of the yeast coated wells. The wells were covered with a transparent plastic petri dish lid to prevent the drying out of the yeast paste and stop the larvae from leaving the test area. The testing period started from the moment the first larva was placed on the plate and ended after 5 min. Path
15
lengths were traced on the lids using a marker and the lids carefully kept for digitalization and statistical analyses. Following data collection, the path lengths recorded on the petri dish lids were passed onto white paper sheets using a lighted tracing table and scanned into the computer. Path lengths were measured with Image J 1.45 utilizing a 1 cm measured line as scale, therefore providing the path length in cm for each larva tested. Two separate experiments were conducted with this assay, as detailed below.
In the first experiment, EHMT+ and EHMTDD1 strains were tested with forR and fors as standard laboratory control lines. For each strain, 40 fed and 40, 4 h food deprived larva, exactly 96 ± 0.5 hours old, were tested individually. To assess male-female differences, the tested larvae were introduced into numbered isolation vials after being tested. The isolation vials were incubated at 25 ºC and 60 % humidity with a 12 h light/dark cycle and flies were scored for sex after eclosion. The test was repeated over 3 consecutive days.
In the second experiment, the following strains were tested; EHMT+;forR, EHMT+;fors,
EHMT+;fors2, EHMTDD1;forR, EHMTDD1;fors and EHMTDD1;fors2 as well as standard laboratory control lines forR , fors fors2. The procedure followed was the same as in the previous experiment, although larvae were not scored for sex. For EHMT+;forR, EHMT+;fors, EHMT+;fors2, EHMTDD1;fors and
EHMTDD1;fors2, forR , fors and fors2 30 larvae were tested. However, since the EHMTDD1;forR strain was maintained as EHMTDD1;forR/CyO, but only individuals homozygous for the 2nd chromosome could be used in the analyses, 90 larva were tested for this strain (considering an expected ratio of 1:3
EHMTDD1;forR/CyO progeny to be homozygous) and placed into isolation vials after testing (12x55 mm
glass vials with 1 mL of standard medium). These flies where reared to adulthood and screened for the curly wings phenotypical marker and only the larvae path length data from flies with wild type wings (therefore homozygous for forR) were used for analysis. This experiment was repeated over 5 consecutive days.
2.6 – Adult Foraging Assay
This assay was developed by Bryon Hughson in the Sokolowski Lab to screen for rover/sitter differences in adult feeding behaviour. The procedure was based and modified from previously used adult locomotory assay (Pereira and Sokolowski, 1993). Strains tested in this assay were EHMT+;forR,
EHMT+;fors, EHMT+;fors2, EHMTDD1;forR, EHMTDD1;fors and EHMTDD1;fors2 and forR, fors and fors2 as standard laboratory control lines. All tests were made under constant 23 - 24 ºC with 30 - 40 % humidity, during 1-5 pm to control for the effects of circadian feeding patterns. Tests were repeated over 10 days and sample sizes of n = 30 were tested for each strain. Strains were randomized and testing was performed without knowledge of the strains being tested.
To control for larval density and ensure a healthy feeding environment, parental populations were set up using 5 - 6 days old flies. 15 virgin females and 8 males were introduced into standard
16
rearing vials and 5 vials were set up for each genotype. The flies were allowed to lay eggs for 4 - 5 days and then brooded over into new rearing vials. After being brooded over, flies were given another 4 - 5 days to lay eggs and were then discarded. The vials with the larva were reared to adulthood and these adults were used as test animals. Test animals were collected on the first 3 days of eclosion using CO2 anesthesia and transferred into new rearing vials, individuals with obvious developmental abnormalities being discarded. The reason for collecting flies from the first three days only is that from the 4th day of eclosions onward, undersized flies appear. Because of the influence of body size (and correlation with macronutrient reserve quantities contained within the fat bodies) on feeding-related phenotypes these later eclosing undersized individuals were never used as test animals or as parents. Once eclosed, virgins females and males were aged for 5 - 6 days in nutrient vials (n = 15 - 20 / vial), and transferred to fresh vials every day, to ensure prime food quality. 24 h after collection, the wings of the females were clipped to keep the test flies from jumping onto the lid of the arena during the assay. For wing clipping, females were removed from the rearing vials with an aspirator and anesthetized on a CO2 pad. To minimize CO2 exposure and reduce possible effects on behaviour, flies were anesthetized and clipped one at a time, taking less than 10 seconds for each fly. The wings were clipped of at the base using dissecting scissors and tweezers under a microscope. After wing clipping, flies were introduced back into the nutrient vials. 48 h before the start of the test males and females of each genotype were mixed and allowed to mate. All test flies were food deprived 24 ± 0.5 h before being tested, using the food deprivation vials described in 2.2. Only females were tested in this assay. The set up for this assay consisted in a 15 cm diameter x 1.5 cm height round arena with an acclimatization chamber underneath and an elevator shaft through which the test animal was allowed to enter the arena at the center. The arena was divided into 4 quadrants, each with a 2 cm circle in the center. In the center of each circle was placed a 0.2 µL drop of 0.1 % sucrose with blue food dye. The rim around the edge of the arena was filled with water to prevent the flies from climbing up the walls and a lid was placed on top of the arena that allowed for uniform illumination.
For testing, a single fly was introduced into the acclimatization chamber underneath the arena using an aspirator, and given a 2 min acclimatization period. After this period the barrier to the elevator shaft was removed and the fly was allowed to climb into the arena. Special care was taken to not disturb the fly during this process. The test period started at the moment the fly entered the arena, and the number of sucrose drops the fly consumed was scored at 5 and at 10 min.
2.7 – Starvation Resistance Assay
The starvation resistance assay aims to assess differences in survivorship of adult flies in an environment with no nutrient availability. Flies were reared and tested at 25 ºC and 60 % humidity in a 12:12 L:D cycle at all times and incubators were not opened except for scoring to minimize disturbances that could cause stress to the test animals. Strains tested in this assay were EHMT+;forR,
EHMT+;fors, EHMT+;fors2, EHMTDD1;forR, EHMTDD1;fors and EHMTDD1;fors2 and forR, fors and fors2 as standard laboratory control lines.
17
For this assay, the parental generation was reared as in 2.6. Test animals were collected on the first 3 days of eclosion using CO2 anesthesia and aged for 5 - 6 days in nutrient vials with an n = 20 in each vial. Test animals were changed over to fresh nutrient vials every 24 h, and 48 h before the 10 test females in each vial were allowed to mate with 10 males (these males were not used in the test). Males and females were tested separately in this assay. 10 males or females were introduced into food deprivation vials described in 2.2 using an aspirator and no anesthesia. 10 replicate vials were set up for females and males of each strain and replicates were set up at the same time (t = 12 pm ± 0.5 h) to eliminate day and circadian feeding pattern effects.
During the test period, all vials were scored for dead flies every 6 h (i.e. at 12 pm, 6 pm, 12 am and 6 am). The test lasted until the last fly was dead and a fly was scored as dead if motionless even upon light tapping of the vial.
2.8 – Total Triglyceride and Protein Quantification
Total triglyceride levels were measured in female flies to assess differences in fat storage in the test strains. For this purpose, total protein levels were used as a reference to eliminate possible variations during the extraction process. Parental generations were set up as described in 2.6 and 6 vials were set up for each of the following strains: EHMT+;forR, EHMT+;fors, EHMT+;fors2,
EHMTDD1;forR, EHMTDD1;for s and EHMTDD1;fors2 and forR, fors and fors2 as standard laboratory control lines. To control for density and assure equal feeding conditions, test females were collected over the first 3 days of eclosion and transferred into fresh nutrient vials with an n = 20 per vial,. Flies were allowed to age 4 - 5 days and test flies were transferred into fresh nutrient vials every 24 h to guarantee food quality. After this time, 5 males were introduced in the vials and the females were allowed do mate for 24 h (males were not tested in this assay). 5 - 6 day old flies were separated into 2 experimental groups, one group was maintained on standard rearing nutrient medium for 24 h and the second group was transferred into food deprivation vials described in 2.2 and food deprived for 24 h. Flies were maintained at 25 ºC and 60 % humidity in a 12:12 L:D cycle at all times. Fed and food deprived flies were anesthetized with CO2 and groups of 4 flies were transferred into previously weighted 1.5 mL eppendorf tubes. The tubes with the flies were weighted and flash frozen in liquid nitrogen. Samples were stored at -80 ºC until further use.
Total triglyceride and protein homogenates were prepared as previously published (Grönke, et al., 2005) with the modifications described below. Sample tubes with flies were removed from -80 ºC and processed on ice as follows: 500 µL of 0.5 % Tween in PBS buffer was added to each sample, samples were homogenized for 30 sec with a mechanical homogenizer (or until no noticeable chunks of tissue were left), another 500 µL of 0.5 % Tween in PBS was added and samples were vortexed for 5 sec. After vortexing, samples were incubated in a 70 ºC water bath for 5 min and cooled on ice for 2 min. Samples were centrifuged for 1 min at 5000 rpm and 500 µL of the supernatant was transferred into new 1.5 mL eppendorf tubes. Finally, samples were centrifuged for 3 min at 14000 rpm and 450