Repositório ISCTE-IUL
Deposited in Repositório ISCTE-IUL:
2019-01-08
Deposited version:
Post-print
Peer-review status of attached file:
Peer-reviewed
Citation for published item:
Ferreira, J. J. M., Fernandes, C. I. & Ferreira, F. A. F. (2018). To be or not to be digital, that's the question! Implications for firm innovation capability and performance. In 8th Global Innovation and Knowledge Academy, GIKA 2018. Valência
Further information on publisher's website:
--Publisher's copyright statement:
This is the peer reviewed version of the following article: Ferreira, J. J. M., Fernandes, C. I. & Ferreira, F. A. F. (2018). To be or not to be digital, that's the question! Implications for firm innovation capability and performance. In 8th Global Innovation and Knowledge Academy, GIKA 2018. Valência. This article may be used for non-commercial purposes in accordance with the Publisher's Terms and Conditions for self-archiving.
Use policy
Creative Commons CC BY 4.0
The full-text may be used and/or reproduced, and given to third parties in any format or medium, without prior permission or charge, for personal research or study, educational, or not-for-profit purposes provided that:
• a full bibliographic reference is made to the original source • a link is made to the metadata record in the Repository • the full-text is not changed in any way
The full-text must not be sold in any format or medium without the formal permission of the copyright holders. Serviços de Informação e Documentação, Instituto Universitário de Lisboa (ISCTE-IUL)
Av. das Forças Armadas, Edifício II, 1649-026 Lisboa Portugal Phone: +(351) 217 903 024 | e-mail: [email protected]
To be or not to be digital, that's the question!
Implications for firm innovation capability and performance
João J. M. Ferreira*
Department of Business and Economics & NECE Research Unit, University of Beira Interior
Estrada do Sineiro, 6200-209 Covilhã, Portugal
Cristina I. Fernandes
Department of Business and Economics & NECE Research Unit, University of Beira Interior
Estrada do Sineiro, 6200-209 Covilhã, Portugal
Fernando A. F. Ferreira
ISCTE Business School, BRU-IUL, University Institute of Lisbon Avenida das Forças Armadas, 1649-026 Lisbon, Portugal
&
Fogelman College of Business and Economics, University of Memphis Memphis, TN 38152-3120, USA
[email protected] or [email protected]
Abstract
Digital transformation emerges today as a process for attaining competitive advantages and company differentiation. However, what are the implications of these digital processes for the innovative capability and performance of companies? This study seeks to contribute towards a better understanding of this framework, analysing the factors that lead companies to adopt new digital processes and their consequences in terms of innovation capability and performance. Using a sample of 940 companies and recourse to multivariate statistical analysis, we conclude that the profile of the owner/manager and the adoption of new digital processes reflect in the greater competitiveness of these (digital) companies.
Keywords: digital transformation; innovation; entrepreneurship.
1. Introduction
Schumpeter (1934) conceives an entrepreneur as an individual assigned to the role of managing the implementation of new combinations of resources and capabilities, highlighting that his/her role consists of identifying and implementing new opportunities for firms. However, it was only after the 1980s that the interest in this research topic began to crystallize around the role of entrepreneurship in economic development, largely due to the revolution experienced in endogenous growth studies. This academic trend resulted in a new wave of research focused on the individual capability to deal with risk and placing this at the center of economic analysis (Groot et
al., 2004).
Innovation initiatives in the digital sector have attracted increasing levels of interest from researchers and practitioners, primarily because of the added value these activities bring in terms of economic development (Heirman & Clarysse, 2007; Kuester
et al., 2018). The digital sector is, therefore, considered strategic not only to generate
innovation but also for knowledge and technology transfer (Acs et al., 2009; Tether & Tajar, 2008). The digitization of internal firm processes brings new and disruptive market opportunities for firms seeking to develop and launch innovations based on entrepreneurial ideas (Heirman & Clarysse, 2007; Kuester et al., 2018). In the light of this reasoning, it is worth noting that the increasingly rapid and widespread digitization of innovation processes and results has allowed for the formulation of new theories on innovation management, questioning the fundamental assumptions about the boundaries of the innovation definition, innovation agency, and the relationship between innovation processes and firm performance (Nambisan, 2016).
Technology has dramatically affected today’s highly competitive business environment (Davis et al., 2015). Digital technologies have transformed the way organizations and consumers interact and exchange value (Yadav & Pavlou, 2014). For example, there are now expectations that augmented reality will revolutionize how individuals interact with the physical environments in which they operate. Therefore, although digitization is not a new phenomenon, it continues to evolve and produce new effects in the business environment.
Although progress has taken place in this field of research, the literature dealing with the role of digital technologies in the formation of entrepreneurial opportunities, decisions, innovation capability and business performance is still scarce. As digital
technologies fundamentally transform companies and industries, questioning the intellectual assumptions and themes underlying innovation management, research in this area needs to incorporate concepts and theoretical constructs that reflect the multiple ways in which the digitization of processes can change the practical results of innovation (Autant-Bernard et al., 2006; Lyytinen et al., 2016). Indeed, as Nambisan et
al. (2017) and Kuester et al. (2018) note, the influence of digitization on firm
innovation capability and performance remains a largely unexplored topic.
This study sought to contribute to overcoming this gap in the literature. Although digital transformation opens up potential means for the development of companies, little is known on how this relationship evolves (Berger & Kuckertz, 2016; Dy et al., 2017; Ferreira & Fernandes, 2017). Recourse to digitization also changes both the nature of innovation capabilities and entrepreneurial activities (Kuester et al., 2018). Accordingly, two questions need to be answered: “What reasons may lead a company to choose new digital processes?” and “What are the implications for its innovation capability and business performance?” This study aims to contribute to answering these fundamental questions by analyzing the extent to which innovation capabilities in digital scenarios impact on firm performance.
Methodologically, our study tests the propositions related to the two questions posed in the context of digital and non-digital sectors (n = 940) in Portugal. Empirical evidence supports the need for companies to be aware of changes in the digital world and how they can gain sustainable competitive advantages in terms of innovation and performance improvement. In this sense, this study contributes to the advancement of our understanding in this field of research and explores some fruitful ways of looking at the impact of the uses of digital technologies on innovation capability and business performance.
The remainder of this paper is organized as follows. The next section presents the literature review. Section three presents the methodological procedures followed. Section four presents the outcomes of our study. The final section concludes the paper, presenting final remarks and laying the groundwork for future research.
2. Literature review
Richard and Devinney (2005) propose that companies are increasingly seeking to bring about their transformation by adopting a business to business (B2B) strategy in keeping with the deployment of new digital technologies. Various other authors maintain that, due to the complex nature of the digital market, no single actor may provide a service to clients as a complete solution meeting all of their needs. There is thus the need to maintain viable alliances and to create value through networking with the right partners (Pigneur, 2000; Barnes, 2002; Sabat, 2002; Canhoto, et al., 2016, Pagani and Pardo, 2018).
Despite entrepreneurs very often act as drivers of creativity and invention at the organic beginning of various stages, they may not always hold the leadership capabilities necessary to adapting to the more rigid processes of production and commercialisation. Such entrepreneurs may indeed become obstacles to outsourcing decisions to third parties or networked solutions. This might constitute a vital stage to establishing the concepts necessary to commercial implementation (Holt, 1992; Davidsson et al., 2001; Hill, 2001; Harryson, 2008). Porter and Kramer (2011) pay particular attention to the concept of “creating shared value”. This emerged in response to a decline in the trust in business and a corresponding slide in the legitimacy of capitalism in many countries. Shared value describes the policies and practices of a company that improve its competitiveness while simultaneously strengthening the economic and social conditions in the surrounding host communities. Hence, expanding the level of digitization in our daily socioeconomic system involves representing, processing, storing and communicating the broadest possible range of contents, energy and information (Yoo et al., 2010; Yoo 2012; Tilson et al., 2010). This digitization therefore enables the radical reconfiguration of the design and production of almost all the products of the industrial age – now transforming into the Internet of Things (Ashton, 2009; European Commission, 2009; Lyytinen, 2016). We are thus moving towards digital innovation that incorporates the usage of digital technology throughout the innovation process. Digital innovation also serves to describe, whether totally or partially, the results of innovation (Boudreau and Lakhani 2013; Hui 2014; Iansiti and Lakhani 2014; OCDE 2016; Porter and Heppelmann 2014, 2015; Nambisan, 2017). The increase in digitization has led researchers to increasingly question the explanatory powers and utility of existing innovation (Goldfarb and Tucker, 2012; Yoo et al., 2012;
Greenstein et al., 2013; Barrett et al., 2015; Benner and Tushman 2015). The future impact of digital transformation may thus not be susceptible to forecasting through simple quantitative extrapolations of past experiences with earlier information technologies. There are also qualitative difference for taking into consideration driven on the one hand by the subsequent development of system architectures and facets of the hardware and, on the other hand, by the intrinsic characteristics of innovation itself (Brettel et al., 2014; Gölzer and Fritzsche, 2017).
3. Methodology 3.1. Data
In order to obtain the study goals, we applied a questionnaire via a telephone interview with 940 Portuguese companies and firms, distributed across different economic sectors of activity (Agriculture – 16.0%; Extractive Industry – 7.0%; Manufacturing Industry – 31.5%; Construction – 7.9%; Services – 36.0%) and across all of Portugal (Norte - 24.6%; Centro – 32.1%; Lisbon – 7.0%; Alentejo – 19.4%; Algarve – 5.0%; Madeira – 3.4%; Azores – 8.5%).
3.2. Measures Dependent Variable
As this study seeks to ascertain just which factors lead companies to adopt new digital processes and their implications for their innovative capabilities and performance levels, we applied the following dependent variables:
The company adopted new digital processes in 2016 (No vs Yes) No. of innovations in products/services in 2016
No. of process innovations in 2016
Total no. of innovations in products/services and processes in 2016
Business turnover in 2016 (< €50,000, €50,000 - €100,000, €100,000 - €200,000, €200,000 - €300,000, €300,000 - €400,000, €400,000 - €500,000, > €500,000).
Predictor Variables Control variables
The control variables applied in the analysis incorporated the Economic Activity sector and the Location of the aforementioned companies, The company’s track record (in years), and the Age (in years), Prior Experience in the Sector (in years), Level of Education (Primary, Secondary, Higher) and Gender (Male, Female) of the entrepreneur or company manager.
Independent variables
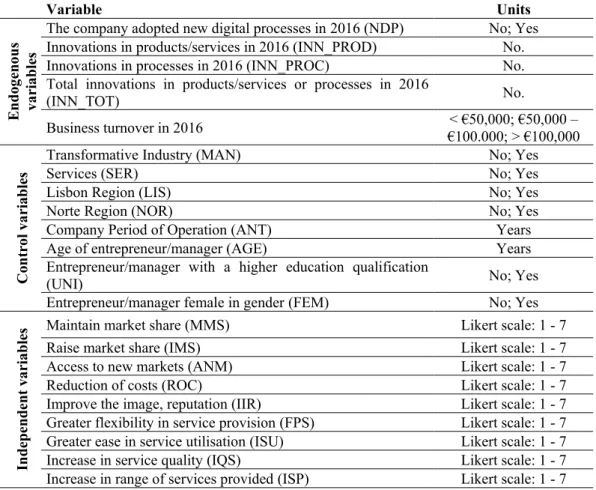
As regards the variables predicting the adoption of new digital processes, we applied nine items that reflected the importance attributed to the new digital processes (on a scale of 1 to 7) in terms of: Maintaining market share; Raising market share; Access to new markets; Reduction of costs; Improvements to image, reputation; Greater flexibility in service provision; Greater ease of using service; Boosting service quality; Expanding the range of services provided. Table 1 presents an overall summary of the variables deployed in this study.
Table 1. Variables applied in the analysis
Variable Units E n d og en ou s va ri ab le s
The company adopted new digital processes in 2016 (NDP) No; Yes
Innovations in products/services in 2016 (INN_PROD) No.
Innovations in processes in 2016 (INN_PROC) No.
Total innovations in products/services or processes in 2016
(INN_TOT) No. Business turnover in 2016 €100.000; > €100,000 < €50,000; €50,000 – C on tr ol v ar ia b le s
Transformative Industry (MAN) No; Yes
Services (SER) No; Yes
Lisbon Region (LIS) No; Yes
Norte Region (NOR) No; Yes
Company Period of Operation (ANT) Years
Age of entrepreneur/manager (AGE) Years
Entrepreneur/manager with a higher education qualification
(UNI) No; Yes
Entrepreneur/manager female in gender (FEM) No; Yes
In d ep en d en t va ri ab le
s Maintain market share (MMS) Likert scale: 1 - 7
Raise market share (IMS) Likert scale: 1 - 7
Access to new markets (ANM) Likert scale: 1 - 7
Reduction of costs (ROC) Likert scale: 1 - 7
Improve the image, reputation (IIR) Likert scale: 1 - 7
Greater flexibility in service provision (FPS) Likert scale: 1 - 7
Greater ease in service utilisation (ISU) Likert scale: 1 - 7
Increase in service quality (IQS) Likert scale: 1 - 7
3.2. Data Analysis
In order to characterise the sample studied, we determined some descriptive statistics (mean and standard deviation) for the variable included for analysis as well as their respective correlations.
As regards modelling the variables that influence the adoption of new digital processes, we made recourse to binary regression. We furthermore analysed the probit and logit models. In accordance with the Akaike Information Criterian (AIC) and
Bayesian Information Criterian (BIC) and the R2, the method that best adjusts to the
data here is that of logistic distribution (Cameron & Trivedi, 2005). The function deployed in the logistic regression to estimate the probability of a particular event j (j = 1, …,n) in the dependent variable for achieving “success”, thus, companies adopting new digital processes, is l ( = 1 = ), and expressed as: = , in which is the vector of the probabilities estimated, X is the matrix of independent variables and is the vector for the logistic regression coefficients.
Linearizing this function through the logit transformation of the dependent variable results in the logistic regression econometric model under analysis:
= + + + + +
+ + + + + +
+ + + + + +
+
This is how we applied the logistics model to estimate the Odds Ratio (OR). In the models calculated in order to determine the impact of the adoption of new digital processes within the scope of company innovative capaciies, thus the number of innovations in products/services and processes, corresponding to the discrete count variables, we applied count models. Applying the same criteria as for the binary regressions (AIC, BIC and -2 LL), this method best adjusts to the data and derives from the Poisson distribution as an alternative to models based on negative binomial distribution (Cameron & Trivedi, 2005). The Poisson distribution for determining the probability of the occurrences of events over a specific period of time is ( = / ) =
µµ
! , in which µ corresponds to the mean process rate. The Poisson regression derives
from the Poisson distribution through recalculating the parameters for the relationship between the mean µ and the regressor x, with three different model estimated:
[ _ ] = [ _ ] = [ _ ] =
In terms of the econometric modelling of company performance, measured by the business turnover, we deployed ordinal regression given that this was a structured categorical variable (< €50,000€, €50,000€ - €100,000, €100,000 - €200,000, > €200,000). Based on AIC, BIC and -2 LL, the most appropriate method is that based on logistic distribution (Cameron & Trivedi, 2005). The ordinal logistic regression model assumes that the relationship between the explanatory variable and structure categorical variable is categorically independent, with the correspondingly calculation of the following econometric models:
= + + + + + +
+ + + + + _
+ _
= + + + + + +
+ + + + + _
In order to estimate the diverse model parameters, we made recourse to the maximum likelihood method and coupled with robust standard errors in order to eliminate any possible problem with heteroscedasticity. For every regression, we analysed the existence of variables with potentially multicollinearity effects through variance inflation factors (VIF), which should ideally return results of below 5 (Hair, Black, Babin, Anderson, & Tatham, 2010).
We applied IBM SPSS software version 25.0 (IBM Corporation, New York, USA) to process the data thereby obtained.
4. Results
The results stemming from analysis of the data of 940 companies feature in two different sections with the first detailing the characterisation of the sample and with the seconding containing the results arising from the various different econometric estimates.
4.1. Sample characteristics
In terms of the company characteristics (Table 2), we may observe that the average displayed a total number of years in business (ANT) of 6.78 ± 6.36 years, 14.8% reported a business turnover (PER) in 2016 of below 50,000 euros, 11.0% registered volumes of between 50,000 and 100,000 euros and 65.4% recorded turnover of over 100,000 euros.
Table 2. Characteristics of the sample according to the adoption of new digital processes
Total
(n=940)
Did not adopt new digital processes (n=760) Adopted new digital processes (n=180) p N % N % N % MAN 296 31.5% 238 31.3% 58 32.2% 0.814 SER 338 36.0% 284 37.4% 54 30.0% 0.064 LIS 66 7.0% 42 5.5% 24 13.3% 0.000* NOR 231 24.6% 183 24.1% 48 26.7% 0.468 ANT, mean ± SD 6.78 ± 6.36 6.05 ± 6.15 9.87 ± 6.29 0.000* AGE, mean ± SD 42.57 ± 8.28 42.90 ± 8.38 41.18 ± 7.70 0.012* EXP, mean ± SD 4.37 ± 3.40 4.39 ± 3.44 4.28 ± 3.41 0.679 UNI 460 48.9% 300 39.5% 160 88.9% 0.000* FEM 96 10.2% 62 8.2% 34 18.9% 0.000* MMS, mean ± SD 2.59 ± 1.67 2.60 ± 1.67 2.46 ± 1.27 0.098 IMS, mean ± SD 3.97 ± 0.81 3.89 ± 0.81 4.29 ± 0.72 0.000* ANM, mean ± SD 3.37 ± 1.30 3.29 ± 1.31 3.72 ± 1.21 0.000* ROC, mean ± SD 3.70 ± 1.24 3.73 ± 1.19 3.60 ± 1.45 0.274 IIR, mean ± SD 2.05 ± 1.38 2.08 ± 1.38 1.91 ± 1.29 0.067 FPS, mean ± SD 2.88 ± 1.30 2.81 ± 1.25 3.18 ± 1.50 0.002* ISU, mean ± SD 3.10 ± 1.20 2.97 ± 1.15 3.64 ± 1.29 0.000* IQS, mean ± SD 3.34 ± 1.08 3.14 ± 1.05 4.17 ± 0.81 0.000* ISP, mean ± SD 3.18 ± 1.26 3.03 ± 1.22 3.80 ± 1.26 0.000* INN_PROD, mean ± SD 0.55 ± 0.91 0.25 ± 0.59 1.84 ± 0.93 0.000* INN_PROC, mean ± SD 0.02 ± 0.25 0.00 ± 0.08 0.10 ± 0.53 0.016* INN_TOT, mean ± SD 0.58 ± 0.95 0.25 ± 0.59 1.94 ± 0.97 0.000* PER < 50,000 139 14.8% 81 10.7% 58 32.2% 0.000* 50,000 - 100,000 103 11.0% 68 8.9% 35 19.4% > 200,000 615 65.4% 567 74.6% 48 26.7% * p < 0.05
4.2. Econometric modelling
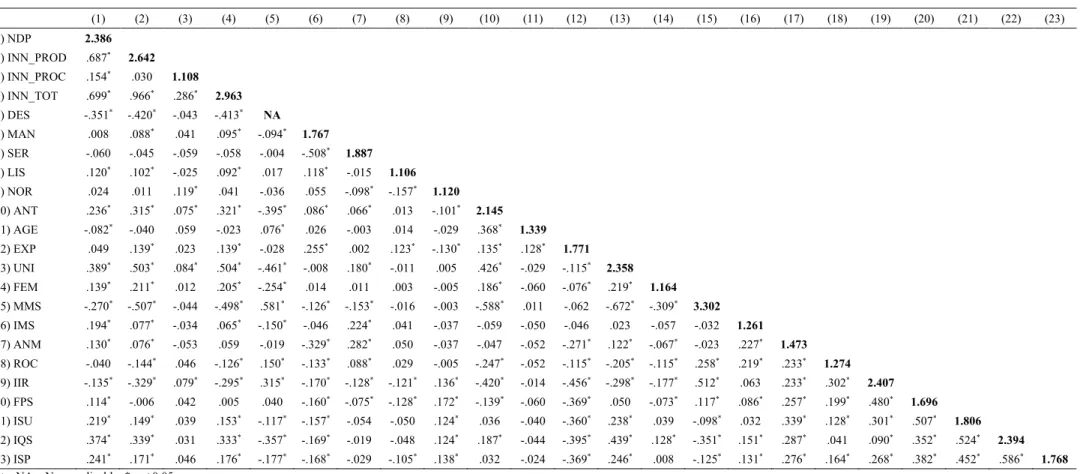
In the first phase, we evaluated the potential effects of multicollinearity through VIF and correspondingly finding that all results were below 5 (with the highest at 3.302) and thus confirming the non-existence of multicollinearity among the different exogenous variables in the different econometric models (Table 3).
As regards the factors forecasting the adoption of new digital processes, we modelled these through binary logistic regression (Table 4).
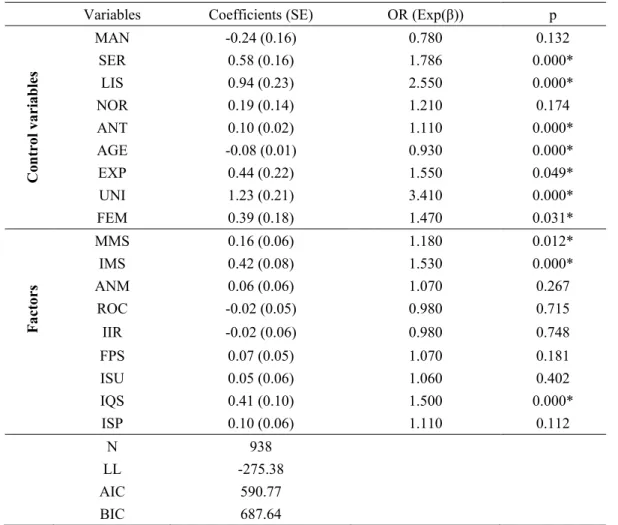
Table 3. Logistic Regression, Dependent Variable: Adoption of new digital processes
Variables Coefficients (SE) OR (Exp(β)) p
C on tr ol v ar ia b le s MAN -0.24 (0.16) 0.780 0.132 SER 0.58 (0.16) 1.786 0.000* LIS 0.94 (0.23) 2.550 0.000* NOR 0.19 (0.14) 1.210 0.174 ANT 0.10 (0.02) 1.110 0.000* AGE -0.08 (0.01) 0.930 0.000* EXP 0.44 (0.22) 1.550 0.049* UNI 1.23 (0.21) 3.410 0.000* FEM 0.39 (0.18) 1.470 0.031* F ac to rs MMS 0.16 (0.06) 1.180 0.012* IMS 0.42 (0.08) 1.530 0.000* ANM 0.06 (0.06) 1.070 0.267 ROC -0.02 (0.05) 0.980 0.715 IIR -0.02 (0.06) 0.980 0.748 FPS 0.07 (0.05) 1.070 0.181 ISU 0.05 (0.06) 1.060 0.402 IQS 0.41 (0.10) 1.500 0.000* ISP 0.10 (0.06) 1.110 0.112 N 938 LL -275.38 AIC 590.77 BIC 687.64
Note: LL – Log Likelihood; * p < 0.05
We would note that the factors for Maintain market share (IMS) (OR=1.53; p < 0.01), Raise market share (MMS) (OR=1.18; p < 0.05) and Raise service quality (IQS) (OR=1.50; p < 0.01) return a statistically positive influence on the adoption of new digital processes in which the greater the extent of importance attributed to these factors, the greater the propensity for companies to implement new digital processes. In
terms of the control variables of the company type and entrepreneur/manager, we may report that service sector companies (SER) (OR=1.79; p < 0.01) and those in the region of Lisbon (LIS) (OR=2.55; p < 0.01) display a greater probability of implementing new digital processes with their length of time in business (ANT) also significantly raising this likelihood (OR=1.11; p < 0.01), while the older the company entrepreneur/manager (AGE), the lower the propensity to implement digital business processes (OR=0.93; p < 0.01), even while the greater the years of experience in the sector (EXP) raises the probability of new digital processes getting adopted (OR=1.55; p < 0.05) and with entrepreneurs/managers with university level education (UNI) (OR=3.41; p < 0.01) and female in gender (FEM) (OR=1.47; p < 0.05) register a greater likelihood of putting new digital processes into practice. We may thus conclude, in accordance with the position maintained by Richard and Devinney (2005), that companies adopt postures in keeping with the market needs prevailing and focused on their markets.
Table 4. Correlations between the variables applied in the econometric models (VIF in diagonal and bold) (1) (2) (3) (4) (5) (6) (7) (8) (9) (10) (11) (12) (13) (14) (15) (16) (17) (18) (19) (20) (21) (22) (23) (1) NDP 2.386 (2) INN_PROD .687* 2.642 (3) INN_PROC .154* .030 1.108 (4) INN_TOT .699* .966* .286* 2.963 (5) DES -.351* -.420* -.043 -.413* NA (6) MAN .008 .088* .041 .095* -.094* 1.767 (7) SER -.060 -.045 -.059 -.058 -.004 -.508* 1.887 (8) LIS .120* .102* -.025 .092* .017 .118* -.015 1.106 (9) NOR .024 .011 .119* .041 -.036 .055 -.098* -.157* 1.120 (10) ANT .236* .315* .075* .321* -.395* .086* .066* .013 -.101* 2.145 (11) AGE -.082* -.040 .059 -.023 .076* .026 -.003 .014 -.029 .368* 1.339 (12) EXP .049 .139* .023 .139* -.028 .255* .002 .123* -.130* .135* .128* 1.771 (13) UNI .389* .503* .084* .504* -.461* -.008 .180* -.011 .005 .426* -.029 -.115* 2.358 (14) FEM .139* .211* .012 .205* -.254* .014 .011 .003 -.005 .186* -.060 -.076* .219* 1.164 (15) MMS -.270* -.507* -.044 -.498* .581* -.126* -.153* -.016 -.003 -.588* .011 -.062 -.672* -.309* 3.302 (16) IMS .194* .077* -.034 .065* -.150* -.046 .224* .041 -.037 -.059 -.050 -.046 .023 -.057 -.032 1.261 (17) ANM .130* .076* -.053 .059 -.019 -.329* .282* .050 -.037 -.047 -.052 -.271* .122* -.067* -.023 .227* 1.473 (18) ROC -.040 -.144* .046 -.126* .150* -.133* .088* .029 -.005 -.247* -.052 -.115* -.205* -.115* .258* .219* .233* 1.274 (19) IIR -.135* -.329* .079* -.295* .315* -.170* -.128* -.121* .136* -.420* -.014 -.456* -.298* -.177* .512* .063 .233* .302* 2.407 (20) FPS .114* -.006 .042 .005 .040 -.160* -.075* -.128* .172* -.139* -.060 -.369* .050 -.073* .117* .086* .257* .199* .480* 1.696 (21) ISU .219* .149* .039 .153* -.117* -.157* -.054 -.050 .124* .036 -.040 -.360* .238* .039 -.098* .032 .339* .128* .301* .507* 1.806 (22) IQS .374* .339* .031 .333* -.357* -.169* -.019 -.048 .124* .187* -.044 -.395* .439* .128* -.351* .151* .287* .041 .090* .352* .524* 2.394 (23) ISP .241* .171* .046 .176* -.177* -.168* -.029 -.105* .138* .032 -.024 -.369* .246* .008 -.125* .131* .276* .164* .268* .382* .452* .586* 1.768
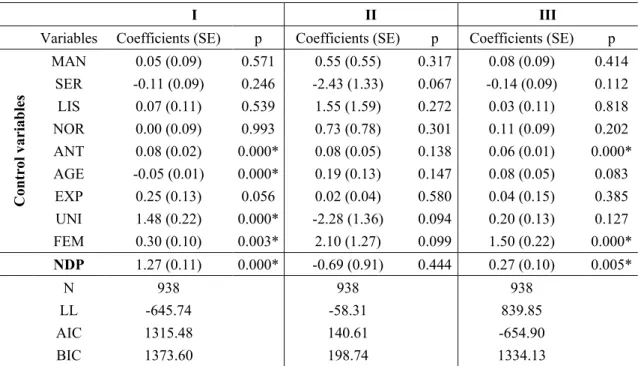
The results of determining the impact of adopting new digital processes, the number of product/service and process innovations and the overall totals features in the Poisson regression estimates in Table 5.
Table 5. Possion Regression, Dependent variable: Number of innovations in products/services (I), processes (II) and totals (III)
I II III
Variables Coefficients (SE) p Coefficients (SE) p Coefficients (SE) p
C on tr ol v ar ia b le s MAN 0.05 (0.09) 0.571 0.55 (0.55) 0.317 0.08 (0.09) 0.414 SER -0.11 (0.09) 0.246 -2.43 (1.33) 0.067 -0.14 (0.09) 0.112 LIS 0.07 (0.11) 0.539 1.55 (1.59) 0.272 0.03 (0.11) 0.818 NOR 0.00 (0.09) 0.993 0.73 (0.78) 0.301 0.11 (0.09) 0.202 ANT 0.08 (0.02) 0.000* 0.08 (0.05) 0.138 0.06 (0.01) 0.000* AGE -0.05 (0.01) 0.000* 0.19 (0.13) 0.147 0.08 (0.05) 0.083 EXP 0.25 (0.13) 0.056 0.02 (0.04) 0.580 0.04 (0.15) 0.385 UNI 1.48 (0.22) 0.000* -2.28 (1.36) 0.094 0.20 (0.13) 0.127 FEM 0.30 (0.10) 0.003* 2.10 (1.27) 0.099 1.50 (0.22) 0.000* NDP 1.27 (0.11) 0.000* -0.69 (0.91) 0.444 0.27 (0.10) 0.005* N 938 938 938 LL -645.74 -58.31 839.85 AIC 1315.48 140.61 -654.90 BIC 1373.60 198.74 1334.13
Note: LL – Log Likelihood; * p < 0.05
The companies adopting new digital processes (NDP) present a significantly higher number of innovations in product/services (β=1.27; p < 0.01) and totals (β=0.27; p < 0.01) that demonstrates their greater level of innovative capability. We also find that the longer the track record of the company (ANT) then the greater is the number of innovations in both products/services (β=0.08; p < 0.01) and totals (β=0.06; p < 0.01), all the while the older the company entrepreneur/manager then the lower the number of product/service innovations (β=-0.05; p < 0.01), offset by whenever such individuals have obtained higher education qualifications that raises the number of innovations in products/services (β=1.48; p < 0.01) and by female entrepreneurs/managers (FEM) introducing greater numbers of products/services (β=0.30; p < 0.01) and totals of innovations (β=1.50; p < 0.01). This furthermore highlights that no variable attains a statistically significant predictive effect for the number of innovations in processes.
Table 6 displays the results of the econometric estimates from the ordinal
innovations in products/services and in processes (I) and the other with the total number of innovations (II).
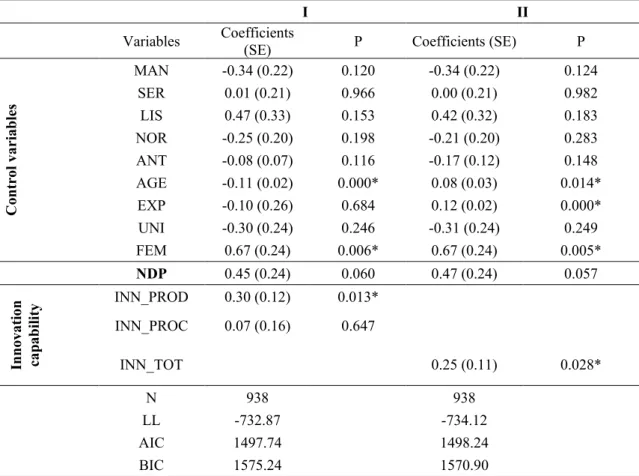
Table 6. Ordinal Logistic Regression, Dependent variable: Business turnover
I II
Variables Coefficients (SE) P Coefficients (SE) P
C on tr ol v ar ia b le s MAN -0.34 (0.22) 0.120 -0.34 (0.22) 0.124 SER 0.01 (0.21) 0.966 0.00 (0.21) 0.982 LIS 0.47 (0.33) 0.153 0.42 (0.32) 0.183 NOR -0.25 (0.20) 0.198 -0.21 (0.20) 0.283 ANT -0.08 (0.07) 0.116 -0.17 (0.12) 0.148 AGE -0.11 (0.02) 0.000* 0.08 (0.03) 0.014* EXP -0.10 (0.26) 0.684 0.12 (0.02) 0.000* UNI -0.30 (0.24) 0.246 -0.31 (0.24) 0.249 FEM 0.67 (0.24) 0.006* 0.67 (0.24) 0.005* NDP 0.45 (0.24) 0.060 0.47 (0.24) 0.057 In n ov at io n ca pa b ili ty INN_PROD 0.30 (0.12) 0.013* INN_PROC 0.07 (0.16) 0.647 INN_TOT 0.25 (0.11) 0.028* N 938 938 LL -732.87 -734.12 AIC 1497.74 1498.24 BIC 1575.24 1570.90
Note: LL – Log Likelihood; * p < 0.05
We also demonstrate here that the adoption of new digital processes has a significant predictive effect on the business turnover in both models (Model I: β=0.45; p = 0.060; Model II: β=0.47; p = 0.057) and that companies engaging in the greatest innovation in their products/services (INN_PROD) (Model I: β=0.30; p < 0.05) and with higher numbers of total innovations (INN_TOT) (Model II: β=0.25; p < 0.05) interlink with those achieving higher levels of turnover. In terms of the characteristics of the company entrepreneur/manager, the greater the age (AGE) (Model I: β=-0.11; p < 0.01; Model II: β=0.08; p < 0.05) and experience (EXP) (Model II: β=-0.12; p < 0.01) brings about a significantly higher propensity to be in charge of companies registering lower turnovers while those run by female leadership (FEM) correlate with higher levels of business turnover (Model I: β=-0.67; p < 0.01; Model II: β=-0.67; p < 0.05). As advocated by various authors (Fernandes et al., 2013; Raposo et al., 2014; Ferreira et
innovative capabilities hold fundamental importance to explaining the performance and competitiveness of firms.
5. Final remarks and managerial implications
This study sought to establish a deeper understanding of the factors leading companies to adopt new digital processes and their implications for innovation capabilities and performances. The results obtained demonstrated that going digital constitutes an option that endows companies with greater competitiveness. Hence, and as regards the first research question posed (i.e. “What reasons may lead a company to choose new digital processes?”), we may observe how factors such as “maintain market share”, “raise market share”, and “raise the service quality” return a statistically positive influence on the adoption of new digital processes. We also verify here that both the location and the sector of activity wield influence over the adoption of new digital processes by companies. In turn, age (the more advanced in age) of the entrepreneur represents an obstacle to opting in favour of adopting new digital processes. University graduates and female entrepreneurs both display greater propensities to implement new digital processes. As concluded by some other studies (Cooke et al, 2004; OCDE, 2007), we may also affirm that the capability for innovation and the innovation strategy of companies depend on their respective region of location. Other empirical findings of this study convey how opting to adopt new digital processes also depends on the respective sector of activity, as already proposed by Frell (2006).
Following analysis of the factors influencing innovation activities, we may now move onto our second question (i.e. What are the implications for its innovation capability and business performance?). We found that companies with greater levels of innovation in their products/services and with a larger number of total innovations interlink with those reporting higher business turnover levels. As regards entrepreneur characteristics, being younger and female in gender boost the likelihood of attaining higher levels of turnover. Thus, we may also conclude that the innovative capability reflects in greater overall business competitiveness. In addition, factors related with the personality characteristics of the entrepreneur, thus factors of a non-economic nature (Lafuente et al., 2010; Fernandes et al., 2013) also explain the behaviours of companies
in terms of adopting digital processes as well as holding implications for the subsequent performances.
Taking into account how companies operate in environments of great uncertainty and complexity, the ability to adapt to the various contingencies arising is fundamental. The greater the capability for adaptation to the ongoing digital transformations, the greater the scope for innovation and furthermore identifying sustainable competitive advantages ahead of the competition. University-industrial cooperation may represent one means of companies seeking out and developing new forms of knowledge and possible solutions for technology transfers. Companies need to grasp that in order to be in the vanguard of knowledge, they have to seek out its sources of generation, thus in centres of learning. Another means of companies distinguishing themselves from the competition arises from innovation. Whenever boosting the capability for innovation through adopting digital processes, companies are contributing towards their own better performances and, consequently, to their greater market competitiveness.
Another implication extends to the public policy level. Governments should understand the complexity of the environments that businesses and firms now face. Only when attaining this awareness are they able to adopt the most appropriate policies tailored to the 21st century business reality, this era of digital transformation. Policies that foster entrepreneurship and digital innovation require consideration. Through this type of policy, fostering development and the usage of digital processes that stimulate private sector innovation, there may be the scope to boost overall business competitiveness.
In times when new measures and new policies represent an imperative, we believe that support for founding digitally and innovation based companies may well contribute to enhancing this competitiveness. We furthermore maintain that this research also contributes towards future studies opening up the scope for a deeper and more detailed future research agenda on the implications of digital transformations on the innovative capabilities of companies, an area that has hitherto received so little attention.
References
Acs, Z., Braunerhjelm, P., Audretsch, D., & Carlson, B (2009). The knowledge spillover theory of entrepreneurship. Small Business Economics, 32(1), 15-30. Ashton, K. (2009) That ‘Internet of Things’ Thing, in the real world things matter more
than ideas. RFID Journal (22June 2009)
Autant-Bernard, C., Mangematin, V., & Massard, N. (2006). Creation of biotech SMEs in France. Small Business Economics, 26(2), 173-187.
Barnes, S. J. (2002). The mobile commerce value chain: Analysis and future developments. International Journal of Information Management, 22, 91-108. Barrett, M., Davidson, E., Prabhu, J. , & Vargo, S. (2015). Service Innovation in the
Digital Age: Key Contributions and Future Directions, MIS Quarterly 39(1), 135-154.
Benner, M., & Tushman, M. (2015). Reflections on the 2013 Decade Award: ‘Exploitation, Exploration, and Process Management: The Productivity Dilemma Revisited’ Ten Years Later, Academy of Management Review, 40(4), 497-514. Berger, E., & Kuckertz, A. (2016). Female entrepreneurship in startup ecosystems
worldwide. Journal of Business Research, 69(11), 5163-5168.
Boudreau, K., & Lakhani, K. (2013). Using the Crowd as an Innovation Partner,
Harvard Business Review, 91(4), 60-69.
Brettel, M., Friederichsen, N., Keller, M., & Rosenberg, M. (2014). How Virtualization, Decentralization and Network Building Change the Manufacturing Landscape : An Industry 4.0 Perspective. International Journal of Mechanical, Aerospace,
Industrial and Mechatronics Engineering, 8(1), 37-44.
Davidsson, P., Delmar, F. , & Wiklund, J. (eds.), (2001) Tillva¨xtfo¨retagen i Sverige. SNS Fo¨ rlag: Stockholm.
Davis, M., Field, J., & Stavrulaki, E. (2015). Using digital service inventories to create customer value. Service Science, 7(2), 983-999.
Cameron, A., & Trivedi, P. (2005). Microeconometrics: Methods and Applications. New York: Cambridge University Press.
Canhoto, A., Quinton, S., Jackson, P., & Dibb, S. (2016). The co-production of value in digital, university-industry R & D collaborative projects. Industrial Marketing
Cooke, P., Heidenreich, M., & Braczyk, H. (2004). Regional Systems of Innovation. London: Routledge.
Dy, A., Marlow, S., & Martin, L. (2017). A web of opportunity or the same old story? Women digital entrepreneurs and intersectionality theory. Human Relations,
70(3), 286-311.
European Commision (2009). Internet of Things: An action plan for Europe. Available online at http://ec.europa.eu/digitalagenda/
Ferreira, J., & Fernandes, C. (2017). Resources and capabilities’ effects on firm performance: What are they? Journal of Knowledge Management, 21(5), 1202-1217.
Fernandes, C., Ferreira, J., Raposo, M. (2013). Drivers to firm innovation and their effects on performance: An international comparison, International
Entrepreneurship and Management Journal, 9, 557-580.
Ferreira, J., Fernandes, C., Alves, H., Raposo, M. (2015). Drivers of innovation strategies: Testing the Tidd and Bessant (2009) model, Journal of Business
Research, 68(7), 1395-1403
Freel, M. (2006). Patterns of Technological Innovation in Knowledge-Intenive Business Services. Industry and Innovation, 13(3), 335-358.
Goldfarb, A., & Tucker, C. (2012). Privacy and Innovation, in Lerner, J., & Stern, S. (Eds.), Innovation Policy and the Economy, Chicago: University of Chicago Press, 65-89.
Gölzer, P., & Fritzsche, A. (2017). Data-driven operations management: Organisational implications of the digital transformation in industrial practice, Production
Planning & Control, 28(16), 1332-1343
Greenstein, S., Lerner, J., & Stern, S. (2013). Digitization, innovation, and copyright: What is the agenda?, Strategic Organization, 11(1), 110-121.
Groot, H., Nijkamp, P., & Stough, R. (2004). Entrepreneurship and Regional Economic
Development: A Spatial Perspective. Massachusetts: Edward Elgar Publishing
Limited.
Hair, J., Black, B., Babin, B., Anderson, R., & Tatham, R. (2010). Multivariate Data
Analysis. London, United Kingdom: Pearson Prentice Hall.
Harryson, S. (2008). Entrepreneurship through relationships: Navigating from creativity to commercialisation. R&D Management, 38(3), 290-310.
Heirman, A., & Clarysse, B. (2007). Which tangible and intangible assets matter for innovation speed in start-ups? Journal of Product Innovation Management, 24(4), 303-315.
Hill, J. (2001). A multidimensional study of the key determinants of effective SME marketing activity. International Journal of Entrepreneurial Behaviour &
Research, 7(5), 171-204.
Holt, D. (1992). Entrepreneurship: New Venture Creation. New Jersey: Prentice Hall. Hui, G. (2014). How the internet of things changes business models, Harvard Business
Review. Available at
https://hbr.org/2014/07/how-the-internet-of-things-changes-business-models
Iansiti, M., & Lakhani, K. (2014). Digital ubiquity: How connections, sensors, and data are revolutionizing business, Harvard Business Review, 92(11), 91-99.
Kuester, S., Konya-baumbach, E., & Schuhmacher, M. (2018). Get the show on the road: Go-to-market strategies for e-innovations of start-ups. Journal of Business
research, 83(1), 65-81.
Lafuente, E., Vaillant, Y., & Serarols, C. (2010). Location decisions of knowledge-based entrepreneurs: Why some Catalan KISAs choose to be rural?.
Technovation, 30, 590-600.
Lyytinen, K., Yoo, Y., & Boland, R. (2016). Digital product innovation within four classes of innovation networks. Information Systems Journal, 26(1), 47-75.
Nambisan, S. (2016). Digital entrepreneurship: Towards a digital technology perspective of entrepreneurship. Entrepreneurship Theory and Practice. Doi: 10.1111/etap.12254.
Nambisan, S., Lyytinen, K., Majchrzak, A., & Song, M. (2017). Digital innovation management: Reinventing innovation management research in a digital world.
MIS Quarterly, 41(1), 223-238.
OECD (2007). Globalisation and structural adjustment: Summary report of the study on globalisation and innovation in the business services sector, available at http://www.oecd.org/dataoecd/18/55/38619867.pdf.
OECD (2016). Stimulating digital innovation for growth and inclusiveness: The role of policies for the successful diffusion of ICT, OECD Digital Economy Papers, No. 256, OECD Publishing, Paris.
Pagani, M., & Pardo, C. (2018). The impact of digital technology on relationships in a business network. Industrial Marketing Management (article in press).
Porter, M., & Heppelmann, J. (2014). How smart, connected products are transforming competition. Harvard Business Review, 92(11), 64-88.
Porter, M., & Heppelmann, J. (2015). How smart, connected products are transforming companies. Harvard Business Review, 93(10), 96-114.
Porter, M., & Kramer, M. (2011). Creating shared value. Harvard Business Review, 89, 62-77.
Pigneur, Y. (2000). An ontology for m-business models. Working paper. Lausanne, Switzerland: Ecolé des HEC, University of Lausanne.
Richard, P., & Devinney, T. (2005). Modular strategies: B2B technology and architectural knowledge. California Management Review, 47(4), 86-113.
Raposo, M., Ferreira, J., & Fernandes, C. (2014). Local and Cross-border SME Cooperation: Effects on Innovation and Performance, Revista Europea de
Dirección y Economia de la Empresa, 23(4), 157-165.
Sabat, H. (2002). The evolving mobile wireless value chain and market structure.
Telecommunications Policy, 26, 505-535.
Schumpeter, J. (1934). The Theory of Economic Development. Cambridge, MA: Harvard University Press.
Tether, B., & Tajar, A. (2008). The organisational-cooperation mode of innovation and its prominence amongst European service firms. Research Policy, 37(4), 720-739. Tilson, D., Lyytinen, K., & Sørensen, C. (2010). Digital infrastructures: The missing IS
research agenda. Information Systems Research, 21(4), 748-759.
Yadav, M., & Pavlou, P. (2014). Marketing in computer-mediated environments: Research synthesis and new directions. Journal of Marketing, 78(1), 20-40.
Yoo, Y., Boland Jr., R., Lyytinen, K., & Majchrzak, A. (2012). Organizing for innovation in the digitized world. Organization Science, 23(5), 398-1408.
Yoo, Y., Henfridsson, O., & Lyytinen, K. (2010). The new organizing logic of digital innovation: An agenda for information systems research. Information Systems