Nitrogen single-breath washout test for evaluating
exercise tolerance and quality of life in patients with
chronic obstructive pulmonary disease
C.A.L. Deus
1, P.S. Vigário
1, F.S. Guimarães
1and A.J. Lopes
1,2 1Programa de Pós-Graduac¸ão em Ciências da Reabilitac¸ão, Centro Universitário Augusto Motta, Rio de Janeiro, RJ, Brasil 2
Programa de Pós-Graduac¸ão em Ciências Médicas, Faculdade de Ciências Médicas, Universidade do Estado do Rio de Janeiro, Rio de Janeiro, RJ, Brasil
Abstract
Pulmonary function tests (PFTs) traditionally used in clinical practice do not accurately predict exercise intolerance in patients with chronic obstructive pulmonary disease (COPD). The aim of this study was to assess whether the nitrogen single-breath washout (N2SBW) test explains exercise intolerance and poor quality of life in stable COPD patients. This cross-sectional study
included 31 patients with COPD subjected to PFTs (including the N2SBW test) and a cardiopulmonary exercise test (CPET).
Patients were also evaluated using the following questionnaires: the COPD assessment test (CAT), the 36-Item Short Form Health Survey (SF36) and St. George’s Respiratory Questionnaire (SGRQ). Peak oxygen uptake (peak VO2) was negatively
correlated with the phase III slope of the N2SBW (SIIIN2) (r=–0.681, Po0.0001) and positively correlated with forced expiratory
volume in one second (FEV1; r=0.441, P=0.013). Breathing reserve was negatively correlated with SIIIN2, closing volume/vital
capacity, and residual volume (RV) (r=–0.799, Po0.0001; r=–0.471, P=0.007; r=–0.401, P=0.025, respectively) and positively
correlated with FEV1, forced vital capacity (FVC) and FEV1/FVC (r=0.721; Po0.0001; r=0.592, P=0.0004; r=0.670, Po0.0001,
respectively). SIIIN2and CAT were independently predictive of VO2and breathing reserve at peak exercise. RV, FVC, and FEV1
were independently predictive of the SF36-physical component summary, SF36–mental component summary, and breathing
reserve, respectively. The SGRQ did not present any independent variables that could explain the model. In stable COPD patients, inhomogeneity of ventilation explains a large degree of exercise intolerance assessed by CPETs and, to a lesser extent, poor quality of life.
Key words: Chronic obstructive pulmonary disease; Ventilatory efficiency; Pulmonary function tests; Cardiopulmonary exercise testing; Quality of life
Introduction
Chronic obstructive pulmonary disease (COPD) is a major public health problem worldwide that affects health-related quality of life (HRQoL) of individuals and causes disability and high morbidity and mortality (1). The HRQoL of patients with COPD is impaired by the symptoms and systemic manifestations of the disease, which worsen with disease chronicity and lead to morbidity (2). Moreover, functional disability strongly affects HRQoL of patients with COPD. However, few studies have evaluated the association among the degree of physical activity limita-tion, the performance of activities of daily living (ADLs), lung function and performance during exercise (3).
Pulmonary function tests (PFTs) are valuable tools for the diagnosis and assessment of the severity of COPD and have many clinical applications, such as evaluating prognosis and response to therapy (1). Spirometry is the
most commonly used functional test in the evaluation and management of these patients, despite the limitation that forced expiratory volume in one second (FEV1) is a
marker of airflow obstruction in the proximal airways, whereas airflow obstruction in COPD occurs primarily in the distal airways (4,5). In recent decades, there have been significant technological advances in tools used to measure lung function. Despite the technological sophis-tication of traditional functional assessment methods, new PFTs are gradually being incorporated into clinical practice (6). There has been growing interest in the use of the single-breath washout (N2SBW) test because it is
a simple, non-invasive tool and can detect heterogeneity in the ventilation distribution and small airway disease in cases in which traditional PFTs indicate normal values (7). Increased values of the phase III slope of N2SBW (SIIIN2)
Correspondence: A.J. Lopes:<[email protected]>
Received August 15, 2017 | Accepted December 7, 2017
and closing volume/vital capacity (CV/VC) indicate hetero-geneity in the ventilation distribution and small airway disease, respectively (7). Two recent studies that used the walking test found that the increase in SIIIN2 was
cor-related with worsening dyspnea and reduction of the 6-min walking distance in patients with COPD (8,9).
The cardiopulmonary exercise test (CPET) can detect abnormalities in the functional capacity of the respiratory and cardiovascular systems earlier than other tests (10). In patients with COPD, a reduced peak oxygen uptake (peak VO2) and a low breathing reserve have been
identi-fied as the main contributors that limit exercise (11–13). Difficulty breathing and exercise intolerance have been associated with excessive ventilatory responses to exer-cise in these patients, even among those with a relatively well-preserved FEV1 (11,12). In fact, the PFTs traditionally used in clinical practice do not accurately predict exercise intolerance, and CPET has been proposed as the gold standard method to evaluate exercise intolerance in patients with COPD (5,13).
As the outcomes of traditional PFTs do not correlate well with CPET parameters, it is important to investigate other pulmonary function methods that are better asso-ciated with exercise intolerance in patients with COPD. Considering that ventilatory limitation aggravated by exer-cise is a major contributor to the reduced functional capacity in COPD patients, we hypothesized that heterogeneity in the ventilation distribution and small airway disease may contribute to better understand exercise intolerance in these patients (10). Thus, the objective of this study was to assess whether parameters of the N2SBW test explain exercise
intolerance in stable COPD patients. Secondly, we sought to evaluate whether parameters of the N2SBW test explain
poor quality of life of these patients.
Patients and Methods
Patients
Between April 2015 and January 2017, we conducted a cross-sectional study involving 38 consecutive patients with COPD recruited at the Policlínica Newton Bethlem, Rio de Janeiro, Brazil. The exclusion criteria were age less than 40 years, smoking load of fewer than 10 pack-years, previous pleuropulmonary disease not related to COPD, use of supplemental oxygen therapy, previous thoracic surgery, respiratory exacerbations or infections in the past 4 weeks and any comorbid condition that might reduce exercise capacity. The project was approved by the Research Ethics Committee of the Centro Universi-tário Augusto Motta under CAAE No. 52885116.6.0000. 5235 and complied with the Declaration of Helsinki. All subjects signed a consent form.
Procedures
Modified Medical Research Council (m-MRC) scale. The m-MRC scale is a subjective tool that assesses
limitations in ADLs and has been validated for use in Portuguese language (14). The m-MRC is a 5-item scale with the following categories: 0 (experiencing shortness of breath only with strenuous exercise); 1 (experiencing shortness of breath when hurrying on level ground or ascending a gentle slope); 2 (walking slower than other people their age due to shortness of breath or having to stop for breath when walking slowly); 3 (stopping for breath after walking less than 100 m or after a few minutes); and 4 (experiencing so much shortness of breath that prevents leaving the home or experiencing shortness of breath when dressing). The m-MRC scale is easy to use: the patient simply selects the item that corresponds to the degree to which dyspnea limits his or her ADLs (1,14).
COPD assessment test (CAT) questionnaire. The CAT is a specific questionnaire used to measure the HRQoL of patients with COPD. This one-dimensional measure contains 8 items related to the impairment of health status. At the end of the test, the scores of all the responses are summed, and the clinical impact of COPD is evaluated according to the stratification of CAT scores. The total score ranges from 0 to 40, and higher scores indicate poorer health status (15).
ABCD assessment tool. Based on the m-MRC scale, CAT questionnaire, and exacerbation history (0 or 1 not leading to hospital admissionvsX2 not leading to hospital admission or X1 leading to hospital admission), patients were classified as follows: A (m-MRC 0–1, CATo10, and exacerbation history of 0 or 1 not leading to hospital admission); B (m-MRC X2, CAT X10, and exacerba-tion history of 0 or 1 not leading to hospital admission); C (m-MRC 0–1, CATo10, andX2 exacerbation histories not leading to hospital admission orX1 exacerbation history leading to hospital admission), and D (m-MRC X2, CAT X10 andX2 exacerbation histories not leading to hospital admission or X1 exacerbation history leading to hospital admission) (1).
Thirty-six-item short form health survey (SF36). The SF36 is a generic self-applied questionnaire consisting of 36 questions divided into eight areas, which in turn can be grouped into 2 broad categories: a physical component summary (PCS) and a mental component summary (MCS). The scores range from 0 to 100, with higher scores indi-cating better HRQoL (16).
St. George’s respiratory questionnaire (SGRQ). The SGRQ is a validated, well-known self-administered tool that measures symptoms, ADLs, and HRQoL of patients with chronic respiratory diseases, particularly COPD. It consists of 50 items divided into 3 domains: symptoms (8 items), activity (16 items) and impact (26 items). Each item has a derived weight, and lower values indicate better HRQoL (17).
do Estado do Rio de Janeiro, Brazil, following the stan-dardization of the American Thoracic Society (18). The reference values used were the Brazilian values, and the results are as percentages of the predicted values (19,20). The severity of airflow limitation was classified based on FEV1 values after salbutamol use as follows: GOLD 1
(mild, FEV1X80% predicted); GOLD 2 (moderate, 50%p
FEV1o80% predicted); GOLD 3 (severe, 30% p FEV1 o50% predicted), and GOLD 4 (very severe, FEV1o30%
predicted) (1).
In addition, the patients underwent N2SBW test with
a 3000 HDpft (nSpire Health, Inc., USA) according to the recommendations of the American Thoracic Society/ European Respiratory Society (7). Briefly, individuals exhaled until reaching the residual volume (RV) and then inhaled 100% O2 until reaching total lung capacity (TLC). Then,
patients exhaled slowly at aflow rate of approximately 0.3– 0.5 L/s until reaching the RV. The concentration of exhaled N2was recorded by a device located at the airway opening.
Two indices derived from this procedure were reported as a percentage of the predicted values: SIIIN2, which is
the change in N2concentration between 25 and 75% of
the expiratory volume, and the CV/VC ratio, which is the percentage of the VC that is exhaled after the beginning of airway closure (21).
Cardiopulmonary exercise test (CPET). The patients performed the CPET on a treadmill (Inbramed, ATL, Brazil) coupled with a metabolic analyzer (MedGraphics VO2000, Medical Graphics, Inc., USA) in the Laboratório de Movi-mento Humano at the Centro Universitário Augusto Motta according to previous recommendations (22). We used the ramp protocol, in which the slope and load were individua-lized by adapting to the capacity of each individual using an optimal period of exercise intensity estimated between 8 and 12 min. Oxygen saturation, heart reserve (HR), 12-lead electrocardiogram tracings, and blood pressure were moni-tored continuously and measured every 2 min throughout the exercise period. Oxygen uptake (VO2), carbon dioxide
output (VCO2), minute ventilation (VE) and related variables
were calculated breath-by-breath (10). Breathing reserve was calculated as the difference between the maximum voluntary ventilation (MVV) at rest and the peak minute ventilation (VE) and was reported as a percentage of MVV [1– (VE/MVV) x 100] (23). Heart rate reserve (HRR) was calculated as the difference between the heart rates ob-tained at rest and during peak exercise [(220–age)–peak HR] (10). The equations for the predicted Brazilian values were used to interpret the results (24).
Statistical analysis
The Shapiro-Wilk test was used to verify the normality of variables. Results are reported as means±SD or frequencies (percentages). The associations between the variables peak VO2, breathing reserve, CAT, SF36 PCS,
SF 36 MCS, and SGRQ with demographic, clinical and resting lung function variables were analyzed using
Pearson correlation coefficients. Due to the small number of patients for each item on the m-MRC scale, the patients were categorized into 2 groups according to the m-MRC scale (o2 or X2); this cut-off separates ‘low breath-lessness’ from ‘high breathlessness’ (1). The associa-tions between the m-MRC scale (dichotomous outcome) and demographic, clinical and pulmonary function vari-ables were determined using Student’st-test for indepen-dent samples, the Mann-Whitney test for non-Gaussian data and the chi-squared test for categorical data.
Forward stepwise regression analysis was used to identify the resting lung function parameters (spirometry, body plethysmography and N2SBW test) and possible
confounders (demographic and clinical data) that were independently related to performance during the CPET (peak VO2 and breathing reserve) and HRQoL (CAT,
SF36 PCS, SF 36 MCS, and SGRQ). The data that were tested as independent variables in the forward stepwise regression analysis were as follows: forced vital capacity (FVC), FEV1, FEV1/FVC, forced expiratoryflow during the
middle half of the FVC (FEF25-75%), TLC, RV, RV/TLC,
SIIIN2, and CV/VC. These models were adjusted for relevant
confounders (sex, age, body mass index, smoking history, GOLD stages, and degree of dyspnea).
In addition, the forward stepwise regression analysis was used to identify the variables provided by spirometry and body plethysmography that were independently related to parameters of the N2SBW test after considering
confounding factors (including demographic and clinical data). The overall performance measures of the regression models was evaluated using the coefficient of determina-tion (R2), adjusted for the number of variables retained in
the proposed model (cumulative R2).
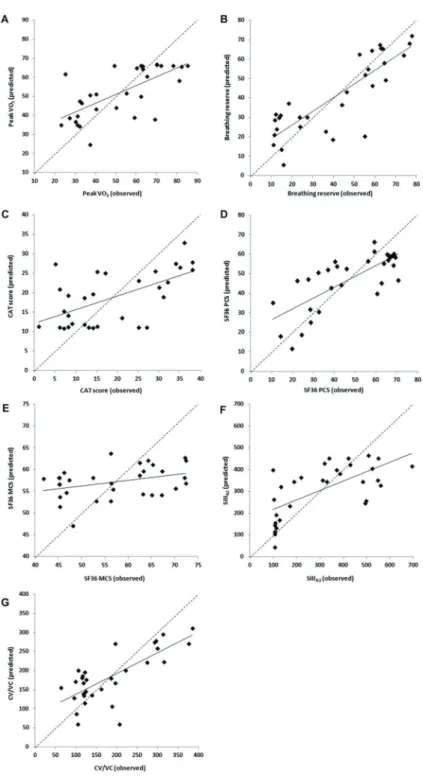
Calibration was verified using the calibration plot (observed vs predicted outcomes, along with regression lines showing the slope and intercept) and the limits of agreement (LoA) plot for each of the proposed models (25). Data were analyzed using SAS software version 6.11 (SAS Institute, Inc., USA). Differences were considered significant for P values less than 0.05.
Results
Among the 38 patients evaluated for inclusion in this study, 7 were excluded for the following reasons: respiratory exacerbations in the month before recruitment (n=3), history of pleuropulmonary disease not associated with COPD (n=3), and use of home oxygen therapy (n=1). The average age was 67.5±9.9 years, and the average smoking load was 50.9±26.2 pack-years. All but 4 patients were treated with inhaled bronchodilators and/or inhaled corticosteroids. The demographic and clinical data, resting lung function parameters, and CPET data are shown in Table 1.
SIIIN2(r=–0.681, Po0.0001) and positively correlated with FEV1 and FEF25-75% (r=0.441, P=0.013, and r=0.393,
P=0.029, respectively). Breathing reserve was negatively correlated with SIIIN2, CV/VC, RV and RV/TLC (r=–0.799, Po0.0001; r=–0.471, P=0.007; r=–0.401, P=0.025, and r=–0.608, P=0.0003, respectively) and positively corre-lated with FEV1, FVC, FEV1/FVC and FEF25-75%(r=0.721,
Po0.0001; r=0.592, P=0.0004; r=0.670, Po0.0001, and r=0.635, P=0.0001, respectively). We further assessed the correlations between parameters of the N2SBW test
with resting lung function variables and possible con-founders. SIIIN2 was negatively correlated with FEV1,
FVC, FEV1/FVC and FEF25-75% (r=–0.659, P=0.0001; r=
–0.554, P=0.001; r=–0.596, P=0.0004, and r=–0.578, P= 0.0007, respectively) and positively correlated with RV and RV/TLC (r=0.411, Po0.022 and r=0.548, P=0.001,
respectively). CV/VC was negatively correlated with FEV1,
FVC, FEV1/FVC and FEF25-75% (r=–0.583, P=0.0006; r=
–0.702, Po0.0001; r=–0.471, P=0.007, and r=–0.535, P=0.002, respectively) and positively correlated with age, TLC, RV and RV/TLC (r=0.464, P=0.009; r=0.648, P=0.0001; r=0.725, Po0.0001, and r=0.737, Po0.0001, respectively). Changes in the demographic, clinical, lung function and CPET variables according to the m-MRC scale (class o2 vs class X2) were also evaluated; the results of this analysis indicated no significant difference in the variables between the patients divided into the 2 classes of the m-MRC scale.
We investigated whether the resting lung function variables (spirometry, body plethysmography and N2SBW
test) could independently predict performance during the CPET and the HRQoL in these patients. The results of the forward stepwise regression analysis for the prediction of the CPET and HRQoL variables are shown in Table 3. SIIIN2 was an independent predictor of the CAT score,
peak VO2and breathing reserve. RV, FVC and FEV1were
independent predictors of SF36 PCS, SF 36 MCS and breathing reserve, respectively. The SGRQ could not be predicted by any independent variables in the models. We further assessed whether the resting lung function variables would demonstrate an independent role in pre-dicting the parameters of the N2SBW test. FEV1and RV/
TLC were the only independent predictors for SIIIN2and
CV/VC, respectively (Table 3). In addition, demographic and clinical variables (including GOLD stages) were not retained in any of the proposed multiple regression models (P40.05).
Calibration
Regarding the models for peak VO2, breathing reserve,
CAT, SIIIN2 and CV/VC, the following findings were
observed: there were no obvious relationship between the differences and the means given by the lines (Figure 2); most of the differences occurred within the LoA with a random distribution over the mean (Figure 3), and the histograms of the residues showed an approximately Table 1. Demographic and clinical data, resting lung function
parameters, and cardiopulmonary exercise test data of the patients studied.
Variable Data
Demographic characteristics
Gender (male) 15 (48.4)
Age (years) 67.5±9.9
BMI (kg/m2) 22.7±4.8
GOLD stages
1–2 18 (58.1)
3–4 13 (41.9)
A–B 17 (54.8)
C–D 14 (45.2)
Clinical data m-MRC scale
o2 19 (61.3)
X2 12 (38.7)
CAT score 18.6±11.5
SF36 PCS 46.8±19.1
SF36 MCS 57.1±10.2
SGRQ 45.1±20.6
Resting lung function Spirometry
FVC (% predicted) 82.9±19.3
FEV1(% predicted) 56.7±20.6
FEV1/FVC (%) 52.5±12
FEF25-75%(% predicted) 24.3±15.5
Body plethysmography
TLC (% predicted) 120.2±28.7
RV (% predicted) 172.4±77.4
RV/TLC (%) 55.6±13.2
Nitrogen single-breath washout test
SIIIN2 307.3±184.8
CV/VC 183.0±91.0
Cardiopulmonary exercise test
Peak VO2(% predicted) 52.0±19.2
RER max 1.25±0.23
O2pulse max (% predicted) 64.7±20.4
HRR (beats/min) 35±17.5
Breathing reserve (%) 40.6±23.2
normal distribution and absence of evident asymmetry. On the contrary, the models for SF36 PCS and SF36 MCS did not present satisfactory calibrations.
Power analysis
To provide a context for interpreting the nullfindings, a post hocpower calculation was done based on the actual sample size (n=31) and the observed correlation for the main outcome (peak VO2) and SIIIN2 (r=–0.681). For an alpha of 0.05, the power was 99.3%, showing the adequacy of the studied sample size to get significant results.
Discussion
The mainfinding of this study was that, in patients with COPD, a greater inhomogeneity in ventilation corresponded
to a lower oxygen consumption and breathing reserve at peak exercise. The inhomogeneity of ventilation was also positively associated with poor HRQoL of these patients. Compared with the heterogeneity in ventilation, the changes in small airways measured by the N2SBW test
were associated to a lesser extent with the CPET parameters and HRQoL. In addition, other lung function variables measured by spirometry and body plethysmog-raphy were associated with performance during exercise and HRQoL of patients with COPD. To our knowledge, this study is thefirst to demonstrate that the parameters of the N2SBW test partially explain the exercise intolerance and
poor quality of life in stable COPD patients.
Although physical limitations to exercise are undoubt-edly multifactorial, ventilatory factors are often the main limitation for poor performance during exercise in patients Table 2.Pearson’s correlation coefficients for demographic, clinical, resting pulmonary function and cardiopulmonary exercise test variables.
Variables Age BMI Cigarette* FVC FEV1 FEV1/FVC FEF25–75% TLC RV RV/TLC SIIIN2 CV/VC
CAT
r –0.102 –0.203 –0.038 –0.412 –0.331 –0.253 –0.189 0.323 0.410 0.489 0.591 0.267
P value 0.58 0.27 0.84 0.021 0.069 0.17 0.31 0.076 0.022 0.005 0.0005 0.15
SF36 PCS
r 0.017 0.286 –0.138 0.482 0.533 0.455 0.478 –0.664 –0.730 –0.664 –0.475 –0.505 P value 0.93 0.12 0.46 0.006 0.002 0.010 0.006 o0.0001 o0.0001 o0.0001 0.007 0.004 SF36 MCS
r 0.074 0.090 –0.065 0.359 0.351 0.253 0.354 0.012 –0.083 –0.171 –0.218 –0.235
P value 0.69 0.63 0.73 0.047 0.05 0.17 0.051 0.95 0.66 0.36 0.24 0.20
SGRQ
r –0.175 –0.191 0.126 –0.320 –0.335 –0.261 –0.308 0.193 0.311 0.188 0.122 0.156
P value 0.35 0.30 0.50 0.079 0.065 0.16 0.092 0.30 0.089 0.31 0.51 0.40
Peak VO2
r –0.021 0.076 –0.151 0.272 0.441 0.317 0.393 –0.005 –0.126 –0.175 –0.681 –0.025
P value 0.91 0.68 0.42 0.14 0.013 0.082 0.029 0.98 0.50 0.35 o0.0001 0.90
Breathing reserve
r –0.352 0.284 –0.119 0.592 0.721 0.670 0.635 –0.235 –0.401 –0.608 –0.799 –0.471 P value 0.052 0.12 0.52 0.0004 o0.0001 o0.0001 0.0001 0.20 0.025 0.0003 o0.0001 0.007 CAT: COPD assessment test; SF36 PCS: 36-Item Short Form Health Survey-physical component summary; SF36 MCS: 36-Item Short Form Health Survey-mental component summary; SGRQ: St. George’s Respiratory Questionnaire; peak VO2: peak oxygen uptake; BMI: body mass index; FVC: forced vital capacity; FEV1: forced expiratory volume in 1 s; FEF25-75%: forced expiratoryflow during the middle half of the FVC; TLC: total lung capacity; RV: residual volume; SIIIN2: phase III slope of nitrogen single-breath washout; CV/VC: closing volume/vital capacity. *Pack-years.
with COPD (13). The increased ventilatory demand in these patients is primarily caused by inefficient ventilation. In the present study, we observed that SIIIN2(but not the
CV/VC ratio) was the only independent predictor of peak VO2. Interestingly, Jones et al. (26) evaluated 19 patients
with COPD with mild to moderate airflow obstruction and found that those with low peak VO2 had a higher
ventilatory inefficiency (higher ventilation/carbon dioxide output nadir) during the CPET. Therefore, we believe that increased SIIIN2at rest indirectly indicates the ventilatory
inefficiency detected during symptom-limited maximal exercise. Of note, our models were adjusted for relevant confounders (including the anthropometric data, demo-graphic variables and GOLD stages). Furthermore, we used the predicted values for the lung function parameters, which adjust the absolute values for gender, age, weight and height (18,25).
In our study, the strongest correlation was observed between SIIIN2and breathing reserve measured at peak
exercise (r=–0.799, Po0.0001). Breathing reserve depends on several factors that are responsible for ventilatory demand, including metabolic demand, body mass, dead space ventilation and neuroregulatory mechanisms (10). A low breathing reserve suggests that the individual’s exercise capacity may be limited by ventilatory capacity. Jones et al. (26) evaluated patients with mild to moderate COPD and observed that the ventilation "wasted" in emphysematous areas (but not small airway disease) was associated with a decrease in ventilatory efficiency in the CPET. This result explains, at least in part, thefinding that the increase in SIIIN2 is strongly correlated with the
depletion of ventilatory reserve observed in our study and that SIIIN2is independent of the peak VO2and the degree
of airflow obstruction. In fact, there is mounting evidence that COPD patients with relatively well-preserved FEV1
may exhibit substantial emphysema in computed tomog-raphy (CT) and that these abnormalities are associated with significant patient-centered outcomes, including short-ness of breath and exercise intolerance (27,28). Emphy-sema increases air spaces, decreases alveolar attachments to the small airways and impairs microvascular perfu-sion, which together cause a significant maldistribution of ventilation (26,29).
In contrast to the variations in SIIIN2, our results indicate
that changes in the CV/VC may not be a major contributor to CPET measurements in patients with COPD because CV/VC was not retained in any of the regression models that were developed. In the N2SBW test, an increased CV/
VC reflects air trapping because of small airway closure, and therefore, it can potentially provide information about early abnormalities in the small airways in COPD (30). Although small airways may negatively affect the total airway resistance and restrict the distribution of ventilation to some extent, the changes in lung mechanics from small airway abnormalities in many of these patients are mild (31). Although COPD is primarily a lung disease, it also causes significant systemic effects that can lead to a decline in health status and HRQoL (32). A recent meta-analysis indicated that CAT could be used as a comple-mentary tool in the clinical assessment of patients to predict exacerbations of COPD, deterioration in health status, depression, and mortality (33). Only 3 studies involving Table 3.Independent linear models for variables of cardiopulmonary exercise test, quality of life and single-breath washout test using resting pulmonary function variables.
Outcome variable Independent variable+ B SEB P value Cumulative R2
Cardiopulmonary exercise test*
Peak VO2 SIIIN2 –0.071 0.014 o0.0001 0.46
Breathing reserve SIIIN2 –0.072 0.017 0.0002 0.71
FEV1 0.387 0.153 0.017
Quality of life*
CAT SIIIN2 0.037 0.009 0.0004 0.35
SF36 PCS RV –0.180 0.031 o0.0001 0.53
SF36 MCS FVC 0.191 0.092 0.047 0.13
Single-breath washout test#
SIIIN2 FEV1 –5.911 1.253 0.0001 0.43
CV/VC RV/TLC 5.100 0.868 o0.0001 0.54
444 patients had described regression models that pre-dicted the CAT score using clinical, spirometry and body plethysmography variables and did so with R2 values that explained less than 50% of the variance (34–36). Considering that the heterogeneity of ventilation was not evaluated in any of these studies, we believe that this parameter is important because in our study SIIIN2
alone explained 35% of the variability of the CAT scores.
The clinical variables and traditional PFTs were not retained in the regression models in our study, likely because of the strong association between CAT and SIIIN2. In contrast to
CAT, we were unable to build a regression model for the m-MRC scale. This result was expected because the CAT is a multidimensional scale that includes seven other items, not only shortness of breath, whereas the m-MRC scale is one-dimensional and assesses only dyspnea (33).
In this study, the SF36 PCS was associated with various physiological parameters at rest. However, the strongest correlation was observed between the increase in RV and the decrease in SF36 PCS, and RV was the only physiological parameter that was included in the SF36 PCS regression model. Air trapping caused by the combined effect of peripheral airway disease and increased ventila-tory demand imposes critical mechanical restrictions and worsens dyspnea, which, in turn, leads to the decline of
HRQoL of patients with COPD (13). Interestingly, after evaluating patients with heterogeneous emphysema who underwent lung volume reduction surgery, Oey et. (37) observed a significant reduction in air trapping that was proportional to the improvement in the HRQoL measured by the SF-36 PCS.
and clinical and functional variables at rest. Regarding exercise, Mirdamadi et al. (38) evaluated 37 patients with COPD (GOLD I-III) and found no significant correlation between peak VO2and the SGRQ score. Similarly, other
researchers reported that peak VO2is a poor indicator of
health status (3,39), suggesting that CPET parameters at peak exercise may not be effective for evaluating the ADLs of patients. Although specific for COPD, the SGRQ is an extensive test that is often stressful to the patient, and it measures health status using several parameters, which might, at least in part, be responsible for the lack of correlation with clinical and physiological data (30).
Our study is characterized by the following limitations. First, this study included a small number of subjects from a single center and employed a cross-sectional design; therefore, the temporal effect on the stability of the response of each evaluated tool is unknown. Due to the multiple statistical tests performed, some of thefindings may be a result of chance. Therefore, there is the possibility of type I error, i.e., accepting an alternative hypothesis when the results can be attributed to chance (40). Second, chest CT could help elucidate the maldistribution of ventilation, as there is growing evidence that emphysema is associated with low exercise tolerance in COPD, even in patients with mild to moderate airflow obstruction (26). Third, we did not assess importantfindings of COPD patients in the regression models studied, including socioeconomic status, comorbidities, and pharmacologic therapy, which could have allowed us to obtain more robust models. Finally, the
lung function variables are reported in relation to the predicted values, and thus, these variables were correct-ed for the anthropometric and demographic data; this at least partially explains why the anthropometric and demo-graphic data were not retained in the proposed models. Despite these limitations, our study provides valuable information for N2SBW test assessments in randomized
controlled trials. In this context, the N2SBW test may
con-tribute to the categorization of patients and the evaluation of responses to various clinical and surgical therapies for COPD.
In conclusion, there was a relationship between N2SBW test measurements and CPET parameters in
stable COPD patients. In these patients, inhomogeneity of ventilation explains much of the exercise intolerance assessed by the CPET and, to a lesser extent, the poor HRQoL. Compared with the N2SBW test, the variables
measured by spirometry and body plethysmography more strongly influenced the HRQoL and, to a lesser degree, oxygen consumption in patients with COPD. The con-tribution of the N2SBW test to COPD studies should be
further explored, as this test has the potential to be used as a complementary tool in clinical practice to assess these patients.
Acknowledgments
We are grateful to CNPq (#304625/2016-7) and FAPERJ (#E-26/010.001564/2016) forfinancial support.
References
1. GOLD (Global Initiative for Chronic Obstructive Lung Disease). Global strategy for the diagnosis, management and prevention of COPD. 2017. Available at: http://www. goldcopd.org.
2. Wacker ME, Jörres RA, Karch A, Wilke S, Heinrich J, Karrasch S, et al. Assessing health-related quality of life in COPD: comparing generic and disease-specific instruments with focus on comorbidities.BMC Pulm Med2016; 16: 70, doi: 10.1186/s12890-016-0238-9.
3. Chuang ML, Lin IF, Lee CY. Clinical assessment tests in evaluating patients with chronic obstructive pulmonary disease: a cross-sectional study.Medicine2016; 95: e5471, doi: 10.1097/MD.0000000000005471.
4. Agusti A, Calverley PMA, Celli B, Coxson HO, Edwards LD, Lomas DA, et al. Characterisation of COPD heterogeneity in the ECLIPSE cohort. Respir Res 2010; 11: 122, doi: 10.1186/1465-9921-11-122.
5. Jarenbäck L, Ankerst J, Bjermer L, Tufvesson E. Acinar ventilation heterogeneity in COPD relates to diffusion capacity, resistance and reactance. Respir Med 2016; 110: 28–33, doi: 10.1016/j.rmed.2015.11.005.
6. Lopes AJ, de Melo PL. Brazilian studies on pulmonary function in COPD patients: what are the gaps?Int J Chron Obstruct Pulmon Dis2016; 11: 1553–1567, doi: 10.2147/ COPD.S54328.
7. Robinson PD, Latzin P, Verbanck S, Hall GL, Horsley A, Gappa M, et al. Consensus statement for inert gas washout measurement using multiple- and single- breath tests. Eur Respir J2013; 41: 507–522, doi: 10.1183/09031936.00069712. 8. Lopes AJ, Mafort TT. Correlations between small airway function, ventilation distribution, and functional exercise capacity in COPD patients. Lung 2014; 192: 653–659, doi: 10.1007/s00408-014-9626-1.
9. Boeck L, Gensmer A, Nyilas S, Stieltjes B, Re TJ, Tamm M, et al. Single-breath washout tests to assess small airway disease in COPD.Chest2016; 150: 1091–1100, doi: 10.1016/ j.chest.2016.05.019.
10. Weisman IM, Zeballos RJ. Clinical exercise testing. Clin Chest Med2001; 22: 679–701, doi: 10.1016/S0272-5231 (05)70060-5.
11. O’Donnell DE, Maltais F, Porszasz J, Webb KA, Albers FC, Deng Q, et al. The continuum of physiological impairment during treadmill walking in patients with mild-to-moderate COPD: patient characterization phase of a randomized clinical trial.PloS One2014; 9: e96574, doi: 10.1371/journal. pone.0096574.
13. O’Donnell DE, Elbehairy AF, Faisal A, Webb KA, Neder JA, Mahler DA. Exertional dyspnoea in COPD: the clinical utility of cardiopulmonary exercise testing.Eur Respir Rev2016; 25: 333–347, doi: 10.1183/16000617.0054-2016.
14. Kovelis D, Segretti NO, Probst VS, Lareau SC, Brunetto AF, Pitta F. Validation of the Modified Pulmonary Functional Status and Dyspnea Questionnaire and the Medical Research Council scale for use in Brazilian patients with chronic obstructive pulmonary disease.J Bras Pneumol2008; 34: 1008–1018, doi: 10.1590/S1806-37132008001200005.
15. Silva GP, Morano MT, Viana CM, Magalhães CB, Pereira ED. Portuguese-language version of the COPD Assessment Test: validation for use in Brazil.J Bras Pneumol2013; 39: 402–408, doi: 10.1590/S1806-37132013000400002. 16. Ciconelli RM, Ferraz MB, Santos W, Meinão I, Quaresma
MR. Brazilian-Portuguese version of the SF-36: a reliable and valid quality of life outcome measure. Rev Bras Reumatol 1999; 39: 143–150.
17. Sousa TC, Jardim JR, Jones P. Validation of the Saint George’s Respiratory Questionnaire in patients with chronic obstructive pulmonary disease in Brazil.J Pneumologia2000; 26: 119–128, doi: 10.1590/S0102-35862000000300004. 18. Miller MR, Hankinson J, Brusasco V, Burgos F, Casaburi R,
Coates A, et al. Standardisation of spirometry.Eur Respir J 2005; 26: 319–338, doi: 10.1183/09031936.05.00034805. 19. Pereira CAC, Rodrigues SC, Sato T. New reference values
for forced spirometry in white adults in Brazil.J Bras Pneumol 2007; 33: 397–406, doi: 10.1590/S1806-37132007000400008. 20. Neder JA, Andreoni S, Castelo-Filho A, Nery LE. Reference values for lung function tests. I. Static volumes.Braz J Med Biol Res1999; 32: 703–717, doi: 10.1590/S0100-879X199 9000600006.
21. Buist AS, Ross BB. Predicted values for closing volumes using a modified single breath nitrogen test.Am Rev Respir Dis1973; 107: 744–752, doi: 10.1164/arrd.1973.107.5.744. 22. American Thoracic Society, American College of Chest Physicians. Statement on cardiopulmonary exercise testing. Am J Respir Crit Care Med2003; 167: 211–277, doi: 10.1164/ rccm.167.2.211.
23. Sietsema KE, Kraft M, Ginzton L, Sharma OP. Abnormal oxygen uptake responses to exercise in patients with mild pulmonary sarcoidosis.Chest1992; 102: 838–845, doi: 10.1378/chest.102.3.838.
24. Neder JA, Nery LE, Castelo A, Andreoni S, Lerario MC, Sachs A, et al. Prediction of metabolic and cardiopulmonary responses to maximum cycle ergometry: a randomized study. Eur Respir J 1999; 14: 1304–1313, doi: 10.1183/ 09031936.99.14613049.
25. Bland JM, Altman DG. Statistical methods for assessing agreement between two methods of clinical measurement. Lancet 1986; 1: 307–310, doi: 10.1016/S0140-6736(86) 90837-8.
26. Jones JH, Zelt JT, Hirai DM, Diniz CV, Zaza A, O’Donnell DE, et al. Emphysema on thoracic CT and exercise ventila-tory inefficiency in mild-to-moderate COPD. COPD 2017; 14: 210–218, doi: 10.1080/15412555.2016.1253670. 27. Yamasawa W, Tasaka S, Betsuyaku T, Yamaguchi K.
Correlation of a decline in aerobic capacity with development of emphysema in patients with chronic obstructive pulmonary disease: a prospective observational study.Plos One2015; 10: e0125053, doi: 10.1371/journal.pone.0125053.
28. Bhatt SP, Soler X, Wang W, Murray S, Anzueto AR, Beaty TH, et al. Association between functional small airways disease and FEV1decline in chronic obstructive pulmonary disease.Am J Respir Crit Care Med2016; 194: 178–184, doi: 10.1164/rccm.201511-2219OC.
29. Hueper K, Vogel-Claussen J, Parikh MA, Austin JH, Bluemke DA, Carr J, et al. Pulmonary microvascular bloodflow in mild chronic obstructive pulmonary disease and emphysema: the MESA COPD study.Am J Respir Crit Care Med2015; 192: 570–580, doi: 10.1164/rccm.201411-2120OC.
30. Hogg JC, Paré PD, Hackett TL. The contribution of small airway obstruction to the pathogenesis of chronic obstructive pulmonary disease. Physiol Rev 2017; 97: 529–552, doi: 10.1152/physrev.00025.2015.
31. Robinson PD, Goldman MD, Gustafsson PM. Inert gas washout: theoretical background and clinical utility in respira-tory disease. Respiration2009; 78: 339–355, doi: 10.1159/ 000225373.
32. Vestbo J, Hurd SS, Agustí AG, Jones PW, Vogelmeier C, Anzueto A, et al. Global strategy for the diagnosis, manage-ment, and prevention of chronic obstructive pulmonary disease: GOLD executive summary. Am J Respir Crit Care Med2013; 187: 347–365, doi: 10.1164/rccm.201204-0596PP.
33. Karloh M, Fleig Mayer A, Maurici R, Pizzichini MM, Jones PW, Pizzichini E. The COPD assessment test: what do we know so far?: A systematic review and meta-analysis about clinical outcomes prediction and classification of patients into GOLD stages.Chest2016; 149: 413–425, doi: 10.1378/ chest.15-1752.
34. Kelly JL, Bamsey O, Smith C, Lord VM, Shrikrishna D, Jones PW, et al. Health status assessment in routine clinical practice: the chronic obstructive pulmonary disease assess-ment test score in outpatients.Respiration2012; 84: 193– 199, doi: 10.1159/000336549.
35. Papaioannou M, Pitsiou G, Manika K, Kontou P, Zarogou-lidis P, Sichletidis L, et al. COPD assessment test: a simple tool to evaluate disease severity and response to treatment. COPD 2014; 11: 489–495, doi: 10.3109/15412555.2014. 898034.
36. Morishita-Katsu M, Nishimura K, Taniguchi H, Kimura T, Kondoh Y, Kataoka K, et al. The COPD assessment test and St George’s Respiratory Questionnaire: are they equivalent in subjects with COPD?Int J Chron Obstruct Pulmon Dis 2016; 11: 1543–1551, doi: 10.2147/COPD.S104947. 37. Oey IF, Morgan MD, Spyt TJ, Waller DA. Staged bilateral
lung volume reduction surgery - the benefits of a patient-led strategy.Eur J Cardiothorac Surg2010; 37: 846–852, doi: 10.1016/j.ejcts.2009.10.025.
38. Mirdamadi M, Rahimi B, Safavi E, Abtahi H, Peiman S. Correlation of cardiopulmonary exercise testing parameters with quality of life in stable COPD patients. J Thorac Dis 2016; 8: 2138–2145, doi: 10.21037/jtd.2016.07.07. 39. Verhage TL, Vercoulen JH, van Helvoort HA, Peters JB,
Molema J, Dekhuijzen PN, et al. Maximal exercise capacity in chronic obstructive pulmonary disease: a limited indicator of the health status. Respiration 2010; 80: 453–462, doi: 10.1159/000295920.