Drift of Ichthyoplankton in Two Channels of the Paraná
River, Between Paraná and Mato Grosso do Sul States,
Brazil.
Andréa Bialetzki
*1; Paulo Vanderlei Sanches
1; Maristela Cavicchioli
1; Gilmar
Baumgartner
1,2; Ricardo Pereira Ribeiro
1,3and Keshiyu Nakatani
1,2.
1Pós-graduação em Ecologia de Ambientes Aquáticos Continentais/UEM. 2DBI/Nupélia/UEM. 3DZO/UEM.
Universidade Estadual de Maringá - Av. Colombo, 5790, bloco G-90, CEP 87020-900, Maringá, PR, Brazil.
ABSTRACT
Analysis of drift of ichthyoplankton in two channels in the River Paraná, Brazil, were made. Sampling was undertaken from October 1995 to April 1996 during nychthemeral cycles. Water samples were collected to determine several environmental variables. Eggs densities largely differed to layers, times of day and months. In both the channels, highest occurrence of eggs was detected between January and March; greater concentrations at the bottom, during night. With regard to larvae, densities were significantly different in channels, times of days and months. Maximum occurrences were seen in the right channel, in both layers, with largest capture between January and March. Surface of the both channels presented highest density of larvae during night. Water temperature, electrical conductivity and flux velocity were different in the two channels, however, these variables and larvae density didn’t showed correlations. This indicates that there was another possible factor, might be influencing the distribution of ichthyoplankton.
Key words: Drift; ichthyoplankton; Paraná River.
*Author for correspondence
INTRODUCTION
The Paraná River is the principal river of the Plata basin passing through the central part of South America. Its last non-dammed stretch in Brazilian territory lies between the Guaíra region in the state of Paraná and the mouth of the Paranapanema River. In this area, it forms an anastomosed channel with reduced declivity and great sedimentary accumulations, giving rise to numerous islands and sandbanks.
The great tropical rivers have been considered spawning areas for several fish species (Welcomme, 1985; Nakatani et al., 1993). Many fishes generally seek areas close to the river sources for reproduction and normally spawn in the principal channel where environmental conditions such as temperature and dissolved
oxygen are stable (Forsberg, 1985). According to Godoy (1954), spawning of rheophilic fish depended on river dynamics in places with specific water depth where fish could gather and millions of oocytes could be fecundated. After spawning the eggs and larvae in the initial stages of development are passively transported by currents to feeding and growth sites, or rather, to marginal lagoons along the river which function as nurseries and make their development possible. Thus, drift of eggs and larvae is of great importance in the fish life cycle because it causes the dispersion of individuals to these environments and increases chances of survival of the species (Oliveira & Araujo-Lima, 1998).
practical importance when the river is used commercially.
The aim of present study was analyses of the process of drift of fish eggs and larvae in two channels of the Paraná River, with different flux and topography, between Paraná and Mato Grosso do Sul states.
MATERIALS AND METHODS
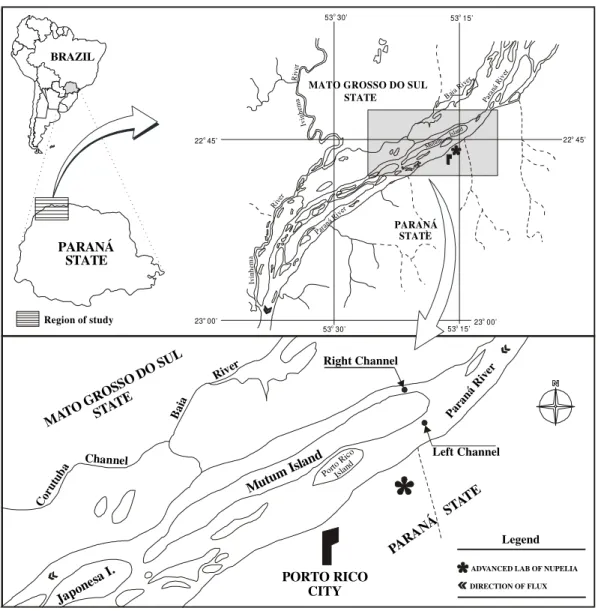
Two sampling stations were established (upstream the Mutum island) in two channels of the Paraná River: one in the right channel (Mato Grosso do Sul state side) and the other in the left channel (Paraná state side)(Fig. 1). Stations were placed in the deepest points of each site. Depths of right and left channels were 5m and 13m, respectively.
Sampling was undertaken between October 1995 and April 1996 (when the majority of the species were in reproductive period), with 4-hours intervals between samplings during nychthemeral cycles. Simultaneous collections at the surface and bottom of the two stations were undertaken. A conic-cylindrical plankton net, 0.5mm mesh with 0.1104m2 mouth diameter, was used for surface collections and exposed during 10 minutes. For bottom collections, nets of the same type and mesh, with
mouth diameter 0.06605m2, connected to a sled-like dredge were exposed for 15 minutes. Both the nets were equipped with flowmeters to obtain volume of filtered water. Samples were fixed with 4% formaldehyde plugged with CaCO3. Water samples were collected to
determine environmental variables (temperature, pH, electrical conductivity and dissolved oxygen).
Samples of ichthyoplankton collected were standardized for one volume of 10m3 of filtered water according to Tanaka (1973), modified. Relative density of eggs and larvae was obtained by the expression: D = C/B; where: D = Density of eggs or larvae; C = number of eggs or larvae per station; B = number of station with eggs and larvae occurrence.
Flux velocity was measured in both the channels and layers by means of a flowmeter by the expression: V = ((n x f)/999999)/t; where: V = flux velocity (m/s); n = number of turns of flowmeter; f = calibration factor of flowmeter (26.873); t = time of exposure.
Figure 1 - Site of sampling stations.
Environmental variables significantly different were associated to density of eggs and larvae by the Principal Components Analysis to verify interdependence among variables (Manly, 1995). Data were standardized because of different measurement units.
PCA scores applied to the significantly different environmental variables were used as explanatory variables of eggs and larvae densities, which were previously transformed in logarithms by the addition of a constant 01.
Eggs and larvae distribution (individuals/10m3) during collection period was analyzed by ANOVA with repeated measures (Von Ende, 1993). Model employed evaluated influence of
the layer (surface and bottom), time (during the day; at 08.00 12.00 and 16.00 hours; during the night; at 20.00, 00.00 and 04.00 hours), channel (right or left) and month, together with the interaction of these variables on eggs and larvae distribution. According to the presupposed of ANOVA, the data were previously transformed
into square root
( (
y
+
1 ).
)
RESULTS AND DISCUSSIONS
Physical and Chemical Data
Monthly averages of environmental variables during the collection period are shown in Table 1. Considerable differences were found in
53 30’o
53 15’o
53 30’o
53 15’o
CITY
PARANÁ
PARA
NÁ
MATO GROSSO DO SUL
23 00’o
23 00’o
22 45’o 22 45’o
PARANÁ STATE
STATE
STATE
STAT E
DIRECTION OF FLUX ADVANCED LAB OF NUPELIA
Legend
Region of study
BRAZIL
PORTO RICO MATO
GROS SO DO
SUL
STAT
E
River
Bai a
Cor utub
a Channel
Baia River
Para ná R
iver
Para ná R
iver
Para ná R
iver
Iv
in
h
em
a
Riv
er
Iv
in
h
em
a
Riv er
Mutum Island
Mutum Island
Right Channel
Left Channel
Japone
sa I.
Porto Rico
temperature, electrical conductivity and flux velocity of the water from two channel (Tab. 2).
Temporal distribution of eggs and larvae
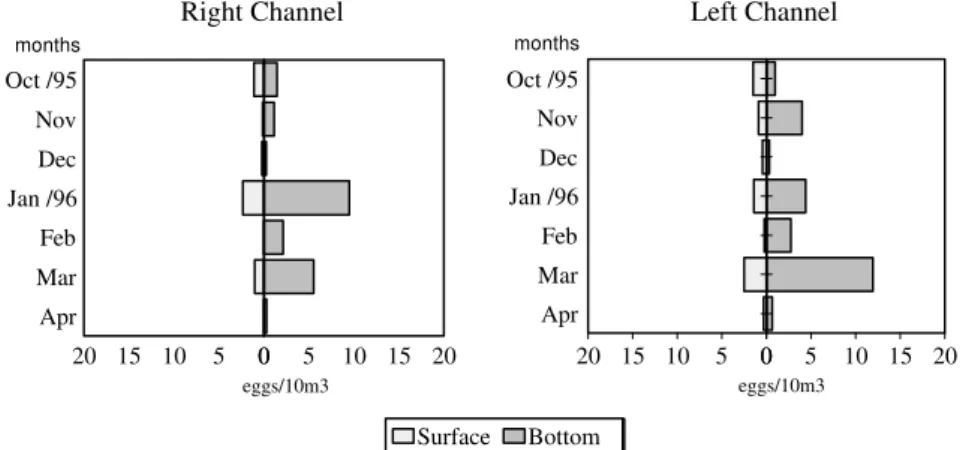
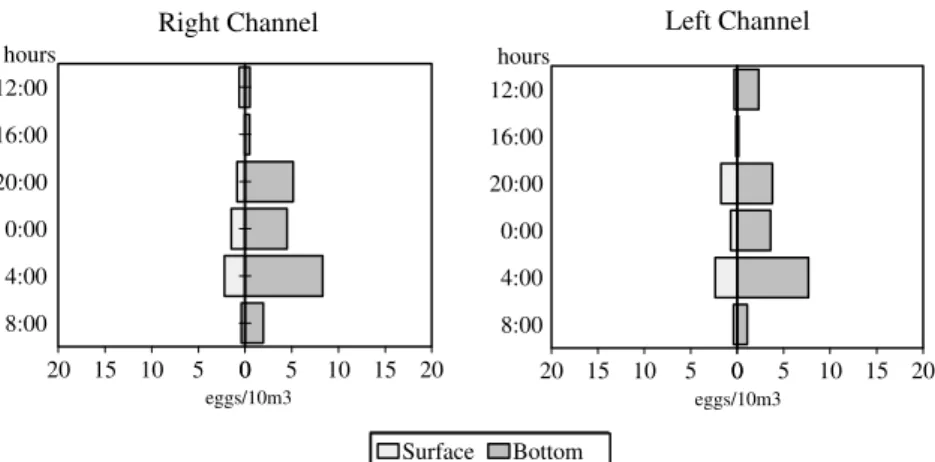
Results of variance analysis with repeated measures revealed that eggs density differed considerably between layers (df = 1; F = 7.69;
p< 0.05); time (df = 1; F = 9.43; p<0.01) and months (df = 1; F = 5.23; p< 0.001) (Fig. 2 and 3). In both the channels, highest occurrences of eggs were found from January to March and this was made at the bottom at night time.
Table 1 – Monthly mean values of variables, water temperature, pH, electrical conductivity and dissolved oxygen, in channels on the right and left bank of the Paraná River during collection period (S = surface; B = bottom; - Not collected).
Right Channel
Parameters/Months OCT NOV DEC JAN FEB MAR APR
Layer S B S B S B S B S B S B S B
Water temperature (°C) 28.6 - 27.3 26.6 28.7 28.4 28.0 27.8 29.0 28.6 28.5 28.7 26.2 25.8 pH 7.8 - 7.6 7.6 7.8 7.9 7.3 7.1 7.5 7.5 7.5 7.6 7.5 7.5 E. conductivity (µS/cm) 39.3 - 42.0 42.8 46.0 46.3 57.8 58.7 39.3 41.5 44.5 47.0 51.4 51.4 D. oxygen (mg/l) 8.0 - 7.9 7.0 7.6 6.5 7.3 6.0 7.3 5.8 7.7 7.5 8.4 8.3 Flux velocity (m/s) 0.7 0.43 0.9 0.3 0.8 0.1 0.9 1.1 0.8 0.5 0.9 0.4 0.8 0.6
Left Channel
Temperature (°C) 26.5 - 26.9 26.4 28.3 28.2 28.3 28.0 28.5 28.3 28.4 27.8 25.5 24.8 pH 8.0 - 7.8 7.7 7.9 8.0 7.1 7.1 7.5 7.5 7.6 7.6 7.5 7.6 E. conductivity (µS/cm) 54.3 - 53.0 53.3 53.7 55.3 62.2 60.7 50.5 52.0 54.3 51.1 56.5 57.1 D. oxygen (mg/l) 8.7 - 7.9 6.9 7.6 6.2 6.5 6.5 7.1 5.5 7.5 7.5 8.1 8.1 Flux velocity (m/s) 0.9 0.7 1.0 0.9 1.1 1.1 1.1 1.0 1.0 0.7 1.1 1.1 1.1 1.1
Table 2 – Result of Student’s t test for independent samples obtained in environmental variables for both channels (R = right Channel; L = left Channel; P = probability).
Environmental variables Averages P
Channel R L
Water temperature (°C) 27.85 27.30 0.016*
pH 7.57 7.63 ns
Electrical conductivity (µS/cm) 45.48 54.07. 0.000**
Dissolved oxygen (mg/l) 7.30 7.82 ns
Flux velocity (m/s) 0.58 0.99 0.000**
* p<0.05; **p<0.001; ns = not significant at adopted significance level (p<0.05).
Right Channel Left Channel
Oct /95 Nov Dec Jan /96 Feb Mar Apr
0 5 10 15
20 0 5 10 15 20
Superfície Fundo Oct /95
Nov Dec Jan /96 Feb Mar Apr
0 5 10 15
20 0 5 10 15 20
Surface Bottom
eggs/10m3 eggs/10m3
months months
Right Channel Left Channel
12:00
16:00
20:00
0:00
4:00
8:00
0 5 10 15
20 0 5 10 15 20
Surface Bottom 12:00
16:00
20:00
0:00
4:00
8:00
0 5 10 15
20 0 5 10 15 20
Surface Bottom
eggs/10m3 eggs/10m3
hours hours
Figure 3 – Relative densities of eggs collected during nychthemeral cycles in two channels (right and left) of the Paraná River.
Interactions between month and layer (df = 6; F = 2.56; p<0.05) and month and time (df = 6; F = 3.36; p<0.01) showed that the effect of the month on captures depended on layer and time of day. High densities of captured egg at the bottom in the two channels were probably the result of a great number of species of fish that presented demersal eggs whose development and hatching occured at this layer because of their high density or lack of structures that would maintain them floating, as found in some sea species (Gerking, 1994).
With regard to the two channels, highest captures of eggs was registered during the night period, probably associated with the time in which the great majority of fish species spawns. According to Godoy (1975), fish generally spawn in the afternoon when water temperature reaches highest values.
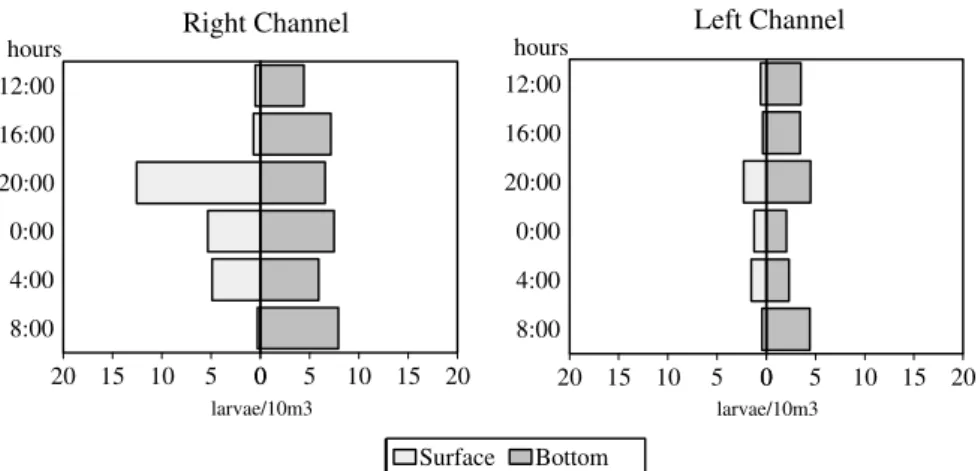
Considerable differences between larvae densities were also observed in the channels (df = 1; F = 19.05; p<0.001), time (df = 1; F = 4.12; p<0.10) and months (df = 6; F = 30.77; p<0.001), with more captures in the right channel at the surface and at the bottom. Monthly captures of larvae showed similar standard as that observed for eggs; highest captures occurred between January and March (Fig. 4). In both the channels, the surface had the maximum densities during the night period, whereas at the bottom, the larvae densities were more homogenous and didn’t differ with regard to time of day (Fig. 5).
Interactions between month and channel (df = 6; F = 6.57; p<0.001), month and layer (df = 6; F = 3.27; p<0.01) and month and time (df = 6; F = 3.23; p<0.01) indicated that variables directly influenced the captures along the months.
Right Channel Left Channel
Oct /95 Nov Dec Jan /96 Feb Mar Apr
0 5 10 15
20 0 5 10 15 20
Superfície Fundo Oct /95
Nov Dec Jan /96 Feb Mar Apr
0 5 10 15
20 0 5 10 15 20
Surface Bottom
larvae/10m3 larvae/10m3
months months
Right Channel Left Channel
12:00
16:00
20:00
0:00
4:00
8:00
0 5 10 15
20 0 5 10 15 20
Surface Bottom 12:00
16:00
20:00
0:00
4:00
8:00
0 5 10 15
20 0 5 10 15 20
Surface Bottom
larvae/10m3 larvae/10m3
hours hours
Figure 5 – Relative densities of larvae collected during nychthemeral cycles in two channels (right and left) of the Paraná River.
Standard capture in the channels could be associated with the differences in flux velocity. Theoretically it might be expected that sites with greater flux would have greater larvae densities since they are transported by the water current. However, such trend was not observed in this particular case. Highest occurrences were registered in the right channel with less flux. In this study, the left bank has been considered the principal channel, or rather, the river’s erosion area since it is deeper (approximately 13 m) and has a greater flux velocity. On the other hand, the right bank is considered a sedimentary area with depths around 5 m. According to Carling (1992), rivers presented secondary currents in a center-margin direction, besides principal longitudinal velocity currents. Secondary currents have probably carried the larvae of the principal water current to the sedimentary bank. This would explain their greater occurrence in the right channel. The transportation of larvae to the right channel has advantages to the species. The site has been characterized by a high floodplain with a great number of marginal lagoons, which favour larvae survival and development and which, in their turn, are essential biotopes for the development, growth and initial feeding of fish (Nakatani et al., 1997).
Generally larvae have a daily drift standard, with highest occurrences on the surface during the night period. This standard could be a strategy to escape predation and because of higher food availability during the period (Armstrong &
Brown, 1983). These hypotheses may be applied to results obtained in this investigation.
On the other hand, small variation in captures at the bottom between the above mentioned period could be the result of the occurrence of not well developed (recently hatched) larvae or of species without vertical migration behavior.
The period of highest captures of eggs and larvae in this study (January to March) coincided with that obtained by Baumgartner et al. (1997). Vazzoler (1996) noted that in the floodplain of the upper Paraná River, the majority of the fish has the highest reproduction intensity between October and March.
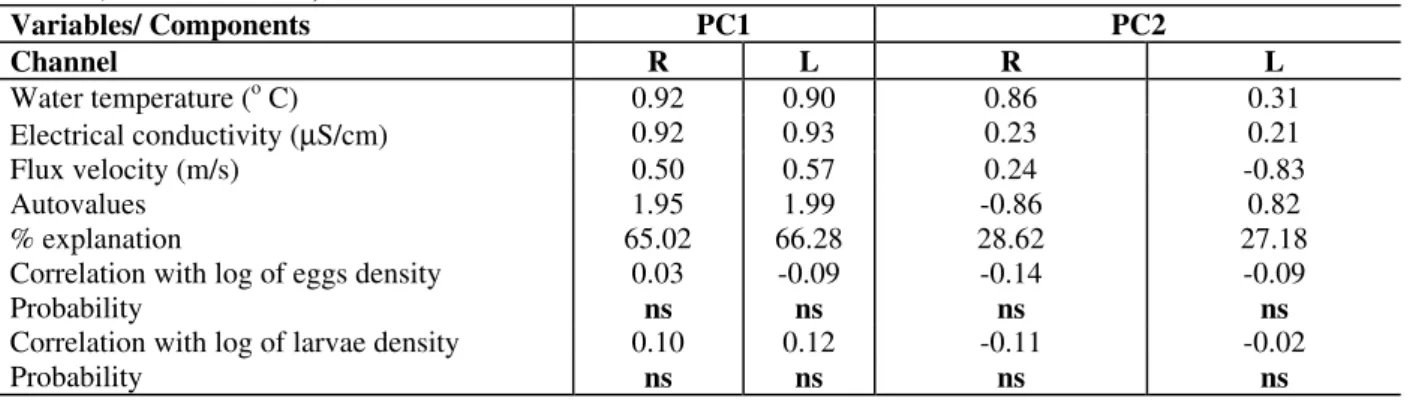
Relation between environmental variables and density of eggs and larvae
Different environmental variables in the two channels (temperature, electrical conductivity and flux velocity) didn’t show significant correlations with egg and larvae densities. Results of the Principal Components Analysis applied to these variables and to eggs and larvae densities are shown in Table 3.
Table 3 – Pearson’s correlation between scores for Principal Components applied to environmental variables and log values of eggs and larvae densities (PC1=Principal component 1; PC2=Principal Component 2; R = right Channel; L = left Channel).
Variables/ Components PC1 PC2
Channel R L R L
Water temperature (o C) 0.92 0.90 0.86 0.31 Electrical conductivity (µS/cm) 0.92 0.93 0.23 0.21
Flux velocity (m/s) 0.50 0.57 0.24 -0.83
Autovalues 1.95 1.99 -0.86 0.82
% explanation 65.02 66.28 28.62 27.18
Correlation with log of eggs density 0.03 -0.09 -0.14 -0.09
Probability ns ns ns ns
Correlation with log of larvae density 0.10 0.12 -0.11 -0.02
Probability ns ns ns ns
ns=not significant at level of current significance (p<0.05
).
ACKNOWLEDGEMENTS
The authors would like to thank ELETROBRAS (Centrais Elétricas Brasileiras S.A) for financial support; NUPELIA (Research Nucleus in Limnology. Ichthyology and Aquiculture) for facilities and Prof. Luiz Carlos Gomes for his help in statistical analyses.
RESUMO
Este trabalho teve por objetivo analisar a deriva do ictioplâncton em dois canais com diferentes condições de topografia e velocidade de fluxo, entre os estados do Paraná e Mato Grosso do Sul (Brasil). As amostragens foram realizadas no período de outubro de 1995 a abril de 1996, durante ciclos nictemerais. Amostras de água foram coletadas para determinação de algumas variáveis ambientais. A densidade de ovos diferiu significativamente entre os estratos, horários e meses; sendo que em ambos os canais, as maiores ocorrências de ovos foram verificadas entre janeiro e março, com maiores concentrações no fundo durante o período noturno. Com relação as larvas, as densidades diferiram entre os canais, horários e meses. As maiores ocorrências foram observas no canal direito, em ambos estratos, com maior período de captura entre janeiro e março. A superfície dos canais apresentou as maiores densidades de larvas durante o período noturno. A temperatura da água, condutividade elétrica e velocidade de
fluxo foram diferentes entre os canais, entretanto, essas variáveis e a densidade de larvas não mostraram correlação, indicando que possivelmente outro fator, esteja influenciando a distribuição do ictioplâncton neste ambiente.
REFERENCES
Armstrong, M. L. & Brown, A. V. (1983), Diel drift and feeding of channel catfish alevin in the Illinois River. Arkansas. Trans. Am. Fish. Soc., 112, 302-307.
Baumgartner, G.; Nakatani, K. & Cavicchioli, M. (1997), Some aspects of the ecology of fishes larvae in the floodplain of the high Paraná river, Brazil. Revta. bras. Zool., 14, 551-563.
Carling, P. A. (1992), In-stream hydraulics and sediment transport. In: The rivers handbook hydrological and ecological principles
(Eds.) P. Calow & G. E. Petts, Blackwell Scientific Publications, London. pp. 101-124.
Forsberg, B. R. (1985), The fate of planktonic primary production. Limnology and Oceanography, 30, 807-819.
Gerking, S. D. (1994), Feeding ecology of fish.
Academic Press, San Diego. 416p.
Godoy, M. P. (1954), Locais de desovas de peixes num trecho do rio Mogi Guassu, Estado de São Paulo, Brasil. Rev. Brasil. Biol., 4, 375-386
Godoy, M. P. (1975), Peixes do Brasil sub-ordem Characoidei - Bacia do rio Mogi
Manly, B. F. J. (1995), Multivariate statistical methods: A primer. Chapman & Hall, London. 215p.
Nakatani, K.; Latini, J. D.; Baumgartner, G.; Baumgartner, M. S. T. (1993), Distribuição espacial e temporal das larvas de curvina
Plagioscion squamosissimus (Heckel, 1840) (Osteichthyes, Scianidae), no reservatório de Itaipu. Revista Unimar, 5, 191-209.
Nakatani, K.; Baumgartner, G.; Cavicchioli, M. (1997), Ecologia de ovos e larvas de peixes.
In: A planície de inundação do alto rio Paraná: aspectos físicos, biológicos e socioeconômicos (Eds). A. E. A. de M. Vazzoler; A. A. Agostinho & N. S. Hahn.
EDUEM, Maringá. pp. 281-306.
Oliveira, E. C. & Araújo-Lima, C. A. R. M. (1998), Distribuição das larvas de Mylossoma aureum e M. duriventre (Pisces: Serrasalmidae) no rio Solimões, AM. Rev. Brasil. Biol. 58, 349-358.
Tanaka, S. (1973), Stock assesment by means of ichtyoplankton surveys. FAO-Fish. Tech. Pap., 122, 33-51.
Vazzoler, A. E. A de M. (1996), Biologia da reprodução de peixes teleósteos: teoria e prática. EDUEM, Maringá. 169 p.
Vieira, S. (1981), Introdução à bioestatística. Campus, Rio de Janeiro. pp. 205-221.
Von Ende, C. (1993), Repeated-measures analysis: growth and other time dependent measures. In:: Design and Analysis of Ecological Experiments. (Eds.) S. M. Scheiner & J. Gurevitch. Chapman & Hall, New York. 113 p.
Welcomme, R. L. (1985), River fisheries. FAO-Fish. Tech. Pap., pp.262-330.