Acta Scientiarum
http://periodicos.uem.br/ojs/acta ISSN on-line: 1807-8621
Doi: 10.4025/actasciagron.v40i1.35290 CROP PRODUCTION
Improvement of production and fruit quality of pitayas with
potassium fertilization
Denison Ramalho Fernandes1, Rodrigo Amato Moreira2*, Maria do Céu Monteiro da Cruz1, Josimara Mendes Rabelo1 and Jéssica de Oliveira1
1
Instituto Federal do Norte de Minas, Fazenda São Geraldo, s/n, Estrada Januária, km 06, 39480-000, Januária, Minas Gerais, Brazil.
2
Universidade Federal dos Vales do Jequitinhonha e Mucuri, Diamantina, Minas Gerais, Brazil. *Author for correspondence. E-mail: [email protected]
ABSTRACT. Pitaya is a fruit that is becoming promising for cultivation around the world due to the quality of its fruits in terms of taste and their peculiar external shape. Because it is a recenttly cultivated crop, information about fertilization is essential to enable its production. In this sense, this study was performed aiming to evaluate different doses of K2O for pitaya cultivation. Hylocereus undatus and Hylocereus
polyrhizus were studied under field conditions. Pitayas were cultivated at a 3 × 3m spacing, and four doses
of K2O were tested: 0, 50, 100, and 200 g plant-1, with a 2 × 4 factorial arrangement distributed in a randomized block design. The production per plant (kg and number of fruits) was evaluated in the production cycles of 2013/2014, 2014/2015, and 2015/2016. The fruit quality was also evaluated: longitudinal diameter, transverse diameter, mass, soluble solids content, titratable acidity and soluble solids/titratable acidity ratio. Potassium fertilization increased production and provided a better quality of pitaya fruits.K2O fertilization should be from 106.0 to 133.3 g K2O in the first year and 200 g K2O in the second and third years after planting.
Keywords: chemical fertilizer; exotic fruit; Hylocereus undatus; Hylocereus polyrhizus.
Melhoria da produção e qualidade de pitaias com adubação potássica
RESUMO. A pitaia é uma frutífera que está se tornando promissora no mundo, devido a qualidade de seus frutos, no que tange o sabor e formato externo peculiar. Por ser uma espécie de cultivo recente, informações sobre fertilização são essenciais para permitir sistemas de produção. Nesse sentido, a pesquisa foi realizada com o objetivo de estudar diferentes doses de K2O para o cultivo de pitaia. As espécies
Hylocereus undantus e Hylocereus polyrhizus foram estudadas em condições de campo. As pitaias foram
cultivadas no espaçamento de 3 x 3 m e quatro doses de K2O foram testadas: 0, 50, 100 e 200 g de planta-1, com esquema fatorial 2 x 4, distribuídos em delineamento em blocos casualizados. A produção por planta (kg e número de frutos) foi avaliada nos ciclos de produção 2013/2014, 2014/2015 e 2015/2016. Também avaliou-se a qualidade das frutas: diâmetro longitudinal, diâmetro transversal, massa, teor de sólidos solúveis, acidez titulável e ratio. A adubação com potássio aumentou a produção e proporcionou melhor qualidade das frutas de pitaia. A adubação com K2O deve ser de 106,0 a 133,3 g K2O no primeiro ano e 200 g K2O no segundo e terceiro ano após o plantio.
Palavras-chave: fertilização química; fruta exótica; Hylocereus undatus; Hylocereus polyrhizus.
Introduction
The consumption of exotic fruits has significantly increased over recent years, promoting the interest of producers and traders. Among the exotic fruit species with great potential for marketing is pitaya (Hylocereus
sp.), a vine cacti native to the tropical forests of Mexico and Central and South America (Moreira, Ramos, Araújo, & Marques, 2011).
In Brazil, pitaya cultivation is in the expansion phase, with the largest producing area located in the state of São Paulo, especially the region of Catanduva (Bastos et al., 2006). Although it is a small fruit
compared to other commercialized fruits, it is becoming more popular in marketing centers due to its exotic appearance and organoleptic properties (Marques, Moreira, Ramos, Araújo, & Silva, 2011; Moreira et al., 2011).
To expand the area of pitaya cultivation in this country, knowledge about crop management is necessary, especially in regard to fertilization.
its growth and production (Corrêa, Almeida, Marques, Vale, & Aquino, 2014).
In Brazil, fertilization is performed as needed sporadically or based on doses recommended in other countries with different climatic and soil conditions (Cavalcante et al., 2011) because there is no information regarding plant nutrition for growth and satisfactory production.
For accurate nutrient recommendations, knowledge about the nutritional state of the species is necessary, which takes into account the physiological ecology and the plant growth rate. Thus, the extrapolation of results that have been obtained in other cropping systems is not recommended (Souza, Pio, Coelho, Rodas, & Silva, 2015).
Among the essential nutrients for culture, potassium is highly required, participates in many biochemical processes, and, when properly applied, favors the quality of pitaya fruit (Then, 2013).
Studies about potassium fertilization for pitaya in Brazil are still in the initial stages. In this sense, this study was performed with the aim to identify suitable doses of potassium in the production and fruit quality of two pitaya species.
Material and methods
The experiment was conducted in an orchard located 726 meters above sea level, 18° 04' 15"S latitude and 43° 28' 15"W longitude.
The climate according to Koppen and Gleiger is AW, classified as tropical with a dry winter season, with an average temperature of 24°C in the hottest month and 18.4°C in the coldest month and an average annual temperature of 21.5°C. The average annual rainfall is 1,246 mm, with well-defined dry and rainy seasons.
During the research period, the variation in temperature was recorded using a digital MT 240 MINIPA thermo hygrometer, and rainfall data were collected with the use of a rain gauge, both of which were installed in the experimental area (Figure1).
Two species of pitaya, Hylocereus undatus (Haw.) Britton & Rose and Hylocereus polyrhizus (Web.) Britton & Rose, which were ten months old and established from 1 m long cuttings, were planted in January 2013. Before planting the pitayas, soil analyses of the experimental area at the depths of 0-20 cm and 0-20-40 cm were performed (Table 1).
Figure 1. Monthly average temperatures (°C), maximum temperatures (°C), minimum temperatures (°C) and precipitation (mm) from January 2013 to May 2016.
Table 1. Chemical analysis of the soil in the experimental area before plantingat the depths of 0-20 and 20-40 cm.
Depth (cm) pH P K Ca Mg Al
3+ H + Al
H2O ----mg dm-3---- ---cmolc dm-3---
0-20 5.1 1.8 40.7 1.0 0.3 0.5 3.7
20-40 4.9 5.09 40.7 0.6 0.3 0.7 4.2
---
Depth (cm) SB T T V M O.M
---cmolc dm -3
--- ---%--- dag dm-3
0-20 1.4 1.9 5.1 28 26 0.4
20-40 1.0 1.7 5.2 19 40 0.1
pH(H2O): soil-water relation 1:2.5; P and K: Mehlich-1 extractor; Ca, Mg and Al: KCl 1 mol L-1 extractor; T: cation exchange capacity at pH 7.0; m: aluminum saturation; V: base saturation; OM: organic matter, determined by multiplying the result of organic carbon by 1.724 based on the Walkey-Black method; sand, silt and clay: pipette method.
0 50 100 150 200 250 300
10 15 20 25 30 35 40
precipita tion mea n tempera ture
ma ximum temperatures minimum tempera tures
Tem
p
er
a
tu
re
(
°C
)
2013 2014 2015
Experimenta l period
2016
P
re
cip
it
a
tio
n
(m
m
K fertilization for pitayas Page 3 of 9
The holes in which the pitayas were transplanted were 0.5 × 0.5 × 0.5 m, prepared with 200 g of dolomite lime (PRNT = 87%), 20 L of manure, and 300 g of single superphosphate (P2O5 = 18.0%, Ca
= 18.0%, and S = 20.0%).
The pitayas were attached to eucalyptus fence posts at 1.80 m in height at a spacing of 3 × 3 m. A 1 m long beam was positioned at the end of each fence post, forming a "T"-shaped structure. The plants were attached by a single cladode to reach the desired height; they were later pruned to form the productive shoots.
The experimental design was randomized blocks, with a 2 × 4 factorial design. The factors were two pitaya species and four doses of K2O: 0, 50, 100, and
200 g per plant, with four blocks and three plants per plot.
The source of K used was potassium chloride (58% of K2O). The tested doses were split in three months
(November, January, and April of each year). In these months, 100 g of N per plant was also applied using ammonium sulfate (20% of N and 22% of S).
One hundred and twenty grams of Yoorin Master®
was applied, split between January and April of 2014 and between January and April of 2015, and 5 L of manure was applied in June of 2014 and in June of 2015. Yoorin Master® contains 17.5% P
2O5, 18.0% Ca,
7.0% Mg, 0.1% B, 0.08% Cu, 0.3% Mn, 10% Si, and 0.55% Zn.
Irrigation was performed weekly, and weed control was conducted by hand up to 40 cm from the plant. The rest of the area was mowed.
The production per plant (kg and number of fruits) was evaluated in the production cycles 2013/2014, 2014/2015, and 2015/2016.
Fruit quality was analyzed using representative samples collected on each fertilization treatment. Ten fruits per plot were collected when they presented a peel with red coloration. The following parameters were evaluated: longitudinal diameter (mm), transverse diameter (mm), mass (g), soluble solids content (°Bx), titratable acidity (% of malic acid) and soluble solids/titratable acidity ratio.
In June 2014 and June 2015 soil samples were collected after harvesting the fruits for the analysis of the nutrient content in the soil. Cladode samples were collected in September 2014 and September 2015.
For the evaluation of soil fertility, samples were taken with a Dutch auger at a distance of 0.2 m from the main cladode and at a depth of 0 - 0.2 m for each plant, forming a sample composed of each experimental plot. The cladodes that were removed
to compose the sample were one year old, with an average size of 0.4 m and a healthy appearance. Each sample was composed of five cladodes per plot.
The data were submitted to analysis of variance, and the K2O doses were submitted to polynomial
regression analysis (p < 0.05). The species of pitaya were compared by the F test (p < 0.05).
Results
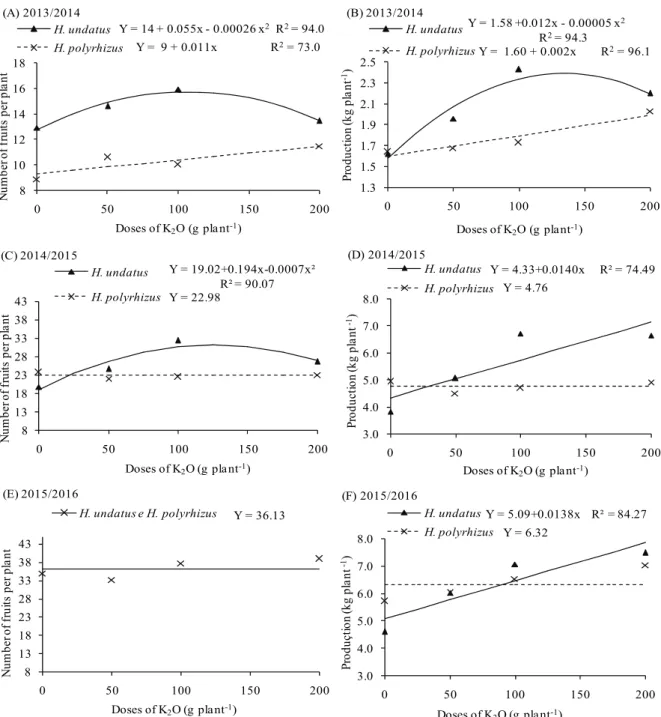
In the 2013/2014 productive cycle, differences were observed among the K2O doses in terms of the
number of fruits and production per plant (Figure 2A and B). Increases of 20.7% in the number of fruits per plant of H. undatus occurred with an estimated dose of 106g of K2O per plant. H.
polyrhizus showed an increase of 24.4% in the plants that received 200 g of K2O when compared to the
control, the plants without potassium fertilization (Figure 2A).
The production per plant (kg) was similar to the number of fruits produced in the 2013/2014 cycle, with an increase of 45.6% in H. undatus with the dose of 120 g of K2O per plant and 25.0% in H. polyrhizus with the
application of 200 g of K2O per plant (Figure 2B).
In the 2014/2015 production cycle, H. undatus
showed increases of 70.6% in the number of fruits per plant for the estimated dose of 135 g of K2O per plant
and 64.6% in production per plant with 200 g of K2O
compared to the plants without potassium fertilization. On the other hand, H. polyrhizus had similar production across all K fertilization doses (Figure 2C and D).
In 2015/2016, differences only occurred among K2O doses in terms of the production per plant. The
species produced an average of 36 fruits per plant (Figure 2E), and the productionin kg per plant showed an increase of 54.2% in H. undatus with 200 g of K2O
(Figure 2F).
Potassium fertilization also influenced fruit quality. In the 2013/2014 cycle, differences in the mass and diameters of the fruits were observed among theK2O
doses and between the two pitaya species. The largest fruit sizes produced by H. undatus were observed in plants fertilized with 124.3 and 133.3 g of K2O, with
increases of 79.8% in mass, 21.2% in transverse diameter and 22.6% in longitudinal diameter. In H. polyrhizus, fruits of larger sizes were observed in the plants fertilized with 127.4 and 138.3 g of K2O, with
Figure 2. Number of fruits and production per plant of H. undatus and H. polyrhizus as a function of the dose of K2O applied to the soil
for the production cycles of 2013/2014, 2014/2015 and 2015/2016.
In the following two cycles, differences in the mass and diametera of the fruits were observed only in H. undatus. In the 2014/2015 cycle, fruits of H. undatus increased 25.3% in mass, 25.2% in transverse diameter and 25% in longitudinal diameter with 200 g of K2O per plant (Figure 3C and D), while in the
2015/2016 cycle, the fruit mass increased 21.9%, the transverse diameter 22.2%, and the longitudinal diameter 21.9% in the plants also fertilized with 200 g of K2O (Figure 3E and F).
Regarding the soluble solids, acidity and soluble solids/acidity ratio, differences were observed only
between the species of pitaya. H. polyrhizus produced fruits with the highest soluble solids, whereas H. undatus produced the most acidic fruits. These differences between the species contributed to an increase in the soluble solids/acidity ratio in the fruits of H. polyrhizus (Table 2).
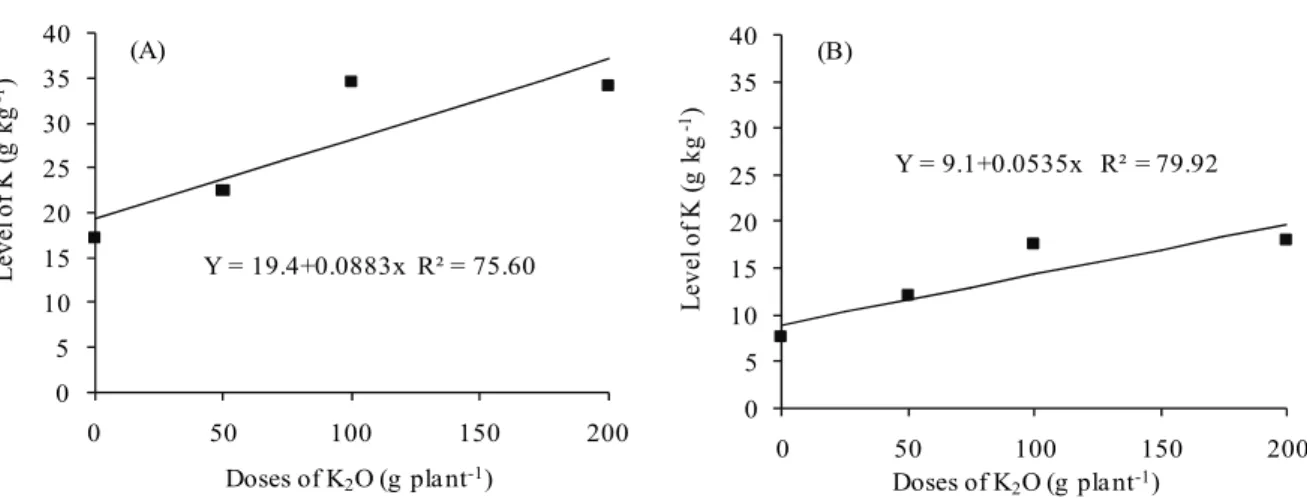
The levels of K in cladodes increased linearly as a function of the doses of K2O applied to the soil (Figure
4). In June 2014, a 91% higher level was observed in plants fertilized with 200 g of K2O when compared
with the control (Figure 4A). In June 2015, the plants fertilized with 200 g of K2O had a 117.5% increase in 8 10 12 14 16 18
0 50 100 150 200
N u m b er of f rui ts pe r p la n t
Doses of K2O (g pla nt-1)
H. undatus
H. polyrhizus
Y = 14 + 0.055x - 0.00026 x2 R2= 94.0
Y = 9 + 0.011x R2= 73.0
(A) 2013/2014 1.3 1.5 1.7 1.9 2.1 2.3 2.5
0 50 100 150 200
P rod uc ti o n ( kg p la n t -1)
Doses of K2O (g pla nt-1)
H. undatus
H. polyrhizus
Y = 1.58 +0.012x - 0.00005 x2
R2= 94.3
Y = 1.60 + 0.002x R2= 96.1
(B) 2013/2014 8 13 18 23 28 33 38 43
0 50 100 150 200
H. undatus
H. polyrhizus
Doses of K2O (g pla nt-1)
N u m b er of f rui ts p er p la n t
Y = 19.02+0.194x-0.0007x² R² = 90.07 Y = 22.98
(C) 2014/2015 3.0 4.0 5.0 6.0 7.0 8.0
0 50 100 150 200
H. undatus
H. polyrhizus
Doses of K2O (g pla nt-1)
P ro duc ti on (k g p la nt -1)
Y = 4.33+0.0140x R² = 74.49
Y = 4.76 (D) 2014/2015 8 13 18 23 28 33 38 43
0 50 100 150 200
H. undatus e H. polyrhizus
Doses of K2O (g pla nt-1)
N u m b er o f fr ui ts pe r p la nt (E) 2015/2016
Y = 36.13
3.0 4.0 5.0 6.0 7.0 8.0
0 50 100 150 200
H. undatus
H. polyrhizus
Doses of K2O (g pla nt-1)
P rod uç ti on ( k g p la nt -1) (F) 2015/2016
Y = 5.09+0.0138x R² = 84.27
K fertilization for pitayas Page 5 of 9
the K levels in cladodes (Figure 4B).
The levels of K in the soil also increased with the application of K2O. In June 2014, the K concentration
in the soil associated with plants without potassium fertilization was 87.56 mg dm-3, while it was788.3 mg
dm-3 in the soil associated with plants fertilized with
200 g K2O (Figure 5A). In June 2015, the K levels
increased from 103.9 mg dm-3 in the soil without
potassium fertilization to 516.2 mg dm-3 in the soil
fertilized with 200 g of K2O (Figure 5B).
Figure 3. Mass, transverse diameter (TD) and longitudinal diameter (LD) of H. undatus and H. polyrhizus fruits as a function of the dose of K2O applied to the soil for the production cycles of 2013/2014, 2014/2015, and 2015/2016.
0 50 100 150 200 250 300
0 50 100 150 200
H. undatus
H. polyrhizus
Doses of K2O (g pla nt -1)
M
a
ss (
g)
Y = 195.95+0.2477x R² = 92.39
Y = 213.68 (C) 2014/2015
40 60 80 100 120 140
0 50 100 150 200
TD H. undatus
TD H. polyrhizus
TL H. undatus
TL H. polyrhizus
Doses of K2O (g pla nt -1)
Y = 67.35 Y = 76.78+0.097x
R² = 91.08 (D) 2014/2015
Y = 90.91+0.114x R² = 90.89
Y = 74.80
D
ia
m
et
er
s (
m
m
)
0 50 100 150 200 250 300
0 50 100 150 200
M
a
ss (
g
)
Doses of K2O (g pla nt -1)
H. undatus
H. polyrhizus Y = 180.84+ 0.984x -0.0037x² R² = 99.8
Y = 109.21 +1.307x -0.0049x² R² = 99.5
(A) 2013/2014
0 50 100 150 200 250 300
0 50 100 150 200
H. undatus
H. polyrhizus
Doses of K2O (g pla nt-1)
M
a
ss (
g)
(E) 2015/2016
Y = 165.30+0.1815x R² = 94.71
Y = 175.5
40 60 80 100 120 140
0 50 100 150 200
TD H. undatus
TD H. polyrhizus
LD H. undatus
LD H. polyrhizus
Doses of K2O (g pla nt -1)
(F) 2015/2016 Y = 63.8+0.071x
R² = 89.39
Y = 55.45
Y = 76.5+0.084x R² = 90.73
Y = 61.59
D
ia
m
et
er
s (
m
m
)
40 60 80 100 120
0 50 100 150 200
Doses of K2O (g pla nt -1)
TD H. undatus
TD H. polyrhizus
LD H. undatus
LD H. polyrhizus
Y = 54.01+0.184x - 0.00074x² R² = 98.4
Y = 63.56+0.119x - 0.00043x² R² = 99.0
(B) 2013/2014
Di
a
m
et
e
rs
(
m
m
)
Y = 63.46+0.221x - 0.00085x² R² = 99.3
Figure 4. Levels of K in cladodes of H. undatus and H. polyrhizus as a function of the dose of K2O applied to the soil in September 2014
(A) and September 2015 (B).
Table 2. Soluble solids (SS), titratable acidity (TA) and soluble solids/acidity ratio (RAT) of H. undatus and H. polyrhizus fruits as a function of the dose of K2O applied to the soil in the production cycles of 2013/2014, 2014/2015 and 2015/2016.
K2O doses (g plant -1
) SS (°Bx) TA (%) RAT
H. undatus H. polyrhizus H. undatus H. polyrhizus H. undatus H. polyrhizus
2013/2014
0 15.54 16.87 0.45 0.27 35.23 61.76 50 15.17 16.41 0.46 0.24 34.88 68.65
100 16.58 17.67 0.45 0.32 37.46 56.46
200 15.42 16.34 0.47 0.24 35.70 68.13
Average 15.67 b 16.82 a 0.46 a 0.27 b 35.8 b 63.7 a
CV (%) 5.43 8.43 8.62
--- 2014/2015
0 16.62 20.25 0.29 0.08 65.24 266.72
50 16.87 19.62 0.25 0.10 73.29 191.63
100 17.98 19.62 0.26 0.09 71.74 234.40
200 16.62 21.50 0.27 0.12 66.61 176.46
Average 17.02 b 20.24 a 0.27 a 0.10 b 69.2 b 217.3 a
CV (%) 6.40 38.71 35.63
--- 2015/2016
0 16.65 19.75 0.51 0.21 33.14 98.97 50 17.50 21.37 0.51 0.24 34.51 90.55
100 17.50 22.00 0.49 0.25 35.87 88.93
200 17.75 21.00 0.53 0.22 36.36 76.66
Average 17.35 b 21.03 a 0.51 a 0.23 b 34.9 b 88.7 a
CV (%) 5.69 13.92 38.48
Means followed by the same lowercase letter within a row do not differ from one another based on the F test (p < 0.05).
Figure 5. Levels of K at 0-20 cm in soil samples cultivated with H. undatus and H. polyrhizus as a function of the dose of K2O applied to
the soil in June 2014 (A) and June 2015 (B).
0 5 10 15 20 25 30 35 40
0 50 100 150 200
Y = 19.4+0.0883x R² = 75.60
Doses of K2O (g pla nt-1) (A)
L
eve
l of
K
(
g
kg
-1)
0 5 10 15 20 25 30 35 40
0 50 100 150 200
Y = 9.1+0.0535x R² = 79.92
Doses of K2O (g pla nt-1) (B)
L
eve
l o
f
K
(
g
kg
-1)
0 100 200 300 400 500 600 700 800 900
0 50 100 150 200
Y = 103.92+2.0612x R² = 77.34
Doses of K2O (g pla nt-1)
L
eve
ls
of
K
i
n s
oi
l
(m
g
dm
-3)
(B)
0 100 200 300 400 500 600 700 800 900
0 50 100 150 200
L
eve
ls
of
K
i
n s
oi
l
(m
g
dm
-3) Y = 87.56+3.5038x
R² = 94.40
K fertilization for pitayas Page 7 of 9
Discussion
H. undatus was more productive than H. polyrhizus under different K2O applications because
they are different species (Figure 2) with distinct needs in relation to potassium fertilization.
The response of the plants to potassium fertilization occurred because the soil had low K availability according to the initial analysis performed at the beginning of the orchard installation in this study (Table 1). Thus, the fertilization allowed K to become available to the plants, performing essential functions such as assimilation and storage of assimilates (Meurer, 2006).
An increase in pitaya production has been reported under different growing conditions and fertilizer combinations. In Bangladesh, H. polyrhizus
yield increased from 12.88 t ha-1 to 31.64 t ha-1 with
250 g of K2O, 540 g of N, and 310 g of P per plant
(Chakma, Harunor Rashid, Roy, & Islam, 2014). The response of plants to potassium fertilization depends on the species and the soil fertility conditions in which they are cultivated. In the present study, an increase in H. polyrhizus
production occurred only in the 2013/2014 cycle, the first year after orchard establishment (Figure 2A and B). In the two harvests evaluated later, the K levels in the soil increased, even in the plants without K2O application (Figure 2C, D, E, and F).
This consequently contributed to the increased production. This observation may be explained by the addition of 5 L of bovine manure that was performed every year for all plants, contributing to the elevation in K levels in the soil, even for those plants without K2O application.
The yields observed in the third year (8.7 t ha-1
for H. undatus and 7 t ha-1 for H. polyrhizus) are
promising because in a H. undatus orchard aged 3 years old with bovine and chicken manure fertilization, the productivity was only 2.6 t ha-1
(Marques, Ramos, Araújo, & Moreira, 2012). In the present experiment, chemical fertilization contributed to causing the plants to begin production in the first year after planting, and in the second cycle, pitaya productivity was approximately 8 t ha-1 for H. undatus and 5.3 t ha-1 for H. polyrhizus
(Figure 2D). These results make the importance of adequate fertilization to obtain satisfactory pitaya yields evident.
Pitaya orchards reach production stability between the 5th and 6th year of cultivation and,
depending on the management employed, can producefor 15 to 20 years (Nerd, Tel-Zur, & Mizrahi, 2002). The average yield is 10 to 30 t ha-1,
varying according to the soil and climatic conditions, orchard age and cultivation techniques (Le Bellec, Vaillant, & Imbert, 2006).
The highest fruit size observed with the application of K2O to the soil (Figure 3) indicates
the contribution of fertilization to the improvement in fruit quality because K promotes the transport of photoassimilates to storage organs such as fruits and participates in the formation and translocation of sugars (Senapati & Santra, 2009).
An increase in H. polyrhizus fruit size with potassium had already been verified by Then (2013). This author verified that potassium application promoted a higher number of fruits classified in category A, with a mass of approximately 450 g per fruit, similar to that observed in the present study, in which fruits of greater mass were observed in plants fertilized with 200 g of K2O. Size is an important
characteristic in the market because the largest fruits garner the best prices.
Plants well supplied with K experience an increase in K in their tissues and consequently a reduction in water potential, favoring a greater accumulation of water and an increase in fruit mass (Montoya, Spinoia, Garcia, & Paredes, 2002).
Although the results observed in the last two cycles show linear responses, the species does not respond indefinitely to an increase in potassium fertilization. The responses are dependent on an internal balance of nutrients, which also involves physiological processes of incorporation (Marodin et al., 2010).
Regarding the chemical characteristics of the fruits, the observed differences indicate that each species shows intrinsic properties and the ability to synthesize different organic compounds since the pitaya species were submitted to the same management practices and presented different results in relation to the soluble solids and titratable acidity (Table 2).
These differences observed in soluble solids and acidity between the fruits of H. polyrhizus and H. undatus may be attributed to their genetic characteristics, which may be influenced by fertilization as well as the soil temperature and humidity in irrigated orchards or rainfall during fruit harvest (Figure 1).
observed were superior to H. undatus fertilized with different organic sources, which showed fruits with soluble solids from 11.87 to 12.95°Bx (Moreira et al., 2011), and to fruits harvested in commercial orchards in Nicaragua, with soluble solids from 7 to 11°Bx (Vaillant, Perez, Davila, Dornier, & Reynes, 2005).
It can be noticed that high levels of soluble solids improve fruit flavor, making them more attractive to consumers, who consider pitaya fruit as mild-tasting due to the low concentration of sugars and acidity (Cordeiro, Silva, Mizobutsi, Mizobutsi, & Mota, 2015).
Potassium fertilization did not directly influence the chemical characteristics of fruits, possibly due to the adequate nutrient content in the plants at all fertilization levels. Therefore, it is important to apply fertilization with this element in a balanced way because this nutrient can be lost by leaching. Moreover, excessive application may inhibit absorption due to competition in soil with other nutrients, such as calcium and magnesium (Andreotti, Rodrigues, Crusciol, Souza, & Büll, 2001). Another important point to be taken into consideration is that excess application contributes to higher production costs, thus reducing profit.
As for the increasing of K levels observed in cladodes due to the application of K2O (Figure 4),
these can be explained by the so-called “luxury consumption” element, which occurs when a nutrient that is available in abundance is often absorbed by plants in quantities that are higher than necessary.
The linear increase in K levels available in the soil was expected because this element was used in increasing quantities with the fertilizations (Figure 5), similar to the results obtained by Almeida, Corrêa, Crisostomo, Araújo, and Silva (2014).
These results demonstrate the need to carry out potassium fertilization, which favors an increase in K levels in the dry matter of plants and also promotes higher production and an improvement in fruit quality.
Conclusion
Potassium fertilization increased production and provided a better quality of pitaya fruits.
K2O fertilization should be from 106.0 to 133.3 g
K2O in the first year and 200 g K2O in the second
and third years after planting.
References
Almeida, E. I. B., Corrêa, M. C. M., Crisostomo, L. A., Araújo, N. A., & Silva, J. C. V. (2014). Nitrogênio e potássio no crescimento de mudas de pitaia [Hylocereus
undatus (Haw.) Britton & Rose]. Revista Brasileira de
Fruticultura, 36(4), 1018-1027. doi:
10.1590/0100-2945-296/13.
Andreotti, M., Rodrigues, J. D., Crusciol, C. A. C., Souza, E. C. A., & Büll, L. T. (2001). Crescimento do milho em função da saturação por bases e da adubação potássica. Scientia Agricola, 58(1), 145-150. doi: 10.1590/S0103-90162001000100022
Bastos, D. C., Pio, R., Scarpare Filho, J. A., Libardi, M. N., Almeida, L. F. P., Galuchi, T. P. D., & Bakker, S. T. (2006). Propagação de pitaia vermelha por estaquia.
Ciência e Agrotecnologia, 30(6), 1106-1109. doi:
10.1590/S1413-70542006000600009
Cavalcante, I. H. L., Martins, A. B. G., Silva Júnior, G. B., Rocha, L. F., Falcão Neto, R., & Cavalcante, L. F. (2011). Adubação orgânica e intensidade luminosa no crescimento e desenvolvimento inicial da pitaya em Bom Jesus-PI. Revista Brasileira de Fruticultura, 33(3), 970-983. doi: 10.1590/S0100-29452011005000086 Chakma, S. P., Harunor Rashid, A. S. M., Roy, S., &
Islam, M. (2014). Effect of NPK doses on the yield of dragon fruit (Hylocereus costaricensis [F. A. C. Weber] Britton & Rose) in Chittagong Hill Tracts.
American-Eurasian Journal of Agricultural & Environmental Sciences,
14(6), 521-526. doi: 10.5829/idosi.aejaes.2014.14.06. 12346
Cordeiro, M. H. M., Silva, J. M., Mizobutsi, G. P., Mizobutsi, E. H., & Mota, W. F. (2015).Caracterização física, química e nutricional da pitaia-rosa de polpa vermelha. Revista Brasileira de Fruticultura, 37(1), 20-26. doi:1 0.1590/0100-2945-046/14
Corrêa, M. C. M., Almeida, E. I. B., Marques, V. B., Vale, J. C., & Aquino, B. F. (2014). Crescimento inicial de pitaia em função de combinações de doses de fósforo-zinco. Revista Brasileira de Fruticultura, 36(1), 23-38. doi: 10.1590/0100-2945-297/13
Le Bellec, F., Vaillant, F., & Imbert, E. (2006). Pitahaya
(Hylocereus spp.): a new fruit crop, a market with a
future. Fruits, 61(4), 237-250. doi: 10.1051/fruits: 2006021
Marodin, J. C., Resende, J. T. V., Morales, R. G. F., Camargo, C. K., Camargo, L. K. P., & Pavinato, P. S. (2010). Qualidade físico-química de frutos de morangueiro em função da adubação potássica. Scientia
Agraria Paranaensis, 9(3), 50-57.
Marques, V. B., Moreira, R. A., Ramos, J. D., Araújo, N. A., & Silva, F. O. R. (2011). Fenologia reprodutiva de pitaia vermelha no município de Lavras, MG. Ciência
Rural, 41(6), 984-987. doi:
10.1590/S0103-84782011005000071
Marques, V. B., Ramos, J. D., Araújo, N. A., & Moreira, R. A. (2012). Custo de produção e rentabilidade na cultura da pitaia sob o efeito de adubação orgânica.
Científica, 40(2), 138-149. doi:
10.15361/1984-5529.2012v40n2p138+-+149
Meurer, E. J. (2006). Nutrição Mineral das Plantas. Viçosa, MG: Sociedade Brasileira de Ciência do Solo.
K fertilization for pitayas Page 9 of 9
Moreira, R. A., Ramos, J. D., Araújo, N. A., & Marques, V. B. (2011). Produção e qualidade de frutos de pitaia-vermelha com adubação orgânica e granulado bioclástico. Revista Brasileira de Fruticultura, 33(1), 762-766. doi: 10.1590/S0100-29452011000500106
Nerd, A., Tel-Zur, N., & Mizrahi, Y. (2002). Fruits of vine and columnar cacti. In P. S. Nobel (Ed.), Cacti:
biology and uses (p. 185- 197). Berkeley, US: University
of California Press. doi: 10.1525/california/ 9780520231573.003.0011
Senapati, H. K., & Santra, G. H. (2009). Potassium management in vegetables, spices and fruit crops. Optimizing
crop production through judicious use of K. Bhubaneswar,
Orissa, India: Bijupattnaik Hall, OUAT
Souza, F. B. M., Pio, R., Coelho, V. A. T., Rodas, C. L., & Silva, I. P. (2015). Sintomas visuais de deficiência de macronutrientes, boro e ferro e composição mineral
de amoreira-preta. Pesquisa Agropecuária Tropical, 45(2), 241-248.
Then, T. H. (2013). The effects of foliar fertilizers on the red pitaya (Hylocerus polyrhizus) fruit weight. Acta
Horticulturae, 984(25), 227-230. doi: 10.17660/
ActaHortic.2013.984.25
Vaillant, F., Perez, A., Davila, I., Dornier, M., & Reynes, M. (2005). Colorant and antioxidant properties of red pitahaya (Hylocereus sp.). Fruits, 60(1), 1-7. doi: 10.1051/ fruits:2005007
Received on February 8, 2017. Accepted on April 13, 2017.