Acta Scientiarum
http://www.uem.br/acta ISSN printed: 1806-2636 ISSN on-line: 1807-8672
Doi: 10.4025/actascianimsci.v39i3.32209
Supplementation of extract of
Lafoensia pacari
in the diet of semi
heavy laying hens
Janaina da Silva Moreira¹*, José Henrique Stringhini², Edemilson Cardoso da Conceição³, Emmanuel Arhnold², Raiana Almeida Noleto¹ and Fabyola Barros de Carvalho²
¹Programa de Pós-graduação em Zootecnia, Universidade Federal de Goiás, Av. Esperança, s/n, 74690-900, Campus Universitário/Samambaia, Goiânia, Goiás, Brazil. ²Departamento de Zootecnia, Universidade Federal de Goiás, Goiânia, Goiás, Brazil. ³Faculdade de Farmácia,
Universidade Federal de Goiás, Goiânia, Goiás, Brazil. *Author for correspondence. E-mail: janainasm17@gmail.com
ABSTRACT. It was intended to evaluate the supplementation of Lafoensia pacari standardized in tannins extract in the diet of laying hens on the performance, internal and external quality of eggs and metabolism of the feed nutrients. A total of 168 Isa Brown laying hens, aged 24 weeks, with the mean weight of 2.6 kg and the mean posture rate of 87% were used during 4 periods of 28 days each. The treatments consisted of Halquinol performance-enhancing antibiotic, Mannanoligosaccharide (MOS) prebiotic and three levels of
pacari extract – 1,000, 2,000 and 3,000 mg kg-1of feed. The experimental design was completely
randomized, with six treatments and seven replicates of four hens each. The pacari standardized in tannin extract presented a percentage of albumen and an egg weight similar to the antibiotic (p < 0.04). The supplementation with the extract improved the shell quality, verified by the specific gravity (p < 0.03) and promoted the metabolizability of ether extract similar to antibiotic and MOS (p < 0.04), allowing its indication as a phytogenic additive.
Keywords: egg production, metabolism, performance, phytogenic additive.
Suplementação de extrato de
Lafoensia pacari
na ração de poedeiras semipesadas
RESUMO. Objetivou-se avaliar a suplementação do extrato de Lafoensia pacari padronizado em taninos na ração de poedeiras sobre o desempenho, a qualidade interna e externa de ovos e metabolizabilidade dos nutrientes da ração. Utilizaram-se 168 poedeiras Isa Brown com 24 semanas de idade, peso médio 2,6 kg e taxa de postura média 87% durante quatro períodos de 28 dias cada. Os tratamentos constituíram de rações com antibiótico melhorador de desempenho Halquinol, prebiótico Mananoligossacarídeo (MOS) e três
níveis de extrato de pacari – 1.000, 2.000 e 3.000 mg kg-1 de ração. O delineamento experimental foi
inteiramente casualizado com seis tratamentos e sete repetições com quatro aves cada. O extrato de pacari padronizado em teor de taninos apresentou porcentagem de albúmen e peso do ovo semelhante ao antibiótico (p < 0,04). A suplementação com o extrato melhorou a qualidade da casca, verificada pela gravidade específica (p < 0,03) e promoveu metabolizabilidade do extrato etéreo semelhante ao antibiótico e MOS (p < 0,04), sendo indicado como aditivo fitogênico.
Palavras-chave: aditivo fitogênico, produção de ovos, desempenho, metabolismo.
Introduction
The inclusion of performance-enhancing antibiotics (PEA) in animal feed is an important factor in the aviaryposture production, although its probable induction to bacterial resistance has influenced the restriction of their use. Thus, in order to replace the PEA, it has been investigated alternative enhancing promoters that can maintain or improve productive indexes, being innocuous and economically feasible (Dibner & Richards, 2005).
Phytogenic additives are included in animal feed as extracts or oils. Currently, they have been studied as performance enhancers because they present uses such as the reduction of the growth of pathogenic
microorganisms, and they stimulate the production of digestive secretions and antioxidant action (Windisch, Schedle, Plitzner, & Kroismayr, 2007).
tannin is responsible for most of the properties of the pacari extract (Silva et al., 2012).
The ethanolic extract of pacari leaf and stem is effective against Staphylococcus aureus, and this antibiotic property is related to the presence of anthraquinones, flavonoids, and tannins (Lima et al., 2006). In a study by Silva Júnior et al. (2010) it was reported that the ethanolic extract of Lafoensia pacari
and ellagic acid present activity against Candida and
Saccharomyces cerevisiae, and the ellagic acid can be considered the main antifungal substance in the extract, because of its direct action on the physical integrity of the fungal cell wall.
Thus, derivatives of Lafoensia pacari may be presented as a possible alternative to PEA included in poultry diets. This study was carried out with the purpose of evaluating the effects of feed supplemented with standardized pacari extract in tannin content on performance, internal and external egg quality and nutrient digestibility of commercial laying hens.
Material and methods
This study was previously approved by the Animal Ethics Committee (CEUA) PRPPG / UFG, filed under no. 075/12 and conducted in the facilities
of the Poultry Sector of the Escola de Veterinária e Zootecnia of the Universidade Federal de Goiás.
A total of 168 Isa Brown laying hens of 24 weeks old were used, with mean weight of 2.6 kg and mean posture rate of 87%. The hens were housed in galvanized wire cages of dimensions 25x40x45 cm, equipped with linear feeder and nipple type drinking fountain. The experiment lasted for four periods of 28 days.
The experimental design was completely randomized, with six treatments and seven replicates of four laying hens each, and consisted of: (T1) control feedwith antibiotic performance improver Halquinol, (T2) control feed with MOS prebiotic, (T3) control feed without additives, (T4) control feed with 1,000 mg kg-1 of pacariextract (T5) control feed with 2,000
mg kg-1 of pacari extract and (T6) control feed with
3,000 mg kg-1 of pacari extract.
The hens received water and feed at will, with feeders being filled three times a day. The light program was of 17h according to recommendations of the lineage manual and itwas controlled by automatic clock.
The dry extract of pacari standardized by the tannin content was measured by a method validated by high performance liquid chromatography, with 4.52% of total tannins. The treatments had 45.2, 90.4 mg kg-1 and 135.6 mg kg-1 of total tanninsof the
feeding, in addition to the general content of 1.98% of ellagic tannin.
The basal feed (Table 1) was iso-nutritive and formulated according to the recommendations of Rostagno et al. (2011). The inclusion of halquinol, MOS and the extract of pacari were carried out in substitution of the starch, being the extract the first one to be added to the micro-ingredients and later, to the other ingredients in the mixer.
In the zootechnical performance it was evaluated thefeed consumption, obtained by the difference between the amount of feed supplied and the remnant in the week, the egg yield, obtained by the quantity of eggs produced in the period, in relation to 100%;the egg mass, obtained by the average egg weight multiplied by the total quantity of eggs produced during the period; the weight of the egg, obtained by the average egg weight in relation to the quantity produced in the period; the feed conversion (kg kg-1),
calculated by the feed consumption and the relation with the mass of eggs produced in the period; and the feed conversion (kg dz-1) was calculated by the feed
consumption and the relation with the quantity of dozens of eggs produced in the period.
In the evaluation of the internal and external quality of the eggs, during the last four days of each period, four eggs were used per plot, in which one egg was destined only to the specific gravity and the others to the evaluation of egg weight (g); albumin heights (mm) and yolk (mm), used in the calculation of the Haugh unit and the yolk index; percentages of yolk and albumen (%); and thickness (mm) and percentage of eggshell (%).
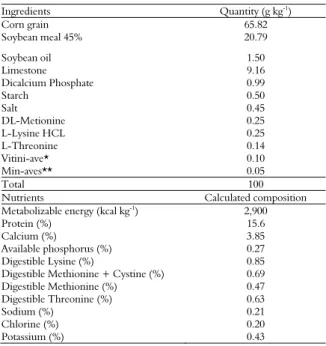
Table 1. Composition and calculated nutritional value of the basal feed.
Ingredients Quantity (g kg-1)
Corn grain 65.82
Soybean meal 45% 20.79
Soybean oil 1.50
Limestone 9.16
Dicalcium Phosphate 0.99
Starch 0.50 Salt 0.45 DL-Metionine 0.25
L-Lysine HCL 0.25
L-Threonine 0.14 Vitini-ave* 0.10 Min-aves** 0.05 Total 100
Nutrients Calculated composition
Metabolizable energy (kcal kg-1) 2,900
Protein (%) 15.6
Calcium (%) 3.85
Available phosphorus (%) 0.27
Digestible Lysine (%) 0.85
Digestible Methionine + Cystine (%) 0.69
Digestible Methionine (%) 0.47
Digestible Threonine (%) 0.63
Sodium (%) 0.21
Chlorine (%) 0.20
Potassium (%) 0.43
Natural additive in diets for hens 283
At the end of the experiment, in the 41st week of
age of the hens, a metabolic assay was performed for four days, using three replicates with two laying hens for each treatment. The excreta were collected twice a day (morning and afternoon) and stored in identified plastic bags, weighed and frozen for later analysis. The eggs were collected, identified and stored under refrigerated (4ºC) for analysis.
Samples of feeding, eggs and excreta were analyzed for dry matter, nitrogen and ethereal extract (Silva & Queiroz, 2002) in the Laboratory of Animal Nutrition of the Escola de Veterinária e Zootecnia/UFG, (and later, the nutrient metabolizability coefficients were calculated) (Sakomura & Rostagno, 2007 ).
The data were submitted to variance analysis and regression analysis for the controlled treatment and the levels of standardized pacari extract in tannin content were determinated with the aid of the Statistical Analysis System (SAS, 2004), and the means of the
treatments were compared between each other by the Test of Duncan at the 5% level of significance.
Results and discussion
No regression effect was observed according to the supplementation of pacari extract in performance (p > 0.09), egg quality (p > 0.08) and nutrient digestibility of feed (p > 0.10). In Table 2, it is verified that no influence of the extract was observed in the first and second experimental periods.
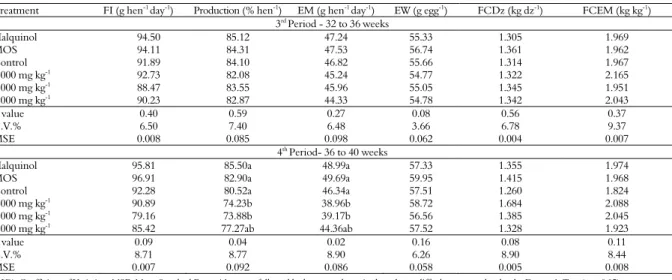
In the fourth experimental period, the production (p < 0.04) and the mass of eggs produced (p < 0.02) were influenced (Table 3). Laying hens fed with halquinol and MOS supplemented feed showed higher egg production and mass in relation to the laying hens that consumed the feed supplemented with 1.000 and 2.000 mg kg-1 extract.
Table 2. Feed intake (FI), egg production (Production), egg mass (EM), egg weight (EW), feed conversion by dozen (FCDz) and by egg mass (FCEM) of laying hens of 24 to 32 weeks old, fed with ration supplemented with pacari extract.
Treatment FI (g hen-1 day-1) Production (% hen-1) EM (g hen-1 day-1) EW (g egg-1) FCDz (kg dz-1) FCEM (kg kg-1)
1st Period - 24 to 28 weeks
Halquinol 94.05 86.71 47.05 53.81 1.329 1.958
MOS 95.76 88.03 47.21 55.96 1.314 1.950
Control 93.36 87.54 46.14 54.18 1.262 1.942
1.000 mg kg-1
95.30 85.11 45.49 54.04 1.302 1.892
2.000 mg kg-1 94.73 87.37 47.36 54.01 1.293 1.901
3.000 mg kg-1
94.03 86.17 45.19 54.15 1.357 1.906
P value 0.90 0.64 0.41 0.44 0.35 0.20
C.V.% 6.34 5.82 6.21 3.92 5.10 5.79
MSE 0.007 0.082 0.089 0.065 0.005 0.006
2nd Period - 28 to 32 weeks
Halquinol 95.01 90.52 50.92 56.31 1.298 1.922
MOS 94.08 90.18 51.37 58.07 1.258 1.808
Control 93.03 91.83 50.11 55.58 1.203 1.803
1.000 mg kg-1 93.17 89.35 50.08 54.39 1.316 1.842
2.000 mg kg-1 95.31 92.73 51.30 56.36 1.251 1.852
3.000 mg kg-1
92.67 89.16 49.53 55.59 1.251 1.875
P value 0.88 0.75 0.50 0.11 0.63 0.35
C.V.% 6.74 6.40 6.76 4.18 7.08 6.88
MSE 0.006 0.079 0.094 0.059 0.003 0.005
C.V%: Coefficient of Variation. MSE: Mean Standard Error.
Table 3. Feed intake (FI), egg production (Production), egg mass (EM), egg weight (EW), feed conversion by dozen (FCDz) and by egg mass (FCEM) of laying hens of 32 to 40 weeks old, fed with ration supplemented with pacari extract.
Treatment FI (g hen-1 day-1) Production (% hen-1) EM (g hen-1 day-1) EW (g egg-1) FCDz (kg dz-1) FCEM (kg kg-1)
3rd Period - 32 to 36 weeks
Halquinol 94.50 85.12 47.24 55.33 1.305 1.969
MOS 94.11 84.31 47.53 56.74 1.361 1.962
Control 91.89 84.10 46.82 55.66 1.314 1.967
1.000 mg kg-1 92.73 82.08 45.24 54.77 1.322 2.165
2.000 mg kg-1
88.47 83.55 45.96 55.05 1.345 1.951
3.000 mg kg-1 90.23 82.87 44.33 54.78 1.342 2.043
P value 0.40 0.59 0.27 0.08 0.56 0.37
C.V.% 6.50 7.40 6.48 3.66 6.78 9.37
MSE 0.008 0.085 0.098 0.062 0.004 0.007
4th Period- 36 to 40 weeks
Halquinol 95.81 85.50a 48.99a 57.33 1.355 1.974
MOS 96.91 82.90a 49.69a 59.95 1.415 1.968
Control 92.28 80.52a 46.34a 57.51 1.260 1.824
1.000 mg kg-1 90.89 74.23b 38.96b 58.72 1.684 2.088
2.000 mg kg-1 79.16 73.88b 39.17b 56.56 1.385 2.045
3.000 mg kg-1 85.42 77.27ab 44.36ab 57.52 1.328 1.923
P value 0.09 0.04 0.02 0.16 0.08 0.11
C.V.% 8.71 8.77 8.90 6.26 8.90 8.44
MSE 0.007 0.092 0.086 0.058 0.005 0.008
The complexing ability of the tannins with the protein, insolubilizing it and inactivating digestive enzymes, may have reduced egg production and egg mass, although the increase in extract supplementation has improved these characteristics.
In this sense, Imik et al. (2006) replaced corn by low tannin sorghum at a rate of 22%, but did not present tannin content, supplemented the feed with amino acid for laying hens, and verified no change in production, just an increase in feed intake in 5.7% and egg weight in 2.4%.
Jacob, Mitaru, Mbugua, and Blair (1996) also provided high tannin sorghum feed for laying hens at the rate of 64.7% in the diet and although they did not mention total tannin content, they had a better feed conversion, but lower egg production in relation to the corn formulated diet, evidencing that the tannin affected the productive characteristics of the laying hens.
During the total production period, no change in feed intake (p > 0.37), egg production (p > 0.24), egg mass (p > 0.08), egg weight (p > 0.11)
feed conversion per dozen (p > 0.18) and egg mass (p > 0.10) were observed, so there was no cumulative effect of experimental treatments (Table 4).
The tannin content present in the feed of laying hens may affect the laying rate, especially if the ingredient used presentslower energy content (Moreno, Espíndola, Santos, Freitas, & Gadelha, 2007). Tannin contents below 0.5% did not impair the performance of the hens (Jacob et al., 1996), which possibly kept the total performance unchanged, since the addition of the pacari extract increased the tannin content in the feed between 0.005 and 0.014%.
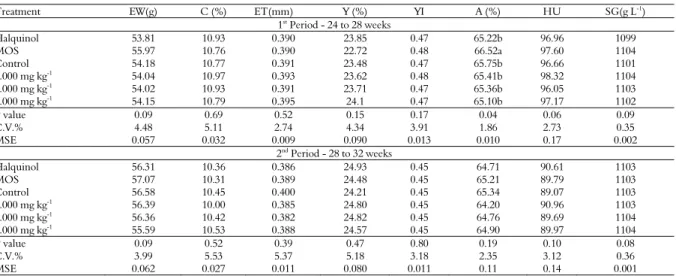
In relation to the internal and external quality of the eggs, no effect of the treatments was observed on egg weight, shell percentage, shell thickness, yolk percentage, yolk index, haugh unit and egg specific gravity (Table 5). However, during the first period the percentage of albumen was higher (p < 0.04) for the eggs of the hens that consumed the feed supplemented with MOS.
Table 4. Feed consumption (FC), egg production (Production), egg mass (EM), egg weight (EW), feed conversion by dozen (FCDz) and by egg mass (FCEM) of laying hens fed with ration supplemented with pacari extract in the total period.
Treatment FC (g hen-1
day-1
) Production (%/hen) EM (g hen-1
day-1
) EW (g egg-1
) FCDz (kg dz-1)
FCEM (kg kg-1)
Halquinol 95.02 86.96 48.55 55.69 1.322 1.980
MOS 95.10 86.35 48.95 57.93 1.336 1.923
Control 90.56 85.99 47.35 55.73 1.360 1.983
1.000 mg kg-1 93.02 82.69 44.94 55.47 1.356 2.084
2.000 mg kg-1 89.41 84.38 45.94 55.49 1.304 1.962
3.000 mg kg-1
90.58 83.87 45.85 55.50 1.319 1.982
P value 0.37 0.24 0.08 0.11 0.18 0.10
C.V.% 6.67 8.48 7.87 3.29 7.27 7.79
MSE 0.009 0.077 0.090 0.052 0.005 0.006
C.V%: Coefficient of Variation. MSE: Mean Standard Error.
Table 5. Egg weight (EW), percentage (C) and eggshell thickness (ET), percentage (Y) and yolk index (YI), albume percentage (A), haugh unit (HU) and specific gravity (SG) of eggs of laying hens of 24 to 32 weeks old fed with ration supplemented with pacari extract
Treatment EW(g) C (%) ET(mm) Y (%) YI A (%) HU SG(g L-1)
1st Period - 24 to 28 weeks
Halquinol 53.81 10.93 0.390 23.85 0.47 65.22b 96.96 1099
MOS 55.97 10.76 0.390 22.72 0.48 66.52a 97.60 1104
Control 54.18 10.77 0.391 23.48 0.47 65.75b 96.66 1101
1.000 mg kg-1 54.04 10.97 0.393 23.62 0.48 65.41b 98.32 1104
2.000 mg kg-1 54.02 10.93 0.391 23.71 0.47 65.36b 96.05 1103
3.000 mg kg-1
54.15 10.79 0.395 24.1 0.47 65.10b 97.17 1102
P value 0.09 0.69 0.52 0.15 0.17 0.04 0.06 0.09
C.V.% 4.48 5.11 2.74 4.34 3.91 1.86 2.73 0.35
MSE 0.057 0.032 0.009 0.090 0.013 0.010 0.17 0.002
2nd
Period - 28 to 32 weeks
Halquinol 56.31 10.36 0.386 24.93 0.45 64.71 90.61 1103
MOS 57.07 10.31 0.389 24.48 0.45 65.21 89.79 1103
Control 56.58 10.45 0.400 24.21 0.45 65.34 89.07 1103
1.000 mg kg-1
56.39 10.00 0.385 24.80 0.45 64.20 90.96 1103
2.000 mg kg-1 56.36 10.42 0.382 24.82 0.45 64.76 89.69 1104
3.000 mg kg-1 55.59 10.53 0.388 24.57 0.45 64.90 89.97 1104
P value 0.09 0.52 0.39 0.47 0.80 0.19 0.10 0.08
C.V.% 3.99 5.53 5.37 5.18 3.18 2.35 3.12 0.36
MSE 0.062 0.027 0.011 0.080 0.011 0.11 0.14 0.001
Natural additive in diets for hens 285
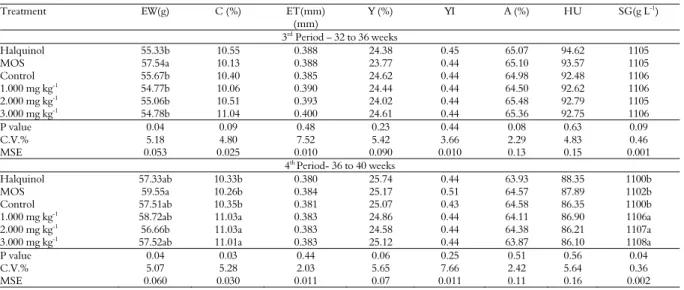
As observed in Table 6, in the third period, the diet added with MOS promoted a higher egg weight (p < 0.04) in relation to the other treatments, and feeds supplemented with extract of pacari and halquinol presented similar results.
In the fourth period, feeds supplemented with MOS, halquinol and 1,000 mg kg-1 and 3,000 mg kg -1 of extract promoted a similar result for egg weight
(p < 0.04), and hens fed with pacari extract feed presented a better percentage of shell (p < 0.03) and specific gravity (p < 0.04) (Table 6), although Haslam (1996) points out that there is a relationship between the tannins and the reduction of egg shell weight, due to the complexation and unavailability of metallic ions, such as calcium.
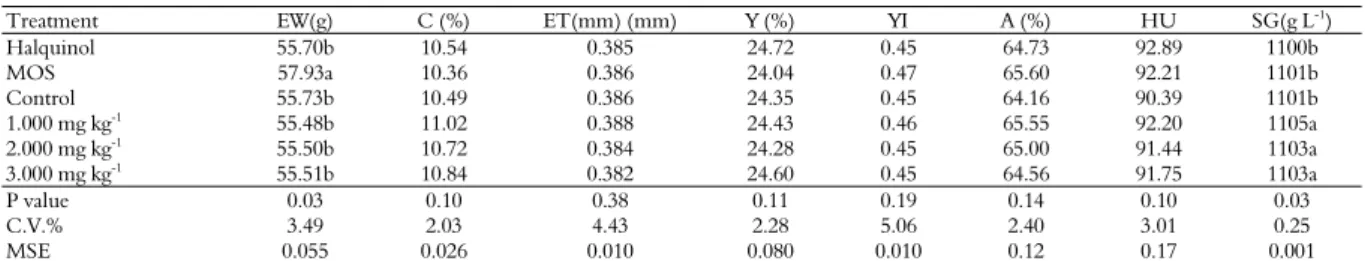
Data for the total egg production period are given in Table 7. As in the fourth period, the pacari extract promoted a better result for the specific gravity (p < 0.03), in other words, better shell resistance, as reported by Roberts (2004), a factor that directly influences the loss of eggs by the occurrence of cracks.
Imik et al. (2006) evaluated the internal and external egg quality of laying hens fed with corn and low tannin sorghum, supplemented with amino acids, and found that replacing corn by sorghum increased the yolk index, without affecting shell thickness, albumen thickness and haugh unit. However, in the present study, none of these variables was influenced by the extract.
The inclusion levels of the pacari extract promoted a digestibility coefficient of the ethereal extract similar to halquinol and MOS (p < 0.04), possibly due to antimicrobial properties, attributed
to the tannins present in the pacari extract, allowing a better use of the nutrients (Haslam, 1996, Hernandes, Pereira, Palazzo, & Mello, 2010). No regression effect was observed as a function of the levels of pacari extract for the studied variables (Table 8).
In a study to evaluate the effects of tannins from barbatimão (Stryphnodendronsp) extract on the digestibility of nutrients in diets for Nile tilapia at levels 0; 0.23; 0.46; 0.69; 0.92; 1.3 and 1.82% of total tannins, it was verified that the tannin at concentrations equal to or greater than 0.46% in the diet reduced the digestibility of dry matter and crude protein, mainly digestibility of ethereal extract, from the concentrations of 0.23% of tannins (Pinto, Pezzato, Miranda, Baros, & Furuya, 2004).
The tannins inhibiting the growth of certain microorganisms among them Staphylococcus aureus,
Streptococcus pneumonia and Bacillusanthracis
(Monteiro, Albuquerque, Araújo, & Amorim, 2005),besides stimulating the production of saliva and gastric and pancreatic juice, increasing the digestibility of nutrients (Platel & Srinivasan, 1996), and consequently reducing the presence of substrate necessary to the development of undesirable microorganisms, resulting in improved animal performance.
Although the results observed by Pinto et al. (2004) are different from those found in the present study, they cannot be accurately related to the present research, even if tannin is the major active ingredient of the extracts used, because both vegetal extract and the animals studied are different, making it difficult to clarify the results.
Table 6. Egg weight (EW), percentage (C) and eggshell thickness (ET), percentage (Y) and yolk index (YI), albume percentage (A), haugh unit (HU) and specific gravity (SG) of eggs of laying hens of 32 to 40 weeks old fed with ration supplemented with pacari extract.
Treatment EW(g) C (%) ET(mm)
(mm)
Y (%) YI A (%) HU SG(g L-1
)
3rd
Period – 32 to 36 weeks
Halquinol 55.33b 10.55 0.388 24.38 0.45 65.07 94.62 1105
MOS 57.54a 10.13 0.388 23.77 0.44 65.10 93.57 1105
Control 55.67b 10.40 0.385 24.62 0.44 64.98 92.48 1106
1.000 mg kg-1
54.77b 10.06 0.390 24.44 0.44 64.50 92.62 1106
2.000 mg kg-1 55.06b 10.51 0.393 24.02 0.44 65.48 92.79 1105
3.000 mg kg-1 54.78b 11.04 0.400 24.61 0.44 65.36 92.75 1106
P value 0.04 0.09 0.48 0.23 0.44 0.08 0.63 0.09
C.V.% 5.18 4.80 7.52 5.42 3.66 2.29 4.83 0.46
MSE 0.053 0.025 0.010 0.090 0.010 0.13 0.15 0.001
4th Period- 36 to 40 weeks
Halquinol 57.33ab 10.33b 0.380 25.74 0.44 63.93 88.35 1100b
MOS 59.55a 10.26b 0.384 25.17 0.51 64.57 87.89 1102b
Control 57.51ab 10.35b 0.381 25.07 0.43 64.58 86.35 1100b
1.000 mg kg-1 58.72ab 11.03a 0.383 24.86 0.44 64.11 86.90 1106a
2.000 mg kg-1
56.66b 11.03a 0.383 24.58 0.44 64.38 86.21 1107a
3.000 mg kg-1 57.52ab 11.01a 0.383 25.12 0.44 63.87 86.10 1108a
P value 0.04 0.03 0.44 0.06 0.25 0.51 0.56 0.04
C.V.% 5.07 5.28 2.03 5.65 7.66 2.42 5.64 0.36
MSE 0.060 0.030 0.011 0.07 0.011 0.11 0.16 0.002
Table 7. Egg weight (EW), percentage (C) and eggshell thickness (ET), percentage (Y) and yolk index (YI), albume percentage (A), haugh unit (HU) and specific gravity (SG) of eggs of laying hens fed with ration supplemented with pacari extract, in the total period
Treatment EW(g) C (%) ET(mm) (mm) Y (%) YI A (%) HU SG(g L-1
)
Halquinol 55.70b 10.54 0.385 24.72 0.45 64.73 92.89 1100b
MOS 57.93a 10.36 0.386 24.04 0.47 65.60 92.21 1101b
Control 55.73b 10.49 0.386 24.35 0.45 64.16 90.39 1101b
1.000 mg kg-1 55.48b 11.02 0.388 24.43 0.46 65.55 92.20 1105a
2.000 mg kg-1
55.50b 10.72 0.384 24.28 0.45 65.00 91.44 1103a
3.000 mg kg-1 55.51b 10.84 0.382 24.60 0.45 64.56 91.75 1103a
P value 0.03 0.10 0.38 0.11 0.19 0.14 0.10 0.03
C.V.% 3.49 2.03 4.43 2.28 5.06 2.40 3.01 0.25
MSE 0.055 0.026 0.010 0.080 0.010 0.12 0.17 0.001
C.V%: Coefficient of Variation. MSE: Mean Standard Error. *Averages followed by lowercase letter in the column differ between each other by Duncan’s Test (p < 0.05).
Table 8. Coefficient of metabolizability of dry matter (CMDM), of nitrogen (CMN), of egg’s nitrogen (N egg), nitrogen retention by egg mass (mg N ret g-1
egg), Coefficient of metabolizability of ether extract (CMEE), egg’s ether extract (EE egg) and retained ether extract by egg mass (mg EE ret g-1 egg), of the feed supplemented with pacari extract.
Treatment CMDM (%)
CMN (%)
N egg (g)
mg N ret g-1 egg CMEE
(%)
EE egg(g) mg EE ret g-1 egg
Halquinol 81.40 55.36 6.98 23.91 90.89ab 0.785 83.91
MOS 79.70 56.21 6.99 22.75 90.68ab 0.802 105.80
Control 79.16 53.55 6.21 27.23 89.57b 0.685 135.22
1.000 mg kg-1
75.95 35.57 9.70 12.25 93.74a 0.970 88.75
2.000 mg kg-1 76.59 40.38 7.13 17.17 94.31a 0.715 121.20
3.000 mg kg-1 78.27 48.14 6.16 17.39 93.97a 0.615 151.92
P value 0.60 0.10 0.31 0.40 0.04 0.46 0.11
C.V.% 5.16 19.97 27.15 44.81 2.08 6.56 26.75
MSE 0.21 0.34 0.17 0.14 0.12 0.18 0.19
C.V%: Coefficient of Variation. MSE: Mean Standard Error. *Averages followed by lowercase letter in the column differ between each other by Duncan’s Test (p < 0.05).
Conclusion
The standardized pacari extract content in tannin promoted a percentage of albumin and egg weight similar to the antibiotic. The extract improved the quality of the shell and promoted the metabolizability of the ethereal extract similar to the antibiotic and MOS, being indicated as a phytogenic additive.
References
Dibner, J. J., & Richards, J. D. (2005). Antibiotic growth promoters in agriculture: history and mode of action.
Poultry Science, 84(4), 634-643.
Haslam, E. (1996). Natural Polyphenols (Vegetable Tannins)
as Drugs: Possible Modes of Action. Journal of Natural
Products, Sheffield-United States, 59(2), 205-215.
Hernandes, L., Pereira, L. M. S., Palazzo, F., & Mello, J. C P. (2010).Wound-healing evolution of ointment from
Stryphnodendronadstringens (barbatimão) in rat skin.
Brazilian Journal of Pharmaceutical Science, 46(3), 431-437. Imik, H., Hayirli, A., Turgut, L., Lancin, E., Celebi, S.,
Koc, F., & Yildiz, L. (2006). Effects of additives on laying performance, metabolic profile, and egg quality
of hens fed a high level of sorghum (Sorghum vulgare)
during the peak laying period. Asian-australasian Journal
of Animal Sciences, 19(4), 573-581.
Jacob, J. P., Mitaru, B. N., Mbugua, P. N., & Blair, R.
(1996). The feeding value of Kenyan sorghum,
sunflower seed cake and sesame seed cake for broiler
and layers.Animal Feed Science and Technology, 61(1-4),
41-56.
Kaur, S., Grover, I. S., & Kumar, S. (1997). Antimutagenic
potential of ellagic acid isolated from Terminalia arjuna.
Indian Journal Experimental Biology, 35(5), 478-482. Lima, M. R. F., Luna, J. S., Santos, A. F., Andrade, M. C.
C., Sant’ana, A. E. G., Genet, J. P., & Moreau, N. (2006). Anti-bacterial activity of some Brazilian
medicinal plants.Journal of Ethnopharmacology, 105(1-2),
137-147.
Monteiro, J. M., Albuquerque, U. P., Araújo, E. L., & Amorim, E. L. C. (2005). Taninos: uma abordagem da
química à ecologia. Química Nova, 28(5), 892-896.
Moreno, J. O., Espíndola, G. B., Santos, M. S. V., Freitas, E. R., & Gadelha, A. C. (2007). Desempenho e qualidade dos ovos de poedeiras comerciais, alimentadas com dietas
contendo sorgo e páprica em substituição ao milho. Acta
Scientiarum. Animal Sciences, 29(2), 159-163.
Pinto, L. G. Q., Pezzato, L. E., Miranda, E. C., Baros, M. M., & Furuya, W. M. (2004). Efeito do tanino na digestibilidade dos nutrientes da ração pela tilápia do
Nilo, Oreochromis niloticus. Acta Scientiarum, 26(2), 181-186.
Platel, K., & Srinivasan, K. (1996). Influence of dietary spices or their active principles on digestive enzymes
of small intestinal mucosa in rats. International Journal
Food Sciences and Nutrition, 47(1), 55-59.
Porfírio, Z., Melo Filho, G. C., Alvino, V., Lima, M. R. F. L., & Sant'ana, A. E. G. (2009). Atividade
antimicrobiana de extratos hidroalcoólicos de Lafoensia
pacari A. St.-Hil., Lythraceae, frente a bactérias
multirresistentes de origem hospitalar. Revista Brasileira
de Farmacognosia, 19(3), 785-789
Roberts, J. R. (2004). Factors affecting egg internal quality
and egg shell quality in laying hens. Journal of Poultry
Natural additive in diets for hens 287
Rostagno, H. S., Albino, L. F. T., Donzele, J. L., Gomes, P. C., Oliveira, R. F., Lopes, D. C, ... Barreto, S. L. T.
(2011). Tabelas brasileiras para aves e suínos: composição de
alimentos e exigências nutricionais (3rd.). Viçosa, MG: UFV
Sakomura, N. K., & Rostagno, H. S. (2007). Métodos de
pesquisa em nutrição de monogástricos. Jaboticabal, SP: Funep.
Santos, L. W., Coelho, M. F.B., & Pirani, F. R. (2009).
Fenologia de Lafoensia pacari A. St.-Hil. (Lythraceae)
em Barra do Garças, Mato Grosso, Brasil. Revista
Brasileira de Plantas Medicinais, 11(1), 12-17.
Statistical Analysis System [SAS®]. (2004). User’s guide:
statistics. Cary, NC: SAS Institute.
Silva, D. J., & Queiroz, A. C. (2002). Análise de alimentos:
métodos químicos e biológicos (3rd ed.). Viçosa, MG: UFV. Silva Júnior, I. F., Raimondi, M., Zacchino, S., Cechinel
Filho, V., Noldin, V. F., Vietla, S., ...Martins, D. T. O. (2010). Evaluation of the antifungal activity and mode
of action of Lafoensia pacari A. St.-Hil., Lythraceae,
stem-bark extracts, fractions and ellagic acid. Revista
Brasileira de Farmacognosia, 20(3), 422-428.
Silva, S. M. F. Q., Pinheiro, S. M. B., Queiroz, M. V. F., Pranchevicius, M. C., Castro, J. G. D., Perim, M. C.,
& Carreiro, S. C. (2012). Atividade in vitro de extratos
brutos de duas espécies vegetais do Cerrado sobre
leveduras do gênero Cândida. Ciência & Saúde Coletiva,
17(6), 1649-1656.
Solon, S., Lopes, L., Sousa-Júnior, P. T., & Schmeda-Hirschmann, G. (2000). Free radical scavening activity
of Lafoensiapacari. Journal of Ethnopharmacology, 72(1),
173-178.
Windisch, W., Schedle, K., Plitzner, C., & Kroismayr, A. (2007).Use of phytogenic products as feed additives
for swine and poultry. Journal of Animal Science, 86(14
suppl), 140-148.
Received on June 8, 2016. Accepted on March 16, 2017