Full Terms & Conditions of access and use can be found at
http://www.tandfonline.com/action/journalInformation?journalCode=ceps20
European Planning Studies
ISSN: 0965-4313 (Print) 1469-5944 (Online) Journal homepage: http://www.tandfonline.com/loi/ceps20
What makes people stay in or leave shrinking
cities? An empirical study from Portugal
Maria Helena Guimarães, Luis Catela Nunes, Ana Paula Barreira & Thomas
Panagopoulos
To cite this article: Maria Helena Guimarães, Luis Catela Nunes, Ana Paula Barreira & Thomas Panagopoulos (2016) What makes people stay in or leave shrinking cities? An empirical study from Portugal, European Planning Studies, 24:9, 1684-1708, DOI: 10.1080/09654313.2016.1177492 To link to this article: https://doi.org/10.1080/09654313.2016.1177492
Published online: 30 Apr 2016.
Submit your article to this journal
Article views: 520
View Crossmark data
What makes people stay in or leave shrinking cities? An
empirical study from Portugal
Maria Helena Guimarãesa,b , Luis Catela Nunesc , Ana Paula Barreirab and Thomas Panagopoulosb
a
Landscape Dynamics and Social Processes Group, Instituto de Ciências Agrárias e Ambientais Mediterrânicas (ICAAM), University of Évora, Évora, Portugal;bResearch Centre for Spatial and Organizational Dynamics (CIEO), University of Algarve, Faro, Portugal;cNova School of Business and Economics, Universidade Nova de Lisboa, Lisboa, Portugal
ABSTRACT
The attractiveness of cities as places to live determines population movements into or out of them. Understanding the appealing features is fundamental to local governments, particularly for cities facing population decline. Pull and push attributes can include economic aspects, the availability of amenities and psychological constructs, initiating a discussion around which factors are more relevant for migration. However, such discussion has been underexplored in studies of shrinking cities. In the present study, we contribute to the discussion by identifying pull and push factors in Portuguese shrinking cities. Data were collected using a face-to-face questionnaire of 701 residents in four shrinking cities: Oporto, Barreiro, Peso da Régua and Moura. Factor analysis and automatic linear modelling were used to analyse the data. Our results show that the economic activity is the most relevant feature for retaining residents. However, characteristics specific to each city, related to heritage and natural beauty, are also shown to influence a city’s attractiveness. The cause of population shrinkage was also found to influence residents’ assessments of the pull and push attributes of each city. Furthermore, the results show the relevance of social ties and of place attachment to inhabitants’ intention to continue living in their city of residence.
ARTICLE HISTORY
Received 1 April 2015 Revised 4 April 2016 Accepted 7 April 2016
KEYWORDS
Shrinking cities; policy and planning strategies; residents’ preferences; pull and push factors; Portugal
Introduction
The increasing degree of globalization has led to greater competition between urban areas and has intensified the less appealing characteristics of some cities compared with others (Martinez-Fernandez, Audirac, Fol, & Cunningham-Sabot, 2012). This observation has led researchers and managers to analyse the phenomenon of urban shrinkage (Hospers,
2014; Pallagst, Schwarz, Popper, & Hollander, 2009). Furthermore, the reduction in the fertility rate and the increase in the number of cities facing population decline has contri-buted to the rising interest in urban shrinkage (OECD,2003; Oswalt & Rieniets,2006). Despite the described trend, most of the research has focused on typifying the processes
© 2016 Informa UK Limited, trading as Taylor & Francis Group
CONTACT Maria Helena Guimarães [email protected] http://dx.doi.org/10.1080/09654313.2016.1177492
of urban shrinkage and its consequences (e.g. Hospers,2013; Martinez-Fernandez et al.,
2012), as well as defining policies to deal with the concomitant social problems (e.g.
Cortese, Haase, Grossmann, & Ticha, 2014; Hospers, 2013). As such, there are few studies that have specifically addressed the factors that influence whether residents remain in or leave a shrinking city. One of the few exceptions is the investigation of Reckien and Martinez-Fernandez (2011).
In the present study, we focus on factors that affect current residents’ decisions to stay in or leave a city and therefore that affect out-migration. We identify push factors related to characteristics of the city of residence that promote departure to another place outside the city and pull factors that induce people to stay. Although we study only residents currently residing in the city, some of the push and pull factors that we identify are also relevant in terms of attracting new people to the city. We do not consider factors directly affecting natural demographics (births and deaths), nor do we examine external factors at regional, national or international levels that lead to out- or in-migration.
There is also an ongoing discussion about the different types of pull and push factors that make individuals choose to stay in or to move out of a certain place. The discussion includes economically driven perspectives (Hoekveld,2012) and the availability or lack of amenities (Brunner, Cho, & Reback,2012; Andersen & van Kempen,2003; Royuela, Moreno, & Vaya,
2010). Beyond these tangible drivers, some authors have described psychological factors such as place attachment or social networks as reasons that deter inhabitants from moving out (Brown, Perkins, & Brown,2003; Coulton, Theodos, & Turner,2012).
In this study, we aim to contribute to the discussion outlined above by presenting an empirical study of pull and push factors in four shrinking cities in Portugal. On this basis, we identify and discuss the main drivers influencing whether residents stay in or leave cities within the specific context of urban shrinkage.
Literature review
Urban shrinkage has become a reality for a growing number of countries, regions, muni-cipalities and cities (Oswalt & Rieniets,2006; Turok & Mykhnenko,2007). In Europe, the reasons for population decline are diverse, but the most common are related to the pro-cesses of suburbanization and deindustrialization, to which the political transformations occurring in Eastern European countries can be added (Haase, Bernt, Grobmann, Mykhnenko, & Rink, 2013). These processes have been aggravated by the decrease in the fertility rate, which has accentuated the ageing of the population (Hospers, 2013; Wiechmann & Pallagst, 2012). Despite the similarities in shrinkage experienced by various countries and regions, the phenomenon of shrinkage is sensitive to local contexts and to the spatial scale considered (Hoekveld,2014).
The identification of the pull and push attributes of cities is central to gauging their attractiveness (Cheshire & Magrini, 2006; Royuela et al., 2010). Within the context of shrinking cities, the only previous work on pull and push factors appears to be the study of Reckien and Martinez-Fernandez (2011), which focused on residents’ movements
from cities to the suburbs. The majority of studies assessing pull and push factors have been conceived for the contexts of deprived areas (Andersen,2002; Blasius & Friedrichs,
2007) or urban sprawl (Couch & Karecha,2006). Both of those contexts are fundamentally distinct from urban shrinkage, because deprived areas are associated with a low quality of
life and urban sprawl can also occur in growing cities (Pallagst et al.,2009), whereas urban shrinkage can be associated with improvements in the lifestyles of those who stay (Hollan-der,2011).
A related set of studies have examined a city’s attributes and how they affect inhabitants’ levels of residential satisfaction or urban quality of life with respect to decisions regarding where to live, although such studies have not explicitly framed these influences in terms of pull and push factors (Ballas,2013; Bonaiuto, Fornara, & Bonnes,2006; Mellander, Florida, & Stolarick,2011; Parkes, Kearns, & Atkinson,2002; Rioux & Werner,2011).
Regardless of the context, however, the migration patterns studied tend to be related to economic aspects, and in particular to employment as an attracting factor (International Organization for Migration,2011) or to unemployment as a factor that exacerbates popu-lation decline (Andersen & van Kempen,2003). Cities that are more economically active generate more job opportunities and are more appealing to the young adult population (Arnott & Chaves,2012; Lutz,2001). Such a conclusion is particularly relevant in shrin-kage environments, because if the younger generations tend to leave cities sooner com-pared with older inhabitants (Zimmermann, 2005), then this implies a perpetuation of the cycle of decline (Hoekveld,2012).
Despite these features of shrinkage environments, cities that are losing inhabitants may retain some appeal, as they offer an opportunity for better lifestyles (Pallagst et al.,2009). This idea is supported by the reported happiness and satisfaction of those who live in shrinking cities (Delken,2008; Hollander,2011). Bonaiuto et al. (2006) argue that a com-bination of spatial aspects (like aesthetics, accessibility and green areas), human aspects (including social relations) and functional aspects (such as welfare, and recreational, com-mercial and transportation facilities) can influence migration decisions by affecting the perceived environmental quality of urban areas. Amenities such as educational institutions (Brunner et al., 2012; Ferguson, Ali, Olfert, & Partridge, 2007), hospitals (Partridge, Bollman, Olfert, & Alasia, 2007; Portnov & Pearlmutter, 1999), transport accessibility (Garmendia, Urena, Ribalaygua, Leal, & Coronado, 2008; Royuela et al., 2010) as well as a city’s location (Portnov, 2004; Portnov & Pearlmutter, 1999) have been shown to be determinants of people’s decisions to stay in or leave a city. If the presence of certain types of amenities constitutes a way of bringing new inhabitants into the city, the existence of other amenities related to a lack of safety or to physical and/or social disorder consti-tutes a cause of individuals to move away (Blasius & Friedrichs,2007; Elo, Mykyta, Mar-golis, & Culhane, 2009). Climate has also been found to influence in- or out-migration
(Cheshire & Magrini,2006).
The effects of pull and push factors have also been examined by means of hedonic models (Chen & Jim, 2010; Waltert & Schaläpfer, 2010). In the hedonic modelling approach, the factors are designated as attributes and their impacts on housing prices and wages are examined by considering households in different locations (Bayer, Keohane, & Timmins, 2009; Powe, Garrod, & Willis, 1995). Attributes used in such studies include amenity and service characteristics such as those described previously and used in the present study.
Other studies have emphasized psychological aspects as factors discouraging inhabi-tants to leave a city (Grzeskowiak, Sirgy, & Widgery, 2003; Hidalgo & Hernandez,
2001). Place attachment (Brown et al.,2003; Hidalgo & Hernandez,2001), social networks (Coulton et al.,2012; Hospers, 2014) and loyalty to a place, which combines place and
social ties (van der Land & Doff,2010), have been presented as relevant factors. Of impor-tance is individuals’ pleasure or gratification connected with their place of residence (Bonaiuto, Fornara, & Bonnes, 2003), which renders a sense of residential satisfaction. Amérigo and Aragonés (1997) identified home ownership, time lived in the place, age,
the presence of relatives, safety, friendship and relations with neighbours, family type, noise and the physical appearance of places as factors influencing the level of residential satisfaction. A sense of pride about the place of residence also reduces the incentive to move out (Twigger-Ross & Uzzell,1996).
On the basis of the literature described above, we developed a list of possible pull and push factors relevant to shrinking cities (described in detail in the Methods section). The variables were rated by residents of four Portuguese cities in which population decline between 1991 and 2011 was observed. The following section describes these case study cities.
The case study cities
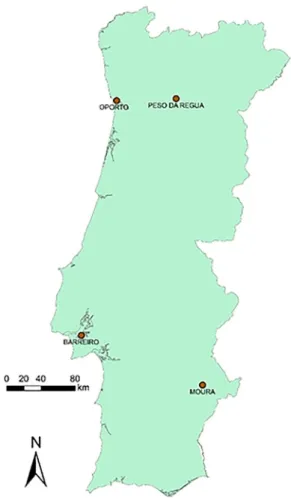
Portugal has 158 cities, of which 31 showed population loss between 1991 and 2011 (Gui-marães, Barreira, & Panagopoulos,2015). Such a phenomenon is a result of a multiplicity of causes that differ from city to city. Guimarães et al. (2015) developed a typology of shrinking cities in Portugal and from that study we selected the four case studies presented here: Oporto, Barreiro, Moura and Peso da Régua (Figure 1). After accounting for the effects of an ageing population and low fertility rates, the phenomena of suburbanization, economic transformation, environmental features and the satellite effect have been pro-posed to explain urban decline in Portugal (Guimarães et al.,2015).
Each city represents one type of shrinkage driver to ensure that each case study is as distinct as possible.Table 1provides contextual information for each city; a more detailed analysis can be found in the studies of Guimarães et al. (2015) and Alves, Barreira, Gui-marães, and Panagopoulos (2016).
The city of Oporto is the second most populous city in Portugal and is located in the north of the country. Oporto is well known for its wine and for its historical centre, which is classified as World Heritage by UNESCO. The shrinkage process of Oporto has been explained as relating mainly to suburbanization (Guimarães et al.,2015).Table 1shows that Oporto lost 21% of its population over the 20-year period from 1991 to 2011, while the corresponding population of the Metropolitan Area increased by 9%. Alves et al. (2016) showed that Oporto has shown consistent decline since the 1980s, when the city registered almost 330,000 inhabitants, and since then has been affected by subur-banization. Nevertheless, between 1991 and 2011 there was also a large increase in the unemployment rate, mostly in the secondary sector (Table 1). In the case of Oporto, this decline is partially explained by the fall-off in the construction sector, one of the sectors most affected by the financial crisis that impacted the country over the time frame of this study (Guimarães et al.,2015).
Barreiro, located on the southern bank of the Tejo River, shows the second-largest population loss in relative terms of the nation’s shrinking cities between 1991 and 2011 (Guimarães et al.,2015). Until 1950, the city’s industry was outstanding, with the oper-ation of railways and the chemical industry. The main cause for populoper-ation displacement has been linked to the abrupt closure of its industries and the city’s poorly diversified economy (Guimarães et al., 2015). Barreiro grew until the 1990s to reach a peak of
48,000 inhabitants, but has since been losing population (Alves et al.,2016).Table 1shows that between 1991 and 2011, more than half of the employment in the secondary sector (58%) disappeared, which in this case represents the decline of the industry supporting Barreiro’s economic development (Alves et al.,2016).
Moura is located in the interior of the country, in the Alentejo region, which is affected by desertification, heat waves and extensive drought periods that might become more severe as part of the predicted changes in global and regional climates (Guimarães et al.,
2015). Therefore, Moura is included in a shrinkage typology related to climatic drivers on top of other socio-economic conditions affecting the city’s population decline, including Moura’s large distance from major cities, which implies a lack of supporting public services (Guimarães et al.,2015). Moura reached a peak in the 1960s with 12,000 inhabitants; since then, it has been shrinking although it experienced a small recovery between 1991 and 2001 as a result of substantial public investment into the construction of the nearby Alqueva Dam (Alves et al., 2016). Moura is the warmest city of the four case studies (Table 1). Further, population decline between 1991 and 2011 affected only the population up to 24 years old (Table 1), which indicates an out-movement of young people looking else-where for better job opportunities and higher education opportunities.
Peso da Régua, located in the Douro region in the north of the country, has been iden-tified as a satellite city of a nearby growing urban centre, Vila Real. In Peso da Régua, population loss was registered only for residents up to 24 years old (Table 1), which rep-resents those citizens starting their adult life searching for higher education and/or their first job outside the city. Peso da Régua is an international capital of wine-making, with agriculture and tourism being the main economic activities (Guimarães et al., 2015). The city is located at 125 m altitude and is surrounded by rugged terrain, and is also part of a UNESCO world heritage site. Peso da Régua, like Oporto, has been declining in inhabitants since the 1980s (when it hosted 10,600 inhabitants) but at a much lower annual rate (Alves et al.,2016).
Methods
Data collection
The main goal of this study was to understand what makes residents of shrinking cities stay (the pull factors) and also the features that could eventually lead them to abandon their city (the push factors). To achieve this, a questionnaire was designed and adminis-tered by survey in each of the case study cities. In total, 701 questionnaires were gathered
Table 1.Contextual information about the case-study cities.
Indicator Oporto Barreiro
Peso da
Régua Moura Population in 2011 237,591 37,729 9959 8419
Change in population 1991–2011 (%) −64,881
(−21%) −10,172(−21%) −318 (−3%) −224(−3%) Change in population 1991–2011 by age group
0–24 −47,764 (−47%) −7616(−48%) −1488(−36%) −654(−21%) 25–64 −27,420 (−18%) −5741(−22%) 652 (13%) 121 (3%) 65+ 10,303 (23%) 3185 (51%) 518 (43%) 309 (22%)
% change in population in the corresponding municipality (1991–2011)
9%a −8% −20.7% −14.4% Unemployment rate in 2011b 18% 16% 15% 17%
Change in employed population from 1991 to 2011 (n° and %) −45,231 (−51%) −5224 (−27%) −200 (−5%) −81 (−3%) Primary sector −162 (−67%) −68 (−76%) 18 (9%) −289 (−45%) Secondary sector −26,464 (−204%) −3315 (−58%) 184 (26%) −117 (−16%) Tertiary sector −18,605 (−25%) −1841 (−14%) −402 (−13%) 325 (18%)
Average warm temperature (°C)c 19 25 21 29 Data sources: Statistics Institute of Portugal andhttp://pt.climate-data.org.
aConsiders the Metropolitan Area of Oporto. b
The national unemployment rate on average in 2011 was 13%.
cValues for the temperature of each city were obtained by averaging the values registered in each of the 12 months of the
year. The national average temperature is 20°C and was obtained by averaging the temperatures of the 158 Portuguese cities.
by face-to-face survey in July 2014: 180 in Oporto, 179 in Barreiro and 171 in both Peso da Régua and Moura. The number of questionnaires was calculated using a random stratified sampling method based on the 2011 populationfigures for each city (data from the 2011 National Census). The sample size was sufficient to ensure a maximum margin of error of 7.45% for a 95% confidence interval on the population proportion. Each city subsample was stratified1
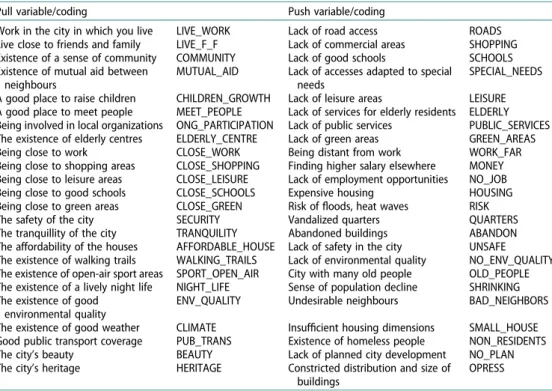
according to the typology of households in the city and parishes. A pilot survey was conducted prior to the main survey to test the accuracy of the questionnaire. The questionnaires included 24 pull and 24 push variables (Table 2) that respondents rated with respect to the degree of influence that each variable had on their willingness to live in the city and on their possible departure from it.2The rating was conducted using a 5-point Likert scale: 5– crucial, 4 – very important, 3 – moderately important, 2 – weakly important and 1– irrelevant. In addition to this information, the questionnaire included items regarding demographic and socio-economic characteristics (i.e. age, household income, household size, education level, era of construction of the house, home ownership and the number of years of residence in the city), as well as respondents’ levels of satisfa-ction with their city of residence, how they perceived the evolution of its population and whether they intended to leave the city within one year.
To the authors’ knowledge, there has been no instrument specifically constructed to assess which factors make a city attractive/unattractive in shrinkage environments, apart from the work of Reckien and Martinez-Fernandez (2011), which assessed only urban sprawl. As such, we also referred to the literature assessing the influence of attributes on the choice of residential location (Ballas, 2013; Bonaiuto et al., 2006; Mellander et al.,
Table 2.Pull and push variables contained in the questionnaire.
Pull variable/coding Push variable/coding
Work in the city in which you live LIVE_WORK Lack of road access ROADS Live close to friends and family LIVE_F_F Lack of commercial areas SHOPPING Existence of a sense of community COMMUNITY Lack of good schools SCHOOLS Existence of mutual aid between
neighbours
MUTUAL_AID Lack of accesses adapted to special needs
SPECIAL_NEEDS
A good place to raise children CHILDREN_GROWTH Lack of leisure areas LEISURE A good place to meet people MEET_PEOPLE Lack of services for elderly residents ELDERLY Being involved in local organizations ONG_PARTICIPATION Lack of public services PUBLIC_SERVICES The existence of elderly centres ELDERLY_CENTRE Lack of green areas GREEN_AREAS Being close to work CLOSE_WORK Being distant from work WORK_FAR Being close to shopping areas CLOSE_SHOPPING Finding higher salary elsewhere MONEY Being close to leisure areas CLOSE_LEISURE Lack of employment opportunities NO_JOB Being close to good schools CLOSE_SCHOOLS Expensive housing HOUSING Being close to green areas CLOSE_GREEN Risk offloods, heat waves RISK The safety of the city SECURITY Vandalized quarters QUARTERS The tranquillity of the city TRANQUILITY Abandoned buildings ABANDON The affordability of the houses AFFORDABLE_HOUSE Lack of safety in the city UNSAFE The existence of walking trails WALKING_TRAILS Lack of environmental quality NO_ENV_QUALITY The existence of open-air sport areas SPORT_OPEN_AIR City with many old people OLD_PEOPLE The existence of a lively night life NIGHT_LIFE Sense of population decline SHRINKING The existence of good
environmental quality
ENV_QUALITY Undesirable neighbours BAD_NEIGHBORS
The existence of good weather CLIMATE Insufficient housing dimensions SMALL_HOUSE Good public transport coverage PUB_TRANS Existence of homeless people NON_RESIDENTS The city’s beauty BEAUTY Lack of planned city development NO_PLAN The city’s heritage HERITAGE Constricted distribution and size of
buildings
OPRESS
2011; Parkes et al.,2002; Rioux & Werner,2011) as guidance for identifying the relevant variables. Therefore, the list of pull and push attributes to be assessed (Table 2) included the most commonly referred to in the literature assessing the attributes of places that in flu-ence residential location decision-making and those considered from the literature to be the most appropriate given the specific characteristics of the four case study cities.
Data analysis
An important outcome of the questionnaire survey was the rating of importance made by each of the respondents of the 24 pull and 24 push variables that were reduced to a small number of factors using factor analysis. Prior to the factor analysis being conducted, the Kaiser–Meyer–Olkin (KMO) measure of sampling adequacy and Bartlett’s test of spheri-city were computed to check the appropriateness of implementing factor analysis on the collected data. A comparison of threshold and measured values of these statistics showed that factor analysis was an adequate method (Table 3) to use for the data both for the full sample and for each city’s subsample of respondents.
Factor analysis was implemented with the principal components method and a varimax rotation using SPSS software. The number of factors was selected according to the stan-dard criterion of retaining only those factors that have associated eigenvalues of >1.
As all factors were standardized to have a mean of zero and a variance of one, we also calculated (non-standardized) factors as weighted averages of the original (non-standar-dized) observed variables, using the corresponding factor loadings as weightings. This information allowed us to determine the level of importance of each factor in the decision to reside in or leave a shrinking city.
Factor analysis was undertaken for the full sample and for each of the four case study cities, for both the pull and push factors. The individual cities were analysed to identify any particular factors within each city that might have been missed when conducting the analysis using the full sample.
Regarding the factors discovered for the full sample, we wanted to understand which measured variables had an influence on their level of importance. Therefore, we estimated linear models using the new Automatic Linear Modelling (LINEAR) procedure in SPSS 21.0. In addition to a summary of the demographic and socio-economic profiles of the
Table 3.Results of the KMO measure and Bartlett’s test.
KMO measure of sampling adequacy
Bartlett’s test of sphericity Chi-square df Sig. Pull variables Full sample 0.886 7456.1 276 0.000
Oporto 0.763 1929.8
Barreiro 0.877 2172.7
Peso da Régua 0.807 2186.4
Moura 0.853 1822.7
Push variables Full sample 0.941 13,474.0
Oporto 0.922 4613.8
Barreiro 0.806 2030.9
Peso da Régua 0.933 4357.5
Moura 0.858 1788.8
Notes: Values of the KMO measure of >0.8 are usually considered as good, and support the use of factor analysis. Low values of Bartlett’s test (<0.05) indicate that the correlation between the variables is significant and appropriate for factor analysis.
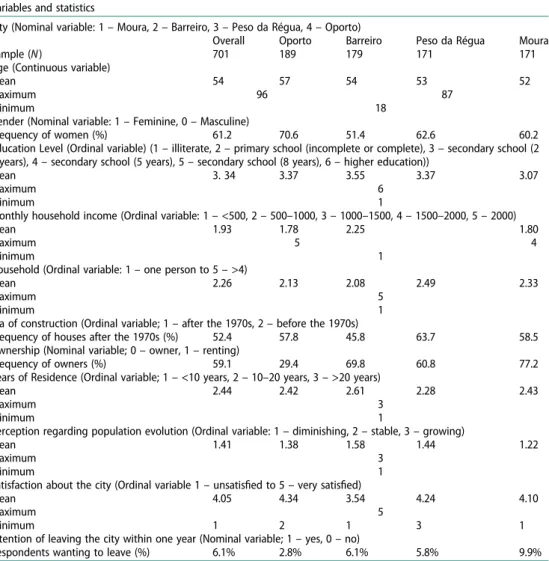
respondents as well as their assessment of their city of residence,Table 4provides the list of all the explanatory variables that were considered. Thefinal set of explanatory variables appearing in the linear model for each factor was based on the optimality of the small-sample-corrected Akaike information criterion over all possible subsets and also required that all the included variables were significant at the 5% significance level. Before the regression models were estimated, missing values were replaced in some of the continuous, ordinal and nominal variables by their sample means, medians and modes, respectively. Values of continuous variables that lay beyond a cut-off value of three standard deviations from the mean were identified as outliers and replaced by the cut-off value. Finally, to arrive at more parsimonious models, categories of both ordinal and nominal variables were merged. Similar categories were identified based upon the relationship between the explanatory variable and the dependent variable. Categories that were not significantly different at the 10% significant level were merged. Whenever all the categories of a given
Table 4.Model variables, respondent demographic and socio-economic statistics, and respondents’ assessment of their city of residence.
Variables and statistics
City (Nominal variable: 1– Moura, 2 – Barreiro, 3 – Peso da Régua, 4 – Oporto)
Overall Oporto Barreiro Peso da Régua Moura
Sample (N) 701 189 179 171 171
Age (Continuous variable)
Mean 54 57 54 53 52
Maximum 96 87
Minimum 18
Gender (Nominal variable: 1– Feminine, 0 – Masculine)
Frequency of women (%) 61.2 70.6 51.4 62.6 60.2 Education Level (Ordinal variable) (1– illiterate, 2 – primary school (incomplete or complete), 3 – secondary school (2
years), 4– secondary school (5 years), 5 – secondary school (8 years), 6 – higher education))
Mean 3. 34 3.37 3.55 3.37 3.07
Maximum 6
Minimum 1
Monthly household income (Ordinal variable: 1– <500, 2 – 500–1000, 3 – 1000–1500, 4 – 1500–2000, 5 – 2000)
Mean 1.93 1.78 2.25 1.80
Maximum 5 4
Minimum 1
Household (Ordinal variable: 1– one person to 5 – >4)
Mean 2.26 2.13 2.08 2.49 2.33
Maximum 5
Minimum 1
Era of construction (Ordinal variable; 1– after the 1970s, 2 – before the 1970s)
Frequency of houses after the 1970s (%) 52.4 57.8 45.8 63.7 58.5 Ownership (Nominal variable; 0– owner, 1 – renting)
Frequency of owners (%) 59.1 29.4 69.8 60.8 77.2 Years of Residence (Ordinal variable; 1– <10 years, 2 – 10–20 years, 3 – >20 years)
Mean 2.44 2.42 2.61 2.28 2.43
Maximum 3
Minimum 1
Perception regarding population evolution (Ordinal variable: 1– diminishing, 2 – stable, 3 – growing)
Mean 1.41 1.38 1.58 1.44 1.22
Maximum 3
Minimum 1
Satisfaction about the city (Ordinal variable 1– unsatisfied to 5 – very satisfied)
Mean 4.05 4.34 3.54 4.24 4.10
Maximum 5
Minimum 1 2 1 3 1
Intention of leaving the city within one year (Nominal variable; 1– yes, 0 – no)
variable ended up being merged into a single category, that variable was excluded from the model because it had no value as a predictor.
Results and interpretation
What makes residents of shrinking cities stay? The pull factors
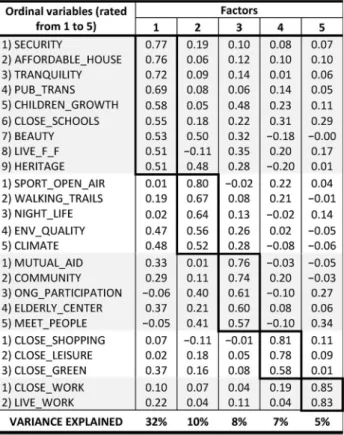
Table 5gives the results of the factor analysis regarding the possible pull factors for the full sample. The table is organized with respect to the variance explained by each factor.
To allow the factors obtained and the results of the Automatic Linear Modelling (LINEAR) to be more clearly understood, we attributed a name to each factor. The selection of the nomenclature for the factors took into account the most relevant variables loaded onto each factor (Tables 2and5) and the concepts expressed in the reviewed literature. Factor 1 (Table 5) is composed of variables regarding the‘living conditions’ within the city (e.g. secur-ity, affordability of the houses and tranquillity). Factor 2 comprises variables (Table 5) regarding‘recreational & environmental amenities’ (e.g. the existence of open-air areas for sports activities, footpaths and lively nightlife). Factor 3 is related to‘social ties’ as it includes variables regarding the existence of mutual aid and trust between neighbours, community
Table 5.Factor analysis of the 24 pull variables (full sample).
Notes: The original variables are ordinal (Likert scale, ranging from 1– irrelevant to 5 – crucial). Extraction method: Principal component analysis. Rotation method: Varimax with Kaiser normalization. The rotation converged in seven iterations. Total variance explained = 62%. More detailed information about each variable can be found inTable 2. Shading is used to facilitate the distinction between factors.
spirit and involvement in local organizations (Table 5). Factor 4 is related to‘accessibility’ to services, considering that the variables loaded include proximity to shopping areas, leisure and nature (Table 5). Finally, factor 5 includes two variables related mostly to the proximity between home and the workplace, and therefore it was designated as‘live & work’.
What might make residents leave shrinking cities? The push factors
Regarding the characteristics that might lead respondents to leave their city of residence (push variables), the factor analysis reveals four factors (Table 2andTable 6). Factor 1 is related mainly to the‘lack of services’ within the city, as the variables loaded refer to the lack of shopping areas, public services and roads. Factor 2 was designated‘shrinking atmosphere’ of the city, because it includes variables regarding the sense of population decline and the high proportion of elderly people. Factor 3 is also related to the atmos-phere of the city but linked more to the existence of degraded and abandoned buildings, poor environmental quality, small houses and a perception that the city is unsafe; there-fore, it was named‘surroundings & visual attributes’. Finally, the three variables loaded
Table 6.Factor analysis of the 24 push variables (full sample).
Notes: The original variables are ordinal (Likert scale, ranging from 1– irrelevant to 5 – crucial). Extraction method: Principal component analysis. Rotation method: Varimax with Kaiser normalization. The rotation converged in six iterations. Total variance explained = 70%. More detailed information about each variable can be found inTable 2. Shading is used to facilitate the distinction between factors.
onto factor 4 (i.e. the lack of job opportunities, better income elsewhere and a large dis-tance between the workplace and home) justified its designation as ‘working conditions’.
What influences the scores of the pull and push factors?
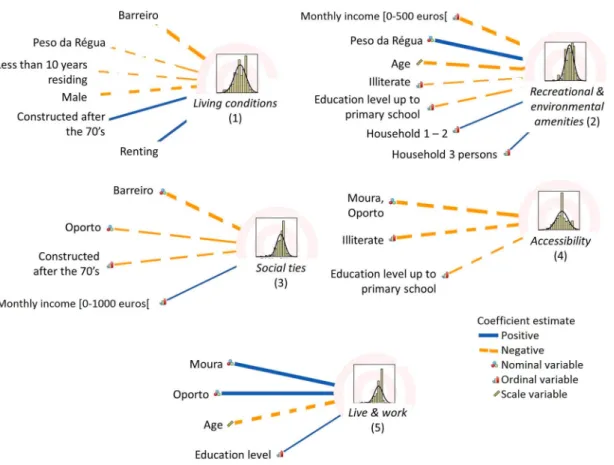
Figures 2 and3 schematically display the results of regressions of each pull and push factor, respectively. The figures show the final set of explanatory variables influencing the score of each factor as well as the valence of each relationship (positive or negative). These relationships represent partial regression coefficients and measure the impact of each variable while keeping all the other variables constant. With regard to the‘living con-ditions’ pull factor, the score was influenced by the city of residence, the number of years of residence, gender, the era of house construction and tenancy. Residents of Barreiro and Peso da Régua tended to score this factor lower compared with residents of Moura and Oporto. Men also tended to score it lower than did women, whereas those renting houses and living in newer houses provided higher scores. The‘recreational & environ-mental amenities’ scores tended to be lower for those with the lowest monthly income, as well as for older residents and the less well educated. Residents of Peso da Régua tended to give higher scores, as did households of up to three persons. In the case of the ‘accessibility pull factor’, Moura and Oporto stand out but in this case with lower factor scores than the remaining cities. Furthermore, residents with lower education levels gave lower scores. The‘live & work’ factor score was influenced by the city of resi-dence and by the age and education level of the respondents. Residents of Moura and Oporto, compared with residents in the other two cities, gave higher factor scores, as did younger respondents and those with higher levels of education.
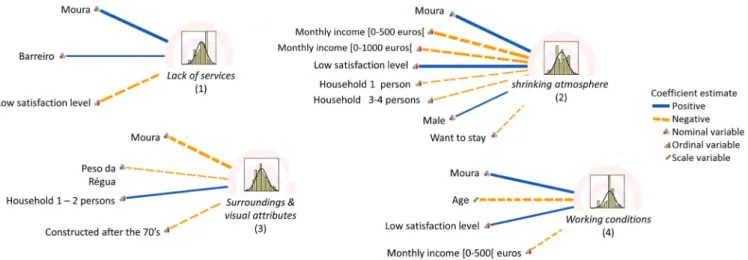
Regarding the push factors, and in the case of the‘lack of services’, residents of Barreiro and especially Moura tended to score higher than did residents of the other cities. The less satisfied respondents tended to give lower scores for this factor. For the ‘shrinking atmos-phere’ push factor, Moura residents tended to score higher, as did male respondents and those with low satisfaction levels. Households with monthly incomes of <500 and 500– 1000 euros, households with 1–4 persons and residents who were not planning to leave the city tended to give lower scores for this push factor. Furthermore, residents who were less satisfied with their city of residence provided higher scores. With regard to the ‘surround-ing & visual attributes’ push factor, Moura and Peso da Régua provided lower scores, as did residents living in newer houses. Smaller households (1–2 persons) gave higher scores for this factor compared with larger households. For‘working conditions’, Moura residents stand out from the remaining respondents because of their higher factor scores. This factor for potentially deciding to leave the city was less important for older residents and for those with very low incomes, as well as for residents with higher levels of satisfaction with their city.
Looking more deeply into each city
Given that the study was undertaken in four different cities, factor analysis was performed for each city subsample. The main goal of the analyses was to identify whether any factors emerged that were specific to each city. To make such a comparison,Tables 7and8list the variables as presented inTables 5and6. Regarding the presentation of the results of the
Figure 2.Variables influencing the scores of the pull factors. The results were obtained by Automatic Linear Modelling in SPSS. The thickness of each line is pro-portional to the strength of the relationship between the variable and the factor. The histogram in each case shows the distribution of the scores of each factor.
M. H. GUIM A R Ã ES ET AL.
Figure 3.Variables influencing the scores of the push factors. The results were obtained by Automatic Linear Modelling in SPSS. The thickness of each line is pro-portional to the strength of the relationship between the variable and the factor. The histogram in each case shows the distribution of the scores of each factor.
PEA N PLAN NING STUDIES 1697
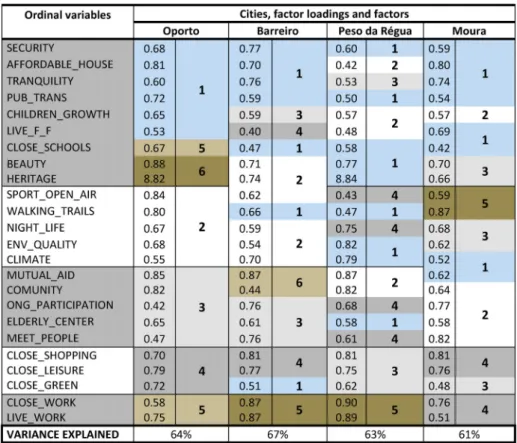
pull factors (Table 7) and push factors (Table 8), the loading values presented are the highest registered for each variable.
In the case of Oporto, the results for the pull variables show the existence of six factors. Most factors have a similar composition to those based on the full sample. However, a new pull factor emerged for Oporto (factor 6 inTable 7, variables presented inTable 2), com-prising variables related to the city’s ‘beauty & heritage’.
The subsample for Barreiro city also included six pull factors. Again, most factors are composed of the same variables as for the full sample. However, an additional factor (factor 6 in Table 7) is specific to Barreiro, and consists of two variables related to the
‘sense of community’ (i.e. the existence of mutual aid between neighbours and of a sense of community).
In the cases of Peso da Régua and Moura,five pull factors were identified for each sub-sample. In Peso da Régua, factor 1 is a mixture of‘living conditions & environmental ame-nities’. Factor 2 is composed of variables representing ‘social ties’, such as the sense of community, being close to friends and family, and the city being a good place in which to raise children (Tables 2and7). Factors 3 and 5 have similar compositions to those for the full sample, and can therefore be respectively entitled ‘accessibility’ and ‘live & work’. Factor 4 is a mixture of activities related to‘recreation & social networks’ (Tables 2and7).
Table 7.Pull factors for each city subsample.
Notes: The variables listed in thefirst column of the table are differentiated by shading and lines representing the factor composition for the full sample from factor 1 (top) to factor 5 (bottom). More detailed information about each variable can be found inTable 2.
For Moura, no factor completely follows the composition obtained for the full sample, but there are similarities (Tables 2 and 7). Factor 1 is a mixture and covers ‘living conditions, environmental amenities & mutual aid’. Factor 2 concerns mostly ‘social ties’. Factor 3 mixes features regarding the city ‘landscape’ (i.e. city beauty and heritage), ‘recreation activities’ (i.e. vibrant nightlife) and ‘environmental amenities’ (i.e. environmental quality and proximity to green areas). Factor 4 com-bines proximity to services and work, which justifies its designation as ‘accessibility and live & work’. The fifth factor is related to environmental amenities and is encap-sulated as ‘contact with nature’ (i.e. the existence of open-air sport areas and walking trails).
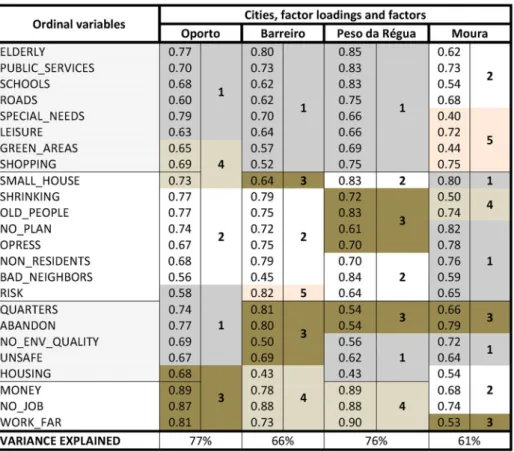
Table 8provides information on the results of the factor analysis of each city subsample with regard to the push factors. For Oporto, most push factors have a different compo-sition from those of the full sample. The exception is factor 2, which includes variables associated with the‘shrinking atmosphere’ of the city (Tables 2and8). Factor 1 comprises variables regarding the lack of services and variables describing the surroundings and visual attributes of the city; hence, this factor can be entitled‘lack of services & the city surroundings’. Factor 3 includes, in addition to working conditions, the affordability of
Table 8.Push factors for each city subsample.
Notes: The variables listed in thefirst column of the table are differentiated by shading and lines representing the factor composition for the full sample from factor 1 (top) to factor 4 (bottom). More detailed information about each variable can be found inTable 2.
houses; hence, in this case, the factor can be designated as‘economic conditions’. Finally, factor 4 is a combination of variables regarding the lack of services and the inadequacy of the size of houses; hence, this factor is designated as‘house size & lack of services’.
For Barreiro, most factors have the same composition as those for Oporto but with the exceptions of factor 1 entitled‘lack of services’ and factor 3 entitled ‘surrounding & visual attributes’ (excluding housing affordability), which follow the full sample (Tables 2and8). Factors 2 and 4 are similar to factors 2 and 3 of Oporto, designated as‘shrinking atmos-phere’ and ‘economic conditions’, respectively. Factor 5 includes one variable regarding the‘risk’ of floods, heat waves or frost, which is a factor specific to Barreiro.
For Peso da Régua, push factor 1 comprises variables regarding‘lack of services & the city surroundings’ (Tables 2and8). Factors 2 and 3 are related to the atmosphere of the city, with the former factor being associated mainly with‘detrimental features’ (e.g. insuf-ficient housing dimensions and undesirable neighbours) whereas the latter is encapsulated by the‘effects of shrinkage’ (e.g. a sense of population decline and a city with many old people). Factor 4 concerns ‘working conditions’ since it includes variables regarding lack of employment opportunities and higher salary elsewhere.
In the case of Moura, factor 1 concerns mainly the city’s ‘shrinking atmosphere’ (Tables 2and8). Factor 2 includes variables representing‘lack of services’ and ‘economic con-ditions’ (e.g. a lack of public services and an absence of well-paid job opportunities). Factor 3 includes two variables related to the physical effects of shrinkage and a variable associated with working conditions, and can be termed‘vandalized surroundings’. Factor 4 is composed of two variables describing‘shrinkage awareness’ (i.e. a city with many old people and a sense of population decline). Finally, Moura includes afifth factor, capturing a‘lack of recreational services’ (e.g. a lack of leisure areas and green areas).
Which factors are more important?
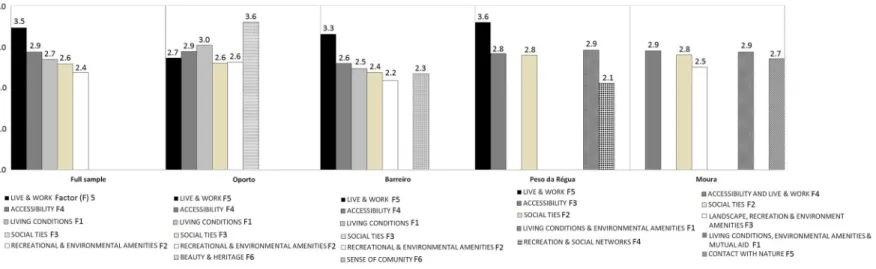
With respect to the importance of the pull factors presented,Figure 4shows the score of each factor calculated as the weighted average score of the constituent variables for both the full sample and the city subsamples. The‘live & work’ factor was the most important factor for the full sample, with a score of 3.5 out of 5. Three factors had scores of >2.5: ‘accessibility’, ‘living conditions’ and ‘social ties’. ‘Recreational & environmental amenities’ were found to have the lowest importance.
The aforementioned order of importance for the full sample was not found for Oporto, where the specific factor of ‘beauty & heritage’ was scored as very important (3.6), followed by the remaining factors all with a score of around 3 (moderately important). For Barreiro, the‘live & work’, ‘accessibility’ and ‘living conditions’ factors were scored as moderately important, whereas the remaining three factors were considered as being of lower impor-tance. For Peso da Régua, the‘live & work’ factor was ranked as very important (a score of around 4) whereas the factors‘living conditions & environmental amenities’, ‘accessibility’ and ‘social ties’ were considered moderately important. The ‘recreation and social network’ factor was ranked as weakly important (around 2). For Moura, all factors were considered moderately important.
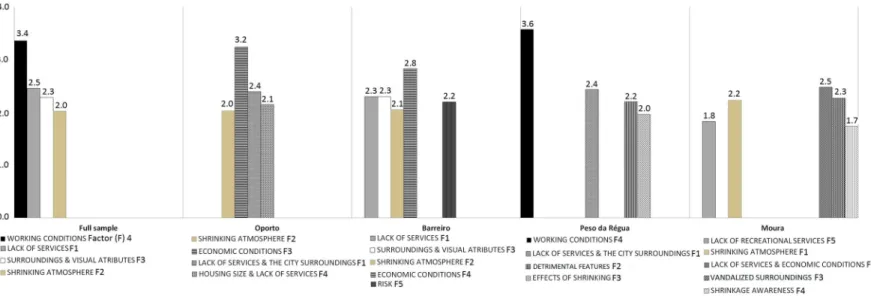
The weighted score values of the push factors were generally lower than those of the pull factors (Figures 4and5). The highest value obtained was for the‘working conditions’ factor in the case of the full sample and for Peso da Régua. In Oporto, Barreiro and Moura,
Figure 4.Weighted average scores of the pull factors for the full sample and for the specific cases of Oporto, Barreiro, Peso da Régua and Moura. The number presented after each factor name corresponds to the factor number inTables 4and6.
PEA N PLAN NING STUDIES 1701
Figure 5.Weighted average scores of the push factors for the full sample and for the specific cases of Oporto, Barreiro, Peso da Régua and Moura. The number presented after each factor name corresponds to the factor number inTables 5and7.
M. H. GUIM A R Ã ES ET AL.
the variables that characterized this factor were included in factors with a different desig-nation– ‘economic conditions’ and ‘lack of services & economic conditions’ – but with the same level of importance as the‘working conditions’ push factor. The least important push factor in both Oporto and Barreiro was the‘shrinking atmosphere’ and in Peso da Régua it was the‘effects of shrinkage’, whereas in Moura the factors ‘lack of recreational services’ and‘shrinkage awareness’ were ranked lowest.
Discussion
Drivers for staying in a place or moving to another have been distinguished as economic (Andersen & van Kempen,2003), amenities related (Partridge et al.,2007) and psychologi-cal (Coulton et al., 2012). The factors obtained in the present study fit the previously described typology of drivers (Tables 5and6). The pull and push factors designated ‘acces-sibility’, ‘living conditions’, ‘recreational & environmental amenities’ and ‘lack of services’ are constituted mostly by variables associated with amenities (Ferguson et al., 2007; Garmendia et al., 2008). The‘social ties’ pull factor is related mostly to psychological aspects (Brown et al., 2003; Coulton et al., 2012). Finally, economic drivers (Andersen & van Kempen, 2003) associated mainly with employment are included in the pull factor ‘live & work’ and in the push factor ‘working conditions’. However, in the case of the push variables, the analysis uncovered two factors composed mainly of specific fea-tures of cities that are losing population. The factors of‘surrounding & visual attributes’ and the‘shrinking atmosphere’ embrace variables concerning the existence of abandoned buildings, vandalized quarters and unsafety for the former factor, and a predominance of aged residents and homeless people for the latter. Despite the clear evidence of shrinkage characteristics, as revealed through ‘surroundings & visual attributes’ and a ‘shrinking atmosphere’, the low importance of these factors to the decision to potentially move out of the city (Figure 5) suggests that although residents of the studied cities acknowledge the shrinkage process, these are not the most relevant factors influencing residents’ decisions to leave. Moreover, an atmosphere of shrinkage does not seem to damage resi-dential satisfaction, as suggested by Delken (2008) and Hollander (2011).
In this empirical study, the relevance of economic aspects in residents’ decision to stay in or leave a city was evident. The variables associated with working conditions are grouped in discrete pull and push factors (Tables 5 and 6). Hence, the availability of and proximity to work is a factor that explained residents’ willingness to stay and also their potential departure when a job or better working conditions could be found else-where. This can be considered an initial insight regarding the importance of economic drivers. Furthermore, these economic drivers (Tables 7 and 8) were also obtained for each subsample (i.e. Oporto, Barreiro, Peso da Régua and Moura). Finally, when measu-ring the level of importance of each factor, it is clear that‘live & work’ is the most impor-tant pull factor and that‘working conditions’ is the main factor pushing residents to leave (Figures 4 and 5). Hence, the present study supports the economic perspective of migratory movement (Andersen & van Kempen,2003; Arnott & Chaves,2012).
Despite the predominance of economic drivers, the results also show the relevance of cities’ specific characteristics with respect to pull and push factors. The most striking case is that of Oporto, where the‘beauty & heritage’ factor was identified (Table 7) and was considered by residents as the most important pull factor (Figure 4). This is an
example of the importance of particular psychological factors, especially those related to place attachment, in explaining the willingness of residents to stay (Brown et al.,2003). However, it should be noted that of the four case study cities, Oporto is the oldest city with a very distinct identity, and the ‘beauty & heritage’ factor emphasizes residents’ pride in their city. In this context, a place identity describes residents’ socialization with the physical world, similar to the perspective of Twigger-Ross and Uzzell (1996). Further-more, the results obtained regarding the push factors clearly show that in a situation of a lack of employment or of better opportunities elsewhere, residents of Oporto would move out (Figure 5). In 2011, the unemployment rate in the city was 18% whereas the national average was 13% (Table 1). Despite this, the fact that Oporto residents show a high level of attachment to place should not be disregarded, especially when trying to deal with the process of urban shrinkage. Place attachment might be the driver to get residents involved in defining strategies to make shrinkage an opportunity rather than a threat (Hospers,
2013). Place attachment has also been identified as an aspect that delays the decision to
move out (Grzeskowiak et al.,2003; Hidalgo & Hernandez,2001).
The opposite situation was found in Barreiro, where although a case-specific pull factor was identified (the ‘sense of community’), this factor was rated as having little importance in influencing residents’ decision to stay (Table 7andFigure 4). In addition, economic reasons are predominant in both pull and push factors (Figures 4 and 5) and, with regard to the regression models of the factor scores, Barreiro also stands out by the low score given to the‘social ties’ pull factor (Figure 2). Hence, in Barreiro, place attachment is particularly low and moving out might be a faster process than in the case of Oporto. Of the four case study cities, Peso da Régua showed the lowest relative population decline between 1991 and 2011. The city’s lower score (compared with other cities) regis-tered in the‘surrounding and visual attributes’ push factor (Figure 3) might be related to the lack of visual impacts of the shrinkage experienced and also to the city’s widely renowned natural landscape. Furthermore, the score of the pull factor ‘recreational & environmental amenities’ was higher in Peso da Régua than in other cities (Figure 2), which denotes an appreciation of the city’s natural features. Such an appreciation could be important in attracting back residents who moved out in search of higher education opportunities.
Moura is also an example of the importance of non-economic drivers in influencing residents’ decisions.Figures 2 and3show that residents of Moura can be distinguished from the residents of the other cities with respect to the scores attributed to several pull and push factors. Furthermore, the economic variables were found grouped with other variables in the city’s particular pull factor, designated ‘accessibility and live & work’ (Table 7), as well as in one push factor designated‘lack of services & economic conditions’ (Table 8). From the average score obtained in the Moura subsample, this push factor was the only one considered important in a decision to move out (Figure 5).
In the particular context of shrinking cities, our results show the relevance of the reasons behind the population decline. Oporto is an example of population loss by suburbanization (Guimarães et al.,2015), and the most important push factor identified for this city (Figure 5) includes variables relating to housing conditions (i.e. factor 3 in Table 8, designated ‘economic conditions’). In deindustrialization processes, as experienced in Barreiro, one negative impact reported is a decrease in the strength of social ties (Hospers,2013). Our results show that this city suffers from such a phenomenon, as the‘social ties’ pull factor
score was lower in Barreiro compared with other cities (Figure 2). Furthermore, the average scores presented inFigure 4show that the‘social ties’ and ‘sense of community’ pull factors registered the lower values amongst all the specific pull factors for Barreiro. Moura is an inland city and has an ageing population, and our results demonstrate how such conditions affect the particular push factors identified in this city (Table 8). The variables referring to economic and amenities are mixed within the same factor (i.e.‘lack of services & economic conditions’) and this factor is the most important push factor (Figure 5). Peso da Régua is surrounded by a landscape that is internationally recognized for its natural beauty. This feature is reflected in the results, as Peso da Régua was the city with the highest score for the pull factor ‘recreation & environmental amenities’ (Figure 2). Furthermore, one of the most valued factors identified for Peso da Régua (Figure 4) was that of‘living con-ditions & environmental amenities’. Bonaiuto et al. (2006) argued that spatial aspects such as aesthetics, accessibility and green areas influence migration decisions by affecting the perceived environmental quality of the places. This would appear to apply in the particular cases of Moura and Peso da Régua, as well as in Oporto. The empirical observations pre-sented here further support the arguments of Guimarães et al. (2015) regarding the need to consider city specificities in understanding the process of shrinkage.
The socio-economic characteristics of respondents were also shown to influence the scores obtained for the pull and push factors identified through the estimated models (Figures 2 and 3). Economic drivers are more important for the younger generations and also for those with higher education levels, whereas psychological drivers such as the‘social ties’ factor are more valued by respondents with low incomes (<1000 euros/ month). Moreover, the push factor‘shrinking atmosphere’ is significantly less valued by lower-income residents. Furthermore, residents living in newer houses value different factors from those living in older houses: whereas the former positively value the pull factor ‘living conditions’, the latter value the pull factor ‘social ties’ as well as the push factor‘surrounding & visual attributes’ (Figures 2and3).
Conclusion
When dealing with shrinking cities, one relevant question to be addressed by policy makers is what makes residents decide to remain in a city and what could make them leave. This knowledge could be crucial for urban development, because it could lead to more suitable strategies being found to maintain and even increase the populations of shrinking cities. Our empirical study supports previousfindings that underline the need to assure job opportunities and good working conditions. However, the specificities uncovered also highlight that strategies focused solely on assuring economic conditions might not be sufficient to maintain or increase a city population, and therefore other factors need to be considered. Both social ties and place attachment were also found to be important drivers of residents’ decisions regarding migration; hence, a sense of commu-nity as well as a city’s identity and distinctive features need to be considered to increase its resilience. Although this study made a comprehensive coverage of literature-based attri-butes to be assessed by inhabitants, in future studies we suggest the use of focus group dis-cussions with key citizens of the case study cities when designing the questionnaire. This would allow the list of selected attributes related to the particularities of the cities to be
refined, which may provide further insights into the factors affecting inhabitants’ decisions regarding residential location.
Notes
1. The stratification did not account for possible differences between neighbourhoods within each case study. However, by considering the distribution of households by parishes and household type, the sample is presumed to cover the diversity in the preferences of inhabitants.
2. The respondents of the questionnaire were inhabitants residing in each city at the time of the survey; therefore, we asked those residents about perceived push factors (i.e. what could make them leave the city). The questionnaire does not capture the views of inhabitants who have already left the city.
Disclosure statement
No potential conflict of interest was reported by the authors.
Funding
This work was funded by the European Regional Development Fund through the Operational Pro-gramme for Competitiveness Factors and by national funding from the Foundation for Science and Technology under the project [EXPL/ATP-EUR/0464/2013] -‘Policy guidelines for regeneration in shrinking cities’. Luis Catela Nunes acknowledges support from Nova Forum.
ORCID
Maria Helena Guimarães http://orcid.org/0000-0002-6904-3696
Luis Catela Nunes http://orcid.org/0000-0001-8115-6223
Ana Paula Barreira http://orcid.org/0000-0001-5816-3361
Thomas Panagopoulos http://orcid.org/0000-0002-8073-2097
References
Alves, D., Barreira, A. P., Guimarães, M. H., & Panagopoulos, T. (2016). Historical trajectories of currently shrinking Portuguese cities: A typology of urban shrinkage. Cities, 52, 20–29.doi:10. 1016/j.cities.2015.11.008
Amérigo, M., & Aragonés, J. I. (1997). A theoretical and methodological approach to the study of residential satisfaction. Journal of Environmental Psychology, 17(1), 47–57. doi:10.1006/jevp. 1996.0038
Andersen, H. S. (2002). Excluded places: The interaction between segregation, urban decay and deprived neighborhoods. Housing, Theory and Society, 19(3–4), 153–169. doi:10.1080/ 140360902321122860
Andersen, H. T., & van Kempen, R. (2003). New trends in urban policies in Europe: Evidence from the Netherlands and Denmark. Cities, 20(2), 77–86.doi:10.1016/S0264-2751(02)00116-6
Arnott, R. D., & Chaves, D. B. (2012). Demographic changes,financial markets, and the economy. Financial Analysis Journal, 68(1), 23–46.doi:10.2469/faj.v68.n1.4
Ballas, D. (2013). What makes a“happy city”? Cities, 32(1), S39–S50.doi:10.1016/j.cities.2013.04. 009
Bayer, P., Keohane, N., & Timmins, C. (2009). Migration and hedonic valuation: The case of air quality. Journal of Environmental Economics and Management, 58(1), 1–14. doi:10.1016/j. jeem.2008.08.004
Blasius, J., & Friedrichs, J. (2007). Internal heterogeneity of a deprived urban area and its impact on resident’s perception of deviance. Housing Studies, 22(5), 753–780. doi:10.1080/ 02673030701474693
Bonaiuto, M., Fornara, F., & Bonnes, M. (2003). Indexes of perceived residential environment quality and neighbourhood attachment in urban environments: A confirmation study on the city of Rome. Landscape and Urban Planning, 65(1–2), 41–52.doi:10.1016/S0169-2046(02)00236-0
Bonaiuto, M., Fornara, F., & Bonnes, M. (2006). Perceived residential environment quality in middle- and low-extension Italian cities. Revue Européene de Psycholologie Appliquée, 56, 23–34.doi:10.1016/j.erap.2005.02.011
Brown, B., Perkins, D. D., & Brown, G. (2003). Place attachment in a revitalizing neighborhood: Individual and block levels of analysis. Journal of Environmental Psychology, 23(3), 259–271.
doi:10.1016/S0272-4944(02)00117-2
Brunner, E. J., Cho, S.-W., & Reback, R. (2012). Mobility, housing markets, and schools: Estimating the effects of inter-district choice programs. Journal of Public Economics, 96(7–8), 604–614.
doi:10.1016/j.jpubeco.2012.04.002
Chen, W. Y., & Jim, C. Y. (2010). Amenities and disamenities: A hedonic analysis of the hetero-geneous urban landscape in Shenzhen (China). The Geographical Journal, 176(3), 227–240.
doi:10.1111/j.1475-4959.2010.00358.x
Cheshire, P., & Magrini, S. (2006). Population growth in European cities: Weather matters– but only nationally. Regional Studies, 40(1), 23–37.doi:10.1080/00343400500449259
Cortese, C., Haase, A., Grossmann, K., & Ticha, I. (2014). Governing social cohesion in shrinking cities: The cases of Ostrava, Genoa and Leipzig. European Planning Studies, 22(10), 2050–2066.
doi:10.1080/09654313.2013.817540
Couch, C., & Karecha, J. (2006). Controlling urban sprawl: Some experience from Liverpool. Cities, 23(5), 353–363.doi:10.1016/j.cities.2006.05.003
Coulton, C., Theodos, B., & Turner, M. A. (2012). Residential mobility and neighborhood change: Real neighborhoods under the microscope. Cityscape: A Journal of Policy Development and Research, 14(3), 55–89.
Delken, E. (2008). Happiness in shrinking cities in Germany. Journal of Happiness Studies, 9(2), 213–218.doi:10.1007/s10902-007-9046-5
Elo, I. T., Mykyta, L., Margolis, R., & Culhane, J. F. (2009). Perceptions of neighborhood disorder: The role of individual and neighborhood characteristics. Social Science Quarterly, 90(5), 1298–1320.doi:10.1111/j.1540-6237.2009.00657.x
Ferguson, M., Ali, K., Olfert, M. R., & Partridge, M. (2007). Voting with their feet: Jobs versus ame-nities. Growth and Change, 38(1), 77–110.doi:10.1111/j.1468-2257.2007.00354.x
Garmendia, M., Urena, J. M., Ribalaygua, C., Leal, J., & Coronado, J. M. (2008). Urban residential development in isolated small cities that are partially integrated in Metropolitan areas by high speed train. European Urban and Regional Studies, 15(3), 249–264. doi:10.1177/ 0969776408090415
Grzeskowiak, S., Sirgy, M. J., & Widgery, R. (2003). Residents’ satisfaction with community services: Predictors and outcomes. The Journal of Regional Analysis and Policy, 33(2), 1–33.
Guimarães, M. H., Barreira, A. P., & Panagopoulos, T. (2015). Shrinking cities in Portugal– where and why. Revista Portuguesa de Estudos Regionais, 3° Quadrimestre, n° 40.
Haase, A., Bernt, M., Grobmann, K., Mykhnenko, V., & Rink, D. (2013). Varieties of shrinkage in European cities. European Urban and Regional Studies, 23(1), 1–17.doi:10.1177/0969776413481985
Hidalgo, M. C., & Hernandez, B. (2001). Place attachment: Conceptual and empirical questions. Journal of Environmental Psychology, 21(3), 273–281.doi:10.1006/jevp.2001.0221
Hoekveld, J. J. (2012). Time–space relations and the differences between shrinking cities. Built Environment, 38(2), 179–195.doi:10.2148/benv.38.2.179
Hoekveld, J. J. (2014). Understanding spatial differentiation in urban decline levels. European Planning Studies, 22(2), 362–382.doi:10.1080/09654313.2012.744382
Hollander, J. B. (2011). Can a city successfully shrink? Evidence from survey data on neighborhood quality. Urban Affairs Review, 47(1), 129–141.doi:10.1177/1078087410379099
Hospers, G.-J. (2013). Coping with shrinkage in Europe’s cities and towns. Urban Design International, 18, 78–89.doi:10.1057/udi.2012.29
Hospers, G.-J. (2014). Policy responses to urban shrinkage: From growth thinking to civic engage-ment. European Planning Studies, 22(7), 1507–1523.doi:10.1080/09654313.2013.793655
International Organization for Migration. (2011, September 12–13). Economic cycles, demographic change and migration. International Dialogue on Migration Workshop– the future of migration: Building capacities for change, Background Paper.
van der Land, M., & Doff, W. (2010). Voice, exit and efficacy: Dealing with perceived neighbour-hood decline without moving out. Journal of Housing and the Built Environment, 25(4), 429–445.
doi:10.1007/s10901-010-9197-2
Lutz, J. M. (2001). Determinants of population growth in urban centres in the Republic of Ireland. Urban Studies, 38(8), 1329–1340.doi:10.1080/00420980120061052
Martinez-Fernandez, C., Audirac, I., Fol, S., & Cunningham-Sabot, E. (2012). Shrinking cities: Challenges of globalization. International Journal of Urban and Regional Research, 36(2), 213–225.doi:10.1111/j.1468-2427.2011.01092.x
Mellander, C., Florida, R., & Stolarick, K. (2011). Here to stay– the effects of community satisfac-tion on the decision to stay. Spatial Economic Analysis, 6(1), 5–24.doi:10.1080/17421772.2010. 540031
OECD. (2003). Low fertility rates in OECD countries: Facts and policy responses (OECD Social, Employment and Migration Working Papers). Paris.
Oswalt, P., & Rieniets, T. (Eds.). (2006). Atlas of shrinking cities. Ostfildern: Hatje Cantz. Pallagst, K., Schwarz, T., Popper, F. J., & Hollander, J. B. (2009). Planning shrinking cities. Progress
in Planning, 72(4), 223–232.
Parkes, A., Kearns, A., & Atkinson, R. (2002). What makes people dissatisfied with their
neighbor-hoods? Urban Studies, 39(13), 2413–2438.doi:10.1080/0042098022000027031
Partridge, M., Bollman, R. D., Olfert, M. R., & Alasia, A. (2007). Riding the wave of urban growth in the countryside: Spread, backwash, or stagnation? Land Economics, 83(2), 128–152.doi:10.3368/ le.83.2.128
Portnov, B. A. (2004). Long-term growth of small towns in Israel: Does location matter? Annals of Regional Science, 38(4), 627–653.doi:10.1007/s00168-003-0189-y
Portnov, B. A., & Pearlmutter, D. C. (1999). Sustainable urban growth in peripheral areas. Progress in Planning, 52(4), 239–308.doi:10.1016/S0305-9006(99)00016-1
Powe, N. A., Garrod, G. D., & Willis, K. G. (1995). Valuation of urban amenities using an hedonic price model. Journal of Property Research, 12(2), 137–147.doi:10.1080/09599919508724137
Reckien, D., & Martinez-Fernandez, C. (2011). Why do cities shrink? European Planning Studies, 19 (8), 1375–1397.doi:10.1080/09654313.2011.593333
Rioux, L., & Werner, C. (2011). Residential satisfaction among aging people living in place. Journal of Environmental Psychology, 31(2), 158–169.doi:10.1016/j.jenvp.2010.12.001
Royuela, V., Moreno, R., & Vaya, E. (2010). Influence of quality of life on urban growth: A case study of Barcelona, Spain. Regional Studies, 44(5), 551–567.doi:10.1080/00343400802662682
Turok, I., & Mykhnenko, V. (2007). The trajectories of European cities, 1960–2005. Cities, 24(3), 165–182.doi:10.1016/j.cities.2007.01.007
Twigger-Ross, C. L., & Uzzell, D. L. (1996). Place and identity processes. Journal of Environmental Psychology, 16(3), 205–220.doi:10.1006/jevp.1996.0017
Waltert, F., & Schaläpfer, F. (2010). Landscape amenities and local development: A review of migration, regional economic and hedonic pricing studies. Ecological Economics, 70(2), 141–152.doi:10.1016/j.ecolecon.2010.09.031
Wiechmann, T., & Pallagst, K. M. (2012). Urban shrinkage in Germany and the USA: A compari-son of transformation patterns and local strategies. International Journal of Urban and Regional Research, 36(2), 261–280.doi:10.1111/j.1468-2427.2011.01095.x
Zimmermann, K. F. (2005). European labour mobility: Challenges and potentials. De Economist, 153(4), 425–450.doi:10.1007/s10645-005-2660-x