M
ASTER IN
F
INANCE
M
ASTER
’
S
F
INAL
W
ORK
D
ISSERTATION
C
ORPORATE
G
OVERNANCE AND
C
APITAL
S
TRUCTURE
:
ANALYSIS
FOR THE
P
ORTUGUESE AND
S
PANISH
S
TOCK
I
NDICES
J
OÃO
F
ILIPE
D
A
C
RUZ
R
IBEIRO
M
ASTER IN
F
INANCE
M
ASTER
’
S
F
INAL
W
ORK
D
ISSERTATION
C
ORPORATE
G
OVERNANCE AND
C
APITAL
S
TRUCTURE
:
ANALYSIS
FOR THE
P
ORTUGUESE AND
S
PANISH
S
TOCK
I
NDICES
J
OÃO
F
ILIPE
D
A
C
RUZ
R
IBEIRO
S
UPERVISOR:
M
ARIAJ
OÃOG
UEDESI
Abstract
This dissertation aims to verify what is and if there is an impact of corporate governance on capital structure decisions. This is an approach for the Iberian Peninsula, using data of the Portuguese and Spanish companies listed on the Portuguese Stock Market (PSI 20) and Spanish Stock Market (IBEX 35). The selected firms were analyzed considering a 5-year period, from 2009 to 2013. The empirical results showed a statistically positive significant relationship only between the Debt Intensity and the number of board meetings held per year. However, when considering the Debt-to-Equity there was no statistically significant association with any independent variable.
Keywords: Corporate Governance, Capital Structure, Board Characteristics,
II
Acknowledgements
The execution of this dissertation has proved to be a very demanding and interesting journey. This work would not be possible without all the support of my family and friends.
I would like to express my deepest gratitude to my supervisor, Professor Maria João Guedes for her patience, care, time, knowledge and devotion. This undoubtedly contributed for a better final outcome. All errors are my own.
III
List of Abbreviations
AEM – Associação de Empresas Emitentes de Valores Cotados em Mercado
CMVM – Comissão do Mercado de Valores Mobiliários
CNMV – Comisión Nacional del Mercado de Valores EU – European Union
FE – Fixed Effects
IBEX 35 –Iberia Index
IPCG – Instituto Português de Corporate Governance
OECD – Organisation for Economic Co-operation and Development
OLS – Ordinary Least Squares
PSI 20 –Portuguese Stock index
IV
List of Tables and Figures
Table I – Expected signals for the Independent Variables
Table II – Descriptive statistics of variables for Portuguese and Spanish
companies
Table III – Pearson Correlation Matrix for PSI 20 and IBEX 35 companies
Table IV –Hausman Test
Table V – Results of the Regression Model for Debt-to-Equity
Table VI – Results of the Regression Model for Debt Intensity
Figure 1 – Representation of women and men on the boards of large listed
companies, April 2013
Figure 2 – Change in the share of women and men on boards by country,
October 2010-April 2013
Table VII – Descriptive statistics of variables for PSI 20 companies
Table VIII – Descriptive statistics of variables for IBEX 35 companies
Table IX – Pearson Correlation Matrix for PSI 20 companies
V
Contents
1. Introduction ... 1
2. Literature Review ... 3
2.1 Corporate Governance ... 3
2.1.1 Context and definition ... 3
2.1.2 Agency theory ... 4
2.1.3 Corporate Governance in Portugal ... 5
2.1.4 Corporate Governance in Spain ... 7
2.2 Board Characteristics and Capital Structure ... 8
2.2.1 Board Size ... 8
2.2.2 Board Independence ... 10
2.2.3 Women on Board ... 11
2.2.4 CEO-Chairman Duality ... 12
2.2.5 Number of Board Meetings ... 13
3. Data description and Methodology ... 14
3.1 Research data ... 14 3.2 Definition of Variables ... 14 3.2.1 Dependent Variables ... 14 3.2.2 Independent Variables ... 15 3.2.3 Control Variables ... 17 3.3 Methodology ... 17 3.3.1 Model ... 18
3.3.2 Summary of Expected Signals ... 19
4. Analysis and discussion of Empirical Results ... 20
4.1 Descriptive Statistics ... 20
4.2 Correlation Analysis ... 22
4.3 Regression Analysis Results ... 24
5. Conclusions, Limitations and Future Research ... 27
5.1 Conclusions ... 27
5.2 Limitations of the study and Further Research... 28
1
1. Introduction
Corporate governance is considered nowadays a critical mechanism of firm’s development and growth. The emergence of several recent collapses of companies such as Enron, Tyco, WorldCom or Parmalat, per example, enhanced the need of attention of corporate governance. These scandals alerted for the importance and magnitude associated to this topic. Following these events, the McKinsey & Company released in 2002 the Global Investor Opinion Survey aiming to indicate which are the most priority areas of corporate governance towards a general evolution. The release of this report showed how much investors value this subject. According to this survey, investors consider corporate governance and financial indicators equally important when evaluating investment decisions. A great percentage of these investors are willing to pay a premium for firms with higher levels of governance.
The majority of previous studies on corporate governance focus on the impact of its mechanisms on the performance of the companies (Hermalin & Weisbach, 1991; Bhagat & Black, 2002 or Yermack, 1996 per example). Regarding the impact of corporate governance on firm’s capital structure decisions there are few studies. This area is even less explored if we consider the analysis of European companies.
Modigliani & Miller (1958) suggested the capital structure irrelevance principle, which means that there is not a relationship between the way a company is financed and its value. Following this study a large number of authors developed several studies and theories focused on capital structure decision
2
and on its influencing elements. The trade-off and pecking order theories are some of the tested capital structure theories.
The purpose of this study is to verify the impact of the selected corporate governance mechanisms on firm’s capital structure. The selected mechanisms are related with the board of directors, namely the Board Size, the Board Independence, the proportion of Women on Board, the CEO-Chairman Duality and the Number of Board Meetings. The capital structure variables used on this dissertation are the Debt-to-Equity and the Debt Intensity.
Using Debt-to-Equity ratio it was verified that none of the independent variables under analysis was statistically significant. On the other hand, when considering the other dependent variable -Debt Intensity- it was possible to observe statistically significant relationships. In this case, the Number of Board Meetings showed a positive significant relationship which means that the higher the number of meetings held in a year the higher the value for Debt Intensity.
The structure of this dissertation is organized in five sections. The first section is the introduction, in order to frame the topic in analysis and to explain the dissertation’s purpose. The second section consists on the literature review of the previous relevant papers about this subject. In the third and fourth sections it is described the data, the variables used, the methodology employed and also the discussion of the empirical results. The final section concludes and presents the review of the limitations and suggestions for future research on this area.
3
2. Literature Review
2.1 Corporate Governance 2.1.1 Context and definition
The concept of corporate governance has been a very prominent topic over the past decades. The emergence of some relevant financial scandals as previously referred, together with the financial crisis in 2008 enhanced the importance of corporate governance worldwide. This was verified by the need of establishing some recommendations in codes such as Cadbury, in 1992, and Sarbanes-Oxley Act in 2002 in the US.
Corporate governance is defined in the Cadbury Report (1992, p.15) as “the system by which companies are directed and controlled”. The Organisation for Economic Co-operation and Development (OECD) (2004, p.11) also contributed with the publication of corporate governance principles and defines it as “a set of relationships between a company’s management, its board, its shareholders and other stakeholders. Corporate governance also provides the structure through which the objectives of the company are set, and the means of attaining those objectives and monitoring performance are determined”. Shleifer & Vishny (1997, p.737) assert that corporate governance “deals with the ways in which suppliers of finance to corporations assure themselves of getting a return on their investment”.
In Portugal, the Portuguese Securities Market Commission, the Comissão do Mercado de Valores Mobiliários (CMVM) (2005, p.1) believes that Corporate Governance is “the system of rules and codes of conduct relating to the management and control of companies.”
4
2.1.2 Agency theory
Berle & Means in 1932 with The Modern Corporation and Private Property triggered the study and development of an extensive literature about agency problems. They argued that there is a clear separation between ownership and control, since the interests of managers are not fully aligned with the interests of the owners of the company.
Berle & Means (1932, p.64) focused on the inability of the owners to influence its property stating that “the position of ownership has changed from that of an active to that of a passive agent. In place of actual physical properties over which the owner could exercise direction and for which he was responsible, the owner now holds a piece of paper representing a set of rights and expectations to an enterprise.(…) The owner is practically powerless through his own efforts to affect the underlying property. The spiritual values that formerly went with the ownership have been separated from it”.
Managers should act in a way to provide the maximization of returns to shareholders, through the increasing of profits and cash flows, in order to ensure that its interests are accomplished (Elliot, 2002). Nevertheless, following the work of Berle & Means (1932), Jensen & Meckling (1976, p.308) developed the agency theory considering that “an agency relationship is a contract under which one or more persons (the principal(s) engage another person (the agent) to perform some service on their behalf which involves delegating some decision making authority to the agent”.
The authors focus on the contract between the two parties and explain the gap between the interests of the owner and the interests of the manager. They show
5
that managers tend to put less effort on the creation of value to the company as more equity is held by external investors. This creates a problem and conflict between ownership and control.
Considering the agency problem, Shleifer & Vishny (1997) view this as a crucial element to the contracts. However they highlight the impossibility of writing complete contracts and the effects that derive from it. Three reasons may be listed for incomplete contracts, the difficulty to plan and predict accurately, the hard negotiation that the contracts may imply and possible difficulty of interpretation and enforcement by a third party (Hart, 1995). Aghion & Bolton (1992) refer that this topic of contractual incompleteness leads us again to the core issue, since due to this disagreements between the owner and the manager will always subsist.
Himmelberg, Hubbard & Palia (1999) stated that agency problems are not the same and differ from firms, industries and cultures. McColgan (2001) supported this view and managed to continue the study of the principal-agent relationship and the costs that arise from it. The author argues that effective corporate governance mechanisms may contribute to help reducing those costs and that this governance may be shaped in line with the company environment.
2.1.3 Corporate Governance in Portugal
According to the OECD Principles of Corporate Governance (2004, p.13), “there is no single model of good corporate governance”. However, it is possible to identify and suggest several factors and elements that may contribute to proper governance. The highlight associated with the theme of corporate governance
6
and its importance lead to the emergence of certain best practices codes and other documents in several countries.
In Portugal, in order to follow the OECD principles of corporate governance released in 1999, the CMVM also disclosed that same year a set of recommendations towards good corporate governance practices addressed to the Portuguese listed companies. The introduction of this code has undergone several changes and adjustments since 1999, which aimed to inform the market about the degree of compliance. Subsequently, it was introduced other information requirements like the denominated Comply or Explain principle. The main legislation regarding Portuguese institutions concerning the domain of corporate governance are the Portuguese Commercial Companies Code and the Portuguese Securities Code (Câmara, 2001). The first document aims to establish the principles and rules regarding the direction and control of commercial companies1. This code is focused on matters such as the composition, management, duties and competences of the management bodies, the rights and deliberations of the shareholders and also the companies’ supervision.
The Portuguese Securities Code sets the rules applicable to the markets and related activities. It covers matters such as information disclosure duties or investors’ protection.
Also, the Instituto Português de Corporate Governance (IPCG) published in 2006 a document entitled Livro Branco sobre Corporate Governance em
Portugal whose purpose was to provide a pedagogical instrument about
1
This is not only addressed to the listed companies but rather to the five existing types of commercial companies: Limited Liability Company, Public Limited Liability Company, General Partnership, Limited Partnership, Limited Partnership with Share Capital.
7
corporate governance and its evolution and also to point a set of best practices towards greater governance efficiency. More recently the IPCG published on 30 January 2013 a Corporate Governance Code with best practices on this subject, being an alternative to the CMVM code.
The Universidade Católica Portuguesa at the request of the Associação de Empresas Emitentes de Valores Cotados em Mercado (AEM), developed annual reports regarding corporate governance in Portugal. According to these reports Portuguese companies have been following a positive trend concerning the degree of compliance, showing a notorious improvement on their practices of governance.
2.1.4 Corporate Governance in Spain
Similarly to what occurs in Portugal, corporate governance in Spain is regulated by the corporate legislation, composed by the Companies Law and also by the Securities Market Law, which is more directed and related with corporate governance practices.
Feeling the need and importance of improving and stabilize the governance of the Spanish listed firms the Olivencia Committee drafted the first code in Spain, focused on the board of directors. It was denominated as Olivencia Code of Corporate Governance and it was published in 1998. This was about the same time that the OECD disclosed the first code of corporate governance principles. It shows how critical this period was for the reformulation of corporate governance worldwide.
In 2003, the Aldama Code was created by the Aldama Committee and extended the scope of the first code. Although the characteristic of voluntariness, subject
8
to the principle of Comply or Explain, there was a greater control and stiffness over the companies in order to force them to act according to the compulsory legislation.
The last and current version of the code adopted in Spain for corporate governance related issues was presented in 2006. This code, entitled as the Unified Code, takes into account the recommendations of the previous two codes (Olivencia and Aldama codes).
As stated by Paredes (2013), one can verify that in 2011 there is a very significant degree of compliance with the recommendations of the Unified Code by the Spanish companies. Considering all the Spanish listed companies, 81.3 per cent of the recommendations were complied with and 7.6 per cent of the recommendations were partially complied with. If we consider only the companies included in the Iberia Index (IBEX 35), the Spanish Stock Index, the numbers were comprehensibly better, with only 4.7 per cent of the recommendations that were not complied with.
2.2 Board Characteristics and Capital Structure 2.2.1 Board Size
Board size has been considered in several studies along the years as absolutely pivotal regarding the level of effectiveness of corporate governance (Lipton & Lorsch, 1992; Jensen, 1993; Wen et al., 2002).
Fama & Jensen (1983) and Bhagat & Black (1999) have complementary views on how firm size may influence its board size. These authors consider that the more complex the operations and processes the greater the demand for board members. This is explained by the need to monitor managers’ decisions and
9
also the need for particular services. This views are consistent with previous findings (Yermack, 1996) that points to a positively relationship between board size and firm size.
In contrast, Lipton & Lorsch (1992) argue that a larger board may lead to less effectiveness when comparing to a smaller board. In other words, a larger board may cause problems regarding coordination despite the diversity of knowledge associated.
Some authors have even recommended a preferred number for the limit of the board size having a similar opinion on the subject. Cadbury (1992) suggested a board size between eight and ten directors, while Lipton & Lorsch (1992) also recommend a limit of ten directors, rather eight or nine. Jensen (1993) believes that the board size should not exceed seven or eight members.
Pfeffer & Salancick (1978) and Lipton & Lorsch (1992), suggest that there is a significant relationship between capital structure and board size. In line, Berger
et al. (1997) assert that larger boards are associated with lower levels of
leverage.
Wen et al. (2002) finds positive but insignificant relationship between board size and capital structure2. Thus, it is proposed the following:
Hypothesis 1: There is a positive relationship between the Board Size and leverage (Debt-to-Equity and Debt Intensity)
2
According to Anderson et al. (2004) larger boards may benefit from lower cost of debt, due to a more effective monitoring perceived by the lenders.
10
2.2.2 Board Independence
The degree of independence of the board of directors is a core topic on corporate governance. This variable is considered one of the most important board characteristics due to its impact on the firm. Board Independence is guaranteed when there are a significant proportion of directors that do not work or have worked in the company and neither has or had business relationships directly or indirectly.
The increase of board independence has been generally encouraged as a way to improve board monitoring. The CMVM recommends to the Portuguese listed companies the existence of a minimum of 25% of independent directors on the board. In Spain, the recommendation of the Spanish Securities and Exchange Commission, the Comisión Nacional del Mercado de Valores (CNMV) targets for a minimum of 1/3 of independent directors of the total number of directors on the board.
Weisbach (1988) considers that the monitoring over top managers is more intense when there is a presence of outside or independent directors, which is also reinforced by Berger et al. (1997).
Ferreira et al. (2012) found a significantly positive relationship between leverage and the number of independent directors. Anderson et al. (2004) also studied this variable and suggested that Board Independence is negatively related with debt financing costs. This is an interesting conclusion since it allows us to predict that this may lead to higher leverage due to a cheapest access to debt financing by the companies. Having in mind these empirical studies, it is hypothesized the following:
11
Hypothesis 2: There is a positive relationship between Board Independence and leverage (Debt-to-Equity and Debt Intensity)
2.2.3 Women on Board
Board diversity and specifically gender diversity on the boardroom has been a recurring theme concerning corporate governance, subject to intensive debate. Some guidelines and requirements have even been disclosed in order to attenuate the distribution of corporate board seats for male and female directors. The search for more diversity is, according to Carter et al. (2007), due to concerns of equality and fairness. These authors also consider that a diversified board enhances board independence and consequently managers’ monitoring3.
Spain is one of the few European countries who actually have introduced strong policies concerning gender equality. In 2007, the Spanish government implemented the Equality Law which required listed companies to have 40 per cent female board representation by 2015. Also, CNMV recommends listed companies to include women with the required backgrounds on their boards. Figure 1 and Figure 2 in Appendix establish a comparison between the European Union (EU) countries regarding the representation of females on corporate boards and its evolution over the last years. Spain presents better levels of gender equality comparing to Portugal, being closer to the EU average. However, both countries have still to perform significant developments in order to approach the required gender balance. Grechaniuk (2009), found a negative
3
Board diversity is also likely to improve creativity, innovation, and to provide different perspectives contributing to increase effectiveness (Carter et al., 2003;van der Walt &Ingley, 2003)
12
and statistically significant relationship between the share of women in the executive board and the corporate capital structure. Thus, one can assume that women are more risk-averse, borrowing less money on behalf of the company.
Hypothesis 3: There is a negative relationship between the proportion of Women on the Board and leverage (Debt-to-Equity and Debt Intensity)
2.2.4 CEO-Chairman Duality
The role of CEO and Chairman position by the same or different individuals is referred as CEO-Chairman Duality. Fama & Jensen (1983) discussed about this topic focusing on the separation between decision management and decision control4. The authors believe that a two-tier leadership5 is able to enhance board’s effectiveness, separating decision management and decision control components. Several authors (e.g. Brickley et al., 1997; Berg & Smith, 1978) consider that a one-tier leadership is more likely to cause agency problems. Fosberg (2004), although with statistically insignificant results, considers that companies with the two-tier structure generally have higher Debt-to-Equity ratios and are more likely to employ the optimal amount of debt in the capital structure. This may be related with the reduction of conflicts of interests and agency problems and therefore enhances the possibility of external credit. Abor (2007) also finds positive but insignificant relationship between leverage and CEO duality. Therefore, it is proposed the following:
4 Decision management and decision control are part of the firm’s decision process. According to Fama &
Jensen (1983) decision management are related with the functions of initiation and implementation of decisions and decision control with the part of ratification and monitoring of those decisions.
5
13
Hypothesis 4: There is a positive relationship between the CEO-Chairman Duality and leverage (Debt-to-Equity and Debt Intensity)
2.2.5 Number of Board Meetings
The frequency of Board Meetings has been considered as an important element to guarantee the effectiveness of the board and its monitoring (Vafeas, 1999; Conger et al., 1998). Higher frequency of Board Meetings allows for better monitoring, to receive important information about the company and also plays a role on firm’s decisions. In Portugal and Spain it is even mandatory by the Portuguese (CMVM) and Spanish (CNMV) Securities and Exchange Commission for the companies to disclose the number of meetings held during the exercise.
There are few studies including this variable when studying the impact of corporate governance on firm’s capital structure decisions. The existing studies are more focused on developing countries. Achchuthan et al. (2013) state that the impact of the number of Board Meetings on the capital structure is not significant. Rehman et al. (2010) considered several variables including Board Meetings frequency as proxy for corporate governance. These authors found that there is a positive but weak relationship between capital structure and corporate governance. It is proposed the following:
Hypothesis 5: There is a positive relationship between the Number of Board Meetings and leverage (Debt-to-Equity and Debt Intensity)
14
3. Data description and Methodology
3.1 Research data
The sample for this analysis comprises 55 firms: 20 that were listed on the Portuguese Stock Market (PSI 20) and 35 that were listed on the Spanish Stock Market (IBEX 35) at the end of 2013. The selected firms were analyzed using an unbalanced panel considering a 5-year period, from 2009 to 2013, with a total of 269 observations.
Thus, this dissertation do not consider the changes occurred in the composition of the indices but rather aims to focus on the companies that were included at the end of the selected period. The data was collected from the annual reports and accounts and from the governance reports of each of the selected firms.
3.2 Definition of Variables
This dissertation aims to verify the impact of some corporate governance mechanisms on capital structure of the firms. Using a multiple linear regression, the selected mechanisms are the board size, the percentage of independent directors and of women on the board, CEO duality and the number of board meetings. Considered as dependent variables are the Debt-to-Equity and the Debt Intensity, being also included control variables such as the age of the company, the number of employees and the sector of the firm.
3.2.1 Dependent Variables Debt-to-Equity (DE)
The DE ratio is used to see the capital structure of a firm (Fosberg, 2004). It is an indicator that measures the company’s financial leverage. It expresses the
15
relationship between the financing that comes from creditors and the financing that comes from investors (shareholders). Usually, a firm with higher DE ratio is viewed as being riskier since it relies more on creditors and may not be able to fulfil its obligations. The DE ratio is represented as the following:
𝐷𝐸 𝑟𝑎𝑡𝑖𝑜 =
𝑇𝑜𝑡𝑎𝑙 𝐷𝑒𝑏𝑡
𝑛𝑆ℎ𝑎𝑟𝑒ℎ𝑜𝑙𝑑𝑒𝑟𝑠
′𝐸𝑞𝑢𝑖𝑡𝑦
𝑛
Debt Intensity (DI)
The present Debt Intensity ratio is an alternative measure to the previously referred DE ratio to express the leverage of a company. This indicator measures the percentage of the total assets of the firm that is financed by the creditors. In this case, the higher the DI ratio is the greater the leverage of the firm and therefore implies more risk. The DI ratio is represented as the following:
𝐷𝐼 𝑟𝑎𝑡𝑖𝑜 =
𝑇𝑜𝑡𝑎𝑙 𝐷𝑒𝑏𝑡
𝑛𝑇𝑜𝑡𝑎𝑙𝐴𝑠𝑠𝑒𝑡𝑠
𝑛This variable was used by several authors such as Wen et al. (2002), Ferreira
et al. (2012) and Berger et al. (1997).
3.2.2 Independent Variables Board Size (BS)
This variable refers to the total number of board members, comprising the executive and non-executive directors.
This variable has previously been used in the literature by authors such as Pfeffer & Salancick (1978), Lipton & Lorsch (1992), Berger et al. (1997) or Wen
16
Board Independence (BI)
The independence of the board is measured as the ratio between the total number of independent directors and the total number of directors, representing the proportion of independent directors on board.
Board independence has been used by several authors including Anderson et
al. (2004), Berger et al. (1997) and Ferreira et al. (2012).
Women on Board (WB)
It reflects the proportion of women on board, and therefore corresponds to the ratio between the total number of women on board and the total number of board directors.
CEO-Chairman Duality (CC)
This variable is a dummy that equals to 1 if the CEO is also the Chairman of the company and 0 if otherwise.
Fosberg (2004) and Abor (2007) were some of the authors who used this variable.
Number of Board Meetings (BM)
It corresponds to the total number of meetings held by the board in a year. There are few authors who use this variable on their analysis. Achchuthan et al. (2013) and Rehman et al. (2010) used BM on their studies for developing countries.
17
3.2.3 Control Variables Age (A)
This control variable is referred as the number of years of existence of the company.
Size (SI)
The variable of size corresponds to the natural logarithm of the number of the company’s employees.
Sector (SE)
Each company is included in a specific sector that is constituted by a group of companies that fall within the same market with the same or similar activities. This variable is regarded as a dummy variable in this model.
3.3 Methodology
The purpose of this dissertation is to investigate the relationship between some characteristics of the board and the capital structure of some of the listed Portuguese and Spanish firms for the 2009-2013 period.
The analysis was performed using a multiple linear regression model using StataIC 12 software. The panel data in question is considered unbalanced, which means that there are no observations for some time periods in determined firms. At the time of the collection of the information not all companies had disclosed all the required data, which explains the unbalanced panel.
18
3.3.1 Model
The following equations represent the models to estimate:
𝐷𝐸𝑖𝑡 = 𝛼 + 𝛽1𝐵𝑆𝑖𝑡+ 𝛽2𝐼𝐷𝑖𝑡+ 𝛽3𝑊𝐵𝑖𝑡 + 𝛽4𝐶𝐶𝑖𝑡+ 𝛽5𝐵𝑀𝑖𝑡 + 𝛽6𝐴𝑖𝑡+ 𝛽7𝑆𝐼𝑖𝑡 + 𝛽8𝑆𝐸𝑖𝑡+ 𝜀𝑖𝑡 (1) 𝐷𝐼𝑖𝑡 = 𝛼 + 𝛽1𝐵𝑆𝑖𝑡 + 𝛽2𝐼𝐷𝑖𝑡 + 𝛽3𝑊𝐵𝑖𝑡 + 𝛽4𝐶𝐶𝑖𝑡 + 𝛽5𝐵𝑀𝑖𝑡+ 𝛽6𝐴𝑖𝑡 + 𝛽7𝑆𝐼𝑖𝑡+ 𝛽8𝑆𝐸𝑖𝑡 + 𝜀𝑖𝑡 (2)
Regarding equations (1) and (2), we consideri = 1,2,...55 for the total number of
companies of both indices and t = 2009, 2010, 2011, 2012, 2013 that concerns the years concerned.
As noted, the dependent variable is different in each of the two models considering on the first model the DE (equation 1) and on the second model the DI (equation 2). Both models include the independent variables (BS, ID, WB, CC, BM) and control variables (A, SI, SE).
In equation (1) and (2), α is the constant term, the β’s are unknown parameters and represent the coefficients for the explanatory variables (or independent variables). Finally, ε is the error term or the residual, and it represents the difference between an actual and a predicted value for the dependent variable. The estimation was performed using the Ordinary Least Squares (OLS), the Fixed Effects (FE) and the Random Effects (RE) methods. The OLS is more restrictive than the other two methods, considering a constant individual effect. It also assumes that the error term and the independent or explanatory variables are uncorrelated.
FE method considers that there are multiple constants (α is different for each individual), thus it assumes that these individuals are heterogeneous which means that their characteristics should not be correlated. Aiming to remove the
19
individual’s time-invariant characteristics, the FE assumes the correlation between the error term and the independent variables.
Regarding the RE method, unlike the FE, the unobserved individual heterogeneity (or individual effect) is considered random and uncorrelated with the independent variables. Greene (2008) believes that the main difference between FE and RE is based on the existence (or not) of correlation between the elements integrated on the unobserved individual effect and the independent variables and not on the degree of randomness of these effects. The Hausman test (Hausman, 1978) is performed in order to decide whether to use FE or RE. It verifies which model is the most efficient, making sure of the consistency of the results of both models. The null hypothesis is that there is no correlation between the specific errors and the independent variables (RE is the more suitable model) and the alternative states the opposite (FE is the more suitable model).
All the regressions were performed using robust standard errors. The main purpose for this option is to prevent heteroscedasticity.
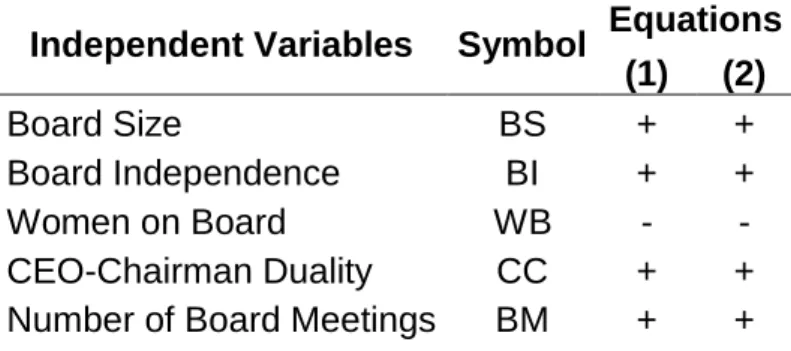
3.3.2 Summary of Expected Signals
Table I – Expected signals for the Independent Variables
Independent Variables Symbol Equations
(1) (2)
Board Size BS + +
Board Independence BI + +
Women on Board WB - -
CEO-Chairman Duality CC + +
20
4. Analysis and discussion of Empirical Results
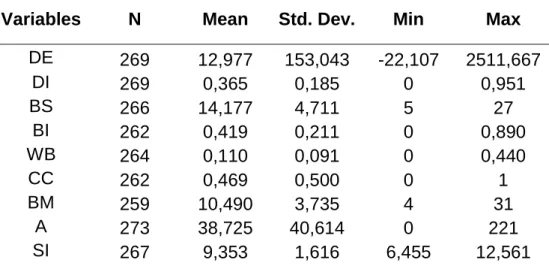
4.1 Descriptive Statistics
The descriptive statistics of the dependent, independent and control variables for the combined companies of PSI 20 and IBEX 35 are presented on Table II.
Table II – Descriptive statistics of variables for Portuguese and Spanish companies
Variables N Mean Std. Dev. Min Max
DE 269 12,977 153,043 -22,107 2511,667 DI 269 0,365 0,185 0 0,951 BS 266 14,177 4,711 5 27 BI 262 0,419 0,211 0 0,890 WB 264 0,110 0,091 0 0,440 CC 262 0,469 0,500 0 1 BM 259 10,490 3,735 4 31 A 273 38,725 40,614 0 221 SI 267 9,353 1,616 6,455 12,561
Notes: DE = Total Debt / Total Shareholder's Equity; DI = Total Debt / Total Assets; BS: Total number of directors; BI: Percentage of the board composed by independent directors; WB: Percentage of the board composed by women; CC: Considered as a dummy variable, in order to assess if the CEO and the Chairman are the same person or not; BM: Number of meetings held by the board per year; A: Number of years of existence of the company; SI: Natural logarithm of the number of firm's employees.
The Mean of the DE ratio is 12,977, which is a significantly high value. This figure can be explained by the high percentage of companies that belong to the banking sector and to the heavy construction sector. These sectors typically use a greater amount of debt comparing to other industries and sectors.
The DI ratio shows considerably lower values than the previously referred for the DE ratio. The mean of DI is 0,365, with a relatively low value for Standard Deviation which is 0,185. Board Size has a Mean of 14,177 directors per board. Recalling what was previously observed on the Literature Review we can verify that this value is considerably higher than the eight to ten board members range
21
pointed as ideal by several authors. However, looking for the values of Minimum of 5 and Maximum of 27 we can observe a great disparity of values, which is reinforced by the Standard Deviation of 4,711. Companies from the financial sector tend to have higher number of board directors comparing to the other sectors.
The Mean of the proportion of Women on Board is 0,110, a very low value considering the objective of attenuate the actual differences and to promote gender equality6.
Regarding the CEO-Chairman Duality the values allow us to conclude that there is not a clear trend followed by the companies included in both indices. The total Mean is 0,469 and the Standard Deviation of 0,500 which means that the proportion of companies with one-tier leadership and two-tier leadership is almost the same.
The Number of Board Meetings variable shows a Mean of 10,490, a Standard Deviation of 3,735 and ranges between 4 and 31.
Regarding the control variables, the Mean of Age is 38,7 years, ranging from a Maximum of 221 and a Minimum of 07. The variable Size has a Mean value of 9,353. Considering specifically the Mean of the number of employees the value is 35.310 employees.
Tables VII and VIII in Appendix show the differences between the values of the companies included on PSI 20 and IBEX 35. Summarizing, we can verify that the Mean of the Debt-to-Equity ratio is much higher in Spain, contrary to the
6 On March 2011 the European Comission released the “Women on the Board Pledge for Europe” which
aimed to increase the proportion of women on corporate boards to 30% by 2015 and 40% by 2020.
7
This value is related with the Spanish bank Bankia. This company was formed in 2010, during the period under review, which explains the value of 0.
22
variable of Debt Intensity which is generally higher in Portugal. The Mean of Board Size is similar in both cases but it is notorious that the values for the Portuguese Index are more disperse. The Spanish companies show generally higher levels of Board Independence and of presence of Women on Board. This can be explained by the imposition of quotas concerning female representation on the board. In Portugal it is verified more predominance of one-tier leaderships comparing to Spain. It is also noted that Spanish companies are generally bigger and hold more meetings but on the other hand are younger than Portuguese companies.
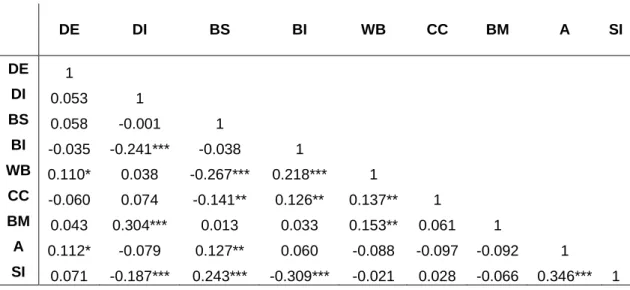
4.2 Correlation Analysis
Table III shows the coefficients correlation between the variables in analysis.
Table III – Pearson Correlation Matrix for PSI 20 and IBEX 35 companies
DE DI BS BI WB CC BM A SI DE 1 DI 0.053 1 BS 0.058 -0.001 1 BI -0.035 -0.241*** -0.038 1 WB 0.110* 0.038 -0.267*** 0.218*** 1 CC -0.060 0.074 -0.141** 0.126** 0.137** 1 BM 0.043 0.304*** 0.013 0.033 0.153** 0.061 1 A 0.112* -0.079 0.127** 0.060 -0.088 -0.097 -0.092 1 SI 0.071 -0.187*** 0.243*** -0.309*** -0.021 0.028 -0.066 0.346*** 1
Notes: DE = Total Debt / Total Shareholder's Equity; DI = Total Debt / Total Assets; BS: Total number of directors; BI: Percentage of the board composed by independent directors; WB: Percentage of the board composed by women; CC: Considered as a dummy variable, in order to assess if the CEO and the Chairman are the same person or not; BM: Number of meetings held by the board per year; A: Number of years of existence of the company; SI: Natural logarithm of the number of firm's employees.
23
Not all variables are statistically correlated, but there are some important correlations to highlight. According to the matrix it is possible to verify little8 positive and significant (level of 10%) correlation between the dependent variable Debt-to-Equity and the proportion of Women on Board.
The other dependent variable Debt Intensity shows significantly negative but still little correlation with Board Independence and also with Size. This variable verifies also a significantly positive low correlation with the independent variable Number of Board Meetings.
Board Size presents significantly negative little correlation with the proportion of Women on Board and also with CEO-Chairman Duality, but in this case at a significance level of 5%. It is also verified a significantly positive little correlation between Board Size and Size and a positive little correlation between Board Size and Age at a significance level of 5%.
The variable that is referred to Board Independence shows significantly positive little correlation with the proportion of Women on Board and positive little correlation with CEO-Chairman Duality at a significance level of 5%. It also shows a significantly negative low correlation with Size.
The Women on Board variable presents a positive little correlation at a significance level of 5% with CEO-Chairman Duality and Number of Board Meetings. Finally, there is a significantly positive low correlation between the control variables Age and Size.
8
The interpretation of the correlation coefficient applied is the suggested by Hinkle, Wiersma, &Jurs (2003). According to these authors,positive or negative values between 0 and 0,3 indicate little if any correlation, values between 0,3 and 0,5 indicate low correlation, values between 0,5 and 0,7 indicate moderate correlation, values between 0,7 and 0,9 indicate high correlation and values between 0,9 and 1 indicate very high correlation.
24
Tables IX and X in Appendix show the existent correlations between the variables for each index. Looking at each matrix is possible to verify that there are few correlated variables on the IBEX 35, contrary to what is shown on the PSI 20.
4.3 Regression Analysis Results
In order to assess which is the most efficient model to use, between the Fixed Effects model and the Random Effects model, for each of the dependent variables, it was applied the Hausman Test. The application of this test provided the required output presented on Table IV.
Table IV – Hausman Test
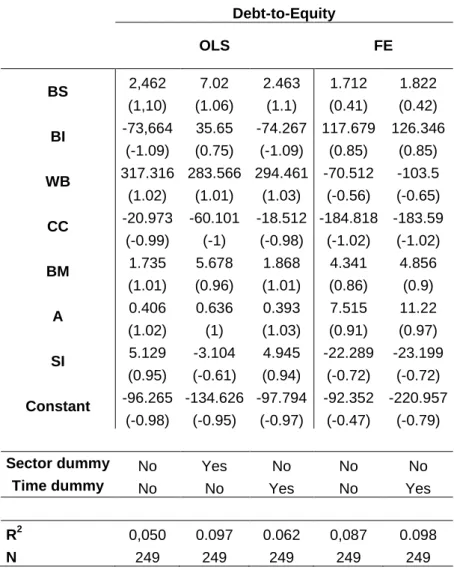
The results suggest that the most suitable model for both of the dependent variables is the FE. In both cases we can verify that the p-value is lower than 0,05, which leads us to reject the null hypothesis, or in other words to reject the RE model and to use the FE model. Tables V and VI show the results of the multiple regression analysis, considering OLS model and FE model and also sector and time dummies as indicated on the table.
The results presented on Table V show that there is not a statistically significant relationship between the dependent variable Debt-to-Equity and the other variables in analysis. This conclusion is valid for both models, the OLS model
Dependent Variables X2 Prob> X2
Debt-to-Equity 17,84 0,0127 Debt Intensity 22,75 0,0019
25
and the FE model. We can also observe that the R2 is low in all the regressions, which means that the model explains little of the data variation.
Table V – Results of the Regression Model for Debt-to-Equity Debt-to-Equity OLS FE BS 2,462 7.02 2.463 1.712 1.822 (1,10) (1.06) (1.1) (0.41) (0.42) BI -73,664 35.65 -74.267 117.679 126.346 (-1.09) (0.75) (-1.09) (0.85) (0.85) WB 317.316 283.566 294.461 -70.512 -103.5 (1.02) (1.01) (1.03) (-0.56) (-0.65) CC -20.973 -60.101 -18.512 -184.818 -183.59 (-0.99) (-1) (-0.98) (-1.02) (-1.02) BM 1.735 5.678 1.868 4.341 4.856 (1.01) (0.96) (1.01) (0.86) (0.9) A 0.406 0.636 0.393 7.515 11.22 (1.02) (1) (1.03) (0.91) (0.97) SI 5.129 -3.104 4.945 -22.289 -23.199 (0.95) (-0.61) (0.94) (-0.72) (-0.72) Constant -96.265 -134.626 -97.794 -92.352 -220.957 (-0.98) (-0.95) (-0.97) (-0.47) (-0.79)
Sector dummy No Yes No No No
Time dummy No No Yes No Yes
R2 0,050 0.097 0.062 0,087 0.098
N 249 249 249 249 249
Notes: BS: Total number of directors; BI: Percentage of the board composed by independent directors; WB: Percentage of the board composed by women; CC: Considered as a dummy variable, in order to assess if the CEO and the Chairman are the same person or not; BM: Number of meetings held by the board per year; A: Number of years of existence of the company; S: Natural logarithm of the number of firm's employees.
Values between parentheses reflect the t-statistics.
*, ** and ***, indicate statistical significance of 10%, 5% and 1%.
On Table VI are presented the regression results considering the dependent variable Debt Intensity. The results reveal that there is a significant relationship between Debt Intensity and the Number of Board Meetings and also between
26
Debt Intensity and the variable of control Age. This means that the bigger the Number of Board Meetings the higher is the Debt Intensity ratio of the company. Higher monitoring, higher knowledge and full awareness about the situation of the company, may enhance a riskier approach by the board of directors.
Table VI– Results of the Regression Model for Debt Intensity Debt Intensity OLS FE BS 0.0004 0.005 0.0004 0.001 0.001 (0.19) (1.55) (0.17) (0.22) (0.24) BI -0.208*** -0.089 -0.207*** 0.007 0.002 (-4.10) (-1.31) (-4.08) (0.09) (0.03) WB 0.047 0.044 0.074 0.016 0.032 (0.43) (0.39) (0.65) (0.12) (0.23) CC 0.028 0.068*** 0.025 0.023 0.024 (1.23) (3.13) (1.1) (1.15) (1.14) BM 0.015*** 0.015*** 0.015*** 0.007*** 0.007*** (5.72) (4.5) (5.69) (3.31) (3.21) A 0.0001 0.0002 0.0001 -0.011** -0.012* (0.58) (0.79) (0.64) (-2.34) (-2.67) SI -0.014* -0.029*** -0.014 -0.006 -0.005 (-1.68) (-3.2) (-1.63) (-0.39) (-0.3) Constant 0.404*** 0.669*** 0.418*** 0.736*** 0.789*** (5.50) (7.24) (5.56) (3.81) (4.05)
Sector dummy No Yes No No No
Time dummy No No Yes No Yes
R2 0.178 0.671 0.186 0.130 0.140
N 249 249 249 249 249
Notes: BS: Total number of directors; BI: Percentage of the board composed by independent directors; WB: Percentage of the board composed by women; CC: Considered as a dummy variable, in order to assess if the CEO and the Chairman are the same person or not; BM: Number of meetings held by the board per year; A: Number of years of existence of the company; S: Natural logarithm of the number of firm's employees.
Values between parentheses reflect the t-statistics.
27
It is verified that on the first regression there is not a significant relationship between Debt-to-Equity and the independent variables. This prevents to support the formulated hypothesis based on the past literature concerning this topic. On the opposite, when considering the dependent variable Debt Intensity, there is a significant positive relationship with the explanatory variable Number of Board Meetings. This finding supports the hypothesis formulated. Similar results were found by Rehman et al. (2010).
5. Conclusions, Limitations and Future Research
5.1 Conclusions
In this dissertation, it is analyzed the impact of some of corporate governance variables, particularly those related with the board of directors, on the company’s capital structure. This study covers a five-year period from 2009 to 2013 and targets the Iberian Peninsula, namely the companies included on the PSI 20 and IBEX 35 at the end of 2013.
It aims to fill an existing gap concerning the relationship between an emergent topic such as corporate governance and a crucial subject regarding corporate decision management like the company’s capital structure. This type of research is not yet properly developed for European countries. Thus, this dissertation intends to provide an overview about how the Portuguese and Spanish corporate governance influences the company’s capital structure. This is a particularly interesting research considering the sensitive economic situation experienced in these countries.
28
The results provided by the multiple linear regression model suggest that leverage, namely Debt Intensity, and the Number Board Meetings held in a year have a positive relationship. This result supports some previous empirical studies on this area (Rehman et al., 2010).
5.2 Limitations of the study and Further Research
Corporate governance variables are difficult to obtain as it is time consuming, if hand collected, or not systematically available in databases. Hence, the database is restricted to listed firms, from Portugal and Spain. A larger dataset, including non-listed firms would certainly enrich the analysis, providing a more comprehensive and perhaps disruptive conclusion. The period of analysis was influenced by some critical and untypical economic situation. This fact may, without any doubt, influence the actual debt structure of the firms but it is not taken into consideration in the present study.
As previously referred, the research related with the association between capital structure and corporate governance is still underdeveloped compared to the amount of studies regarding the impact of corporate governance on the firm’s performance. Having this in mind, it would be interesting to expand the analysis of the effects on capital structure on Europe. This would allow having a broader perception of this relationship on European countries.
This dissertation was focused on some of the board characteristics. It would be also relevant to study other mechanisms such as the remuneration and the ownership structure.
29
6. References
Abor, J. (2007). Corporate Governance and Financing Decisions of Ghanaian Listed Firms. Corporate Governance: International Journal of Business in Society 7(1), 83-92.
Achchuthan, S., Kajananthan, R. & Sivathaasan, N. (2013). Corporate Governance Practices and Capital Structure: A Case in Sri Lanka. International Journal of
Business and Management 8 (21), 114-125.
Aghion, P. & Bolton, P. (1992). An incomplete contracts approach to financial contracting. Review of Economic Studies 59, 473–494.
Aldama Report (2003). Report by the Special Commission to foster transparency and security in the markets and in listed companies.
Anderson, R., Mansi, S. & Reeb, D. (2004). Board Characteristics, Accounting Report Integrity and the Cost of Debt. Journal of Accounting and Economics 37, 315-342.
Berg, S.V. & Smith, S.R. (1978). CEO & Board Chairman: A quantitative study of Dual Vs. Unitary Board leadership. Directors & Boards 3, 34-39.
Berger, P.G, Ofek, E. & Reeb, D. (1997). Managerial Entrenchment and Capital Structure Decisions. Journal of Finance 52(4), 1411-1438.
Berle, A. & Means, C. (1932). The Modern Corporation and Private Property, New York: Macmillan.
Bhagat, S. & Black, B. (1999). The uncertain relationship between board composition and firm performance. Business Lawyer 54, 921-963.
30
Bhagat, S. & Black, B. (2002). The non-correlation between board independence and long term firm performance. Journal of Corporation Law 27, 231-274.
Brickley, J.A., Coles, J.L., & Jarrell, G. (1997). Leadership Structure: Separating the CEO and Chairman of the Board. Journal of Corporate Finance 3(3), 189-220.
Cadbury Report (1992). The Report of the Committee on the Financial Aspects of
Corporate Governance, London: Gee Publishing Ltd.
Câmara, P. (2001). O Governo das Sociedades em Portugal: uma introdução. Caderno
do Mercado de Valores Mobiliários 12, 45-56.
Carter, D.A., D’Souza, F., Simkins, B.J. & Simpson, W.G. (2007). The Diversity of Corporate Board Comitees and Firm Financial Performance. Working paper, available at: http://ssrn.com/abstract=1106698
Carter, D.A., Simkins, B.J., & Simpson, W.G. (2003). Corporate Governance, Board Diversity, and Firm Value. Financial Review 38 (1), 33-53.
Católica Lisbon / AEM Report (2013). Corporate Governance in Portugal in 2012.
Código das Sociedades Comerciais (2012). Lisbon: Almedina.
Conger, J. A., Finegold, D. & Lawler, E. E. (1998). Appraising Boardroom Performance.
Harvard Business Review 76 (1), 136-148.
CMVM (2012). Annual Report on the Corporate Governance of Listed Companies in
Portugal.
CMVM (2013). Corporate Governance Code 2013 (Recommendations).
31
CNMV (2012). Informe anual de Gobierno Corporativo de las compañias del IBEX 35.
Elliot, B. & Elliot, J (2002). Financial Accounting and Reporting. 12th Ed. London: Prentice Hall/Financial Times.
European Commission (2013). Women and men in leadership positions in the
European Union - A review of the situation and recent progress.
Fama, E. & Jensen, M. (1983). Agency Problems and Residual Claims. Journal of Law
and Economics 26, 327-349.
Ferreira, D., Ferreira, M. A. & Mariano, B. (2012). Board structure and capital structure. Working Paper, available at: http://papers.ssrn.com/abstract_id=2021522
Fosberg, R. H. (2004). Agency Problems and Debt Financing: Leadership structure effects. Corporate Governance: International Journal of Business in Society 4(1), 31-38.
Grechaniuk, B. (2009). Corporate capital structure choices: does managers' gender matter. Kyiv School of Economics Working Paper.
Greene, W. H. (2008). Econometric Analysis, 6th Ed. NJ:Prentice Hall.
Hart, O. (1995). Corporate Governance, Some Theory and Applications. The Economic
Journal 105, 687-689.
Hausman, J. A. (1978). Specification tests in econometrics. Econometrica 46, 1251-1272.
Hermalin, B. & Weisbach, M. (1991). The Effects of Board Composition and Direct Incentives on Firm Performance. Financial Management 20 (4), 101-12.
32
Hinkle, D.E., Wiersma, W. & Jurs, S.G. (2003). Applied Statistics for the Behavioral
Sciences, 5th Ed. Boston: Houghton Mifflin Co.
Himmelberg, C., Hubbard R. G., & Palia D. (1998). Understanding the Determinants of Managerial Ownership and the Link Between Ownership and Performance.
Journal of Financial Economics 53, 353-384.
IPCG (2012). Código de Governo das Sociedades.
Jensen, M. (1993). The Modern Industrial Revolution, Exit and the Failure of Internal Control Systems. Journal of Finance 48, 831-880.
Jensen, M. & W. Meckling (1976). Theory of the Firm: Managerial Behavior, Agency Costs and Ownership S+tructure. Journal of Financial Economics 3, 305-360.
Lipton, M. & Lorsch, J. W. (1992). A modest proposal for improved corporate governance. Business Lawyer 48, 59-77.
McColgan, P. (2001). Agency theory and corporate governance: a review of the literature from a UK perspective. Working Paper, Department of Accounting and Finance, University of Strathclyde.
McKinsey & Company (2002). McKinsey Global Investor Opinion Survey on Corporate
Governance, London: McKinsey & Co.
Modigliani, F. & Miller, M. H. (1958). The cost of capital, corporation finance and the theory of investment. American Economic Review 48(3), 261–297.
Olivencia Report (1998). Documento de la Comisión Especial para el estudio de un código ético de los consejos de administración de las sociedades: el gobierno de las sociedades cotizadas. Informe Olivencia. Madrid.
33
OECD (2004). OECD Principles of Corporate Governance. Paris: OECD.
Paredes, C. (2013). Spain. The Corporate Governance Review, 3rd Ed. London: Law Business Research.
Pfeffer, J. & Salancick, G.R. (1978). The External Control of Organisations: A
Resource-dependence Perspective, New York: Harper & Row.
Rehman, M. A., Rehman, R. U. & Raoof, A. (2010). Does corporate governance lead to a change in the capital structure?. American Journal of Social and Management
Sciences 1 (2), 191-195.
Shleifer, A. & Vishny, R. (1997). A survey of corporate governance. Journal of Finance 52 (2), 737-783.
Silva, A. S., Vitorino, A., Alves, C. F., Cunha, J. A. da & Monteiro, M. A. (2006). Livro
Branco sobre Corporate Governance em Portugal, Lisboa: Instituto Português
de Corporate Governance.
Vafeas, N. (1999). Board Meeting Frequency and Firm Performance. Journal of
Financial Economics 53, 113-142.
Van der Walt, N. & Ingley, C. (2003). Board Dynamics and the Influence of Professional Background, Gender and Ethnic Diversity of Directors. Corporate
Governance: An International Review 11 (3), 218-234.
Weisbach, M. S. (1988). Outside directors and CEO turnover. Journal of Financial
34
Wen, Y., Rwegasira, K. & Bilderbeek, J. (2002). Corporate Governance and Capital Structure Decisions of Chinese Listed Firms. Corporate Governance: An
International Review 10 (2), 75-83.
Yermack, D. (1996). Higher Market Valuation of Companies with a Small Board of Directors. Journal of Financial Economics 40(2), 185-211.
35
Appendix
Figure 1 – Representation of women and men on the boards of large listed companies, April 2013
Source: European Commission, Database on women and men in decision-making.
Figure 2 – Change in the share of women and men on boards by country, October 2010-April 2013
36
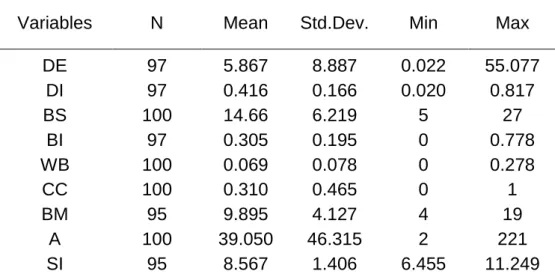
Table VII – Descriptive statistics of variables for PSI 20 companies
Notes: DE = Total Debt / Total Shareholder's Equity; DI = Total Debt / Total Assets; BS: Total number of directors; BI: Percentage of the board composed by independent directors; WB: Percentage of the board composed by women; CC: Considered as a dummy variable, in order to assess if the CEO and the Chairman are the same person or not; BM: Number of meetings held by the board per year; A: Number of years of existence of the company; SI: Natural logarithm of the number of firm's employees.
Table VIII – Descriptive statistics of variables for IBEX 35 companies
Variables N Mean Std. Dev. Min Max
DE 172 16.987 191.361 -22.107 2511.667 DI 172 0.336 0.190 0 0.951 BS 166 13.886 3.494 8 24 BI 165 0.487 0.190 0 0.890 WB 164 0.135 0.090 0 0.440 CC 162 0.568 0.497 0 1 BM 164 10.835 3.454 5 31 A 173 38.538 37.063 0 156 SI 172 9.788 1.562 6.582 12.561
Notes: DE = Total Debt / Total Shareholder's Equity; DI = Total Debt / Total Assets; BS: Total number of directors; BI: Percentage of the board composed by independent directors; WB: Percentage of the board composed by women; CC: Considered as a dummy variable, in order to assess if the CEO and the Chairman are the same person or not; BM: Number of meetings held by the board per year; A: Number of years of existence of the company; SI: Natural logarithm of the number of firm's employees.
Variables N Mean Std.Dev. Min Max
DE 97 5.867 8.887 0.022 55.077 DI 97 0.416 0.166 0.020 0.817 BS 100 14.66 6.219 5 27 BI 97 0.305 0.195 0 0.778 WB 100 0.069 0.078 0 0.278 CC 100 0.310 0.465 0 1 BM 95 9.895 4.127 4 19 A 100 39.050 46.315 2 221 SI 95 8.567 1.406 6.455 11.249
37
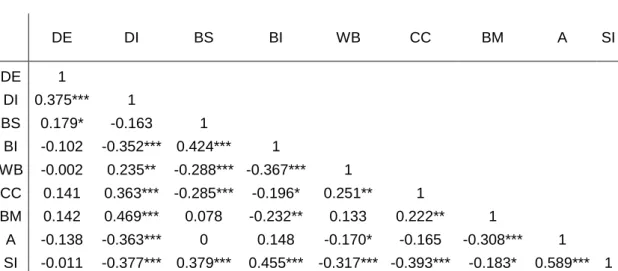
Table IX – Pearson Correlation Matrix for PSI 20 companies
DE DI BS BI WB CC BM A SI DE 1 DI 0.375*** 1 BS 0.179* -0.163 1 BI -0.102 -0.352*** 0.424*** 1 WB -0.002 0.235** -0.288*** -0.367*** 1 CC 0.141 0.363*** -0.285*** -0.196* 0.251** 1 BM 0.142 0.469*** 0.078 -0.232** 0.133 0.222** 1 A -0.138 -0.363*** 0 0.148 -0.170* -0.165 -0.308*** 1 SI -0.011 -0.377*** 0.379*** 0.455*** -0.317*** -0.393*** -0.183* 0.589*** 1
Notes: DE = Total Debt / Total Shareholder's Equity; DI = Total Debt / Total Assets; BS: Total number of directors; BI: Percentage of the board composed by independent directors; WB: Percentage of the board composed by women; CC: Considered as a dummy variable, in order to assess if the CEO and the Chairman are the same person or not; BM: Number of meetings held by the board per year; A: Number of years of existence of the company; SI: Natural logarithm of the number of firm's employees.
*, ** and ***, indicate statistical significance of 10%, 5% and 1%.
Table X – Pearson Correlation Matrix for IBEX 35 companies
DE DI BS BI WB CC BM A SI DE 1 DI 0.064 1 BS 0.095 0.116 1 BI -0.066 -0.083 -0.475*** 1 WB 0.125 0.068 -0.261*** 0.306*** 1 CC -0.092 0.007 0.019 0.149* -0.055 1 BM 0.048 0.268*** -0.051 0.132* 0.107 -0.093 1 A 0.159** 0.090 0.301*** -0.005 -0.049 -0.055 0.096 1 SI 0.076 -0.017 0.241*** 0.059 -0.143* 0.091 -0.094 0.240*** 1
Notes: DE = Total Debt / Total Shareholder's Equity; DI = Total Debt / Total Assets; BS: Total number of directors; BI: Percentage of the board composed by independent directors; WB: Percentage of the board composed by women; CC: Considered as a dummy variable, in order to assess if the CEO and the Chairman are the same person or not; BM: Number of meetings held by the board per year; A: Number of years of existence of the company; SI: Natural logarithm of the number of firm's employees.