The inequality effect in the well-being of European OECD
countries: a new perspective on data addressing the
multidimensionality of the concepts
Craveiro, D., Botelho, M. C., Mauriti, R., Nunes, N.
Paper prepared for the 16th Conference of IAOS
OECD Headquarters, Paris, France, 19-21 September 2018
Daniela Craveiro.
[email protected] SOCIUS-UL& CIS-IUL Maria do Carmo Botelho. [email protected] CIES-IUL Rosário Mauriti. [email protected] CIES-IUL Nuno Nunes. [email protected] CIES-IUL
The inequality effect in the well-being of European OECD countries: a new perspective on data addressing the multidimensionality of the concepts
DRAFT VERSION 31/08/2018 PLEASE DO NOT CITE
Prepared for the 16th Conference of the
International Association of Official Statisticians (IAOS) OECD Headquarters, Paris, France, 19-21 September 2018
ABSTRACT
Social inequality refers to the uneven distribution of resources in a society that can lead to systematically and unfair advantages/disadvantages in peoples’ life circumstances and opportunities. In populations all over the world, people with fewer resources have worse chances in life, health and well-being. Additionally, inequality hinders not only the people on the bottom of the social rank, but also the general population: in more unequal societies there is a higher incidence of a wide range of health and social problems such as criminality and poverty, fewer chances of economic growth, and higher unbalances in political representation, that can seriously undermine the fairness of political and economic institutions. Despite the consistence of its implications, social inequality is not a one-dimensional construct. Addressing social inequalities, implies not only addressing the degree of concentration or dispersion of valued goods, but also the correlation among these valuable features, and their plural implications in peoples' life circumstances – a multidimensional approach of social inequality is therefore advised.
We explore the well-being inequalities in Europe building upon the OECD Framework For Measuring Well-Being And Progress. In this scope, well-being is understood as a multidimensional concept, framed by material conditions, quality of life and sustainability, and expressed by eleven well-being dimensions – income and wealth, jobs and earnings, housing, health, education, work-life balance, environment, social connections, civic engagement, safety and subjective well-being. Taking European Social Survey as the main empirical source, the interplay between key distributional (education, income) and categorical (gender, social class) dimensions of social inequalities in well-being and well-well-being profiles was studied, under two levels of analysis of the OECD European social space – transnational (across individuals) and national (across countries).
Social inequalities on well-being scores and well-being profiles were identified. Higher education, higher income, and belonging to a more privileged social class positively influence well-being; men tend to present higher well-being than women. The four well-being profiles identified among Europeans were shown to be clearly structured by social inequalities, opposing higher- and lower- qualified socio-occupations, and males and females' life circumstances (Low-wage earners well-being profile, Elite well-being profile, Female well-being profile, Male well-being profile). At a country level, profiles are mostly defined in terms of volume of well-being, expressing regional affiliations (with a exception of one profile) and asymmetries of income, education, and class structures (Nordic high-rank well-being profile; Central Europe medium-rank well-being profile; Southern Europe medium-rank well-being profile; Eastern Europe low-rank well-being profile; Social disengagement low-rank well-being profile).
The developed analysis confirms the existence of multidimensional intersections between well-being and categorical and distributive social structuring variables.
1. INTRODUCTION
This paper aims to study the implications of social disadvantage and social inequality in well-being among Europeans. It is anchored in a multidimensional understanding of social inequality and well-being, explored within and across OECD European countries.
Social inequality refers to the uneven distribution of resources in a society. The complex interplay of a social institutions network that constitutes the stratification system, mediate what kind of goods are valuable, the rules mechanisms of allocation of resources across social gradients, and the processes of social distinctions and social mobility. Therefore, addressing social inequalities, implies not only addressing the degree of concentration or dispersion of valued goods, but also the correlation among these valuable features, and the extent that social conditions influence individual’s social circumstances. A multidimensional approach on inequality is therefore advised (Bourdieu, 1979; Tilly, 1998; Massey, 2007; Therborn, 2013; Costa et al. 2009).
Building upon previous analyses, the interplay between distributional and categorical dimensions of inequalities is considered (e.g. OECD, 2017; Mauriti et al. 2016). In the European social space, inequalities across education gradients and economic variable can be identified as key vectors for life circumstances in contemporaneous society (distributive inequalities). These vectors, are attended in combination with two additional features, namely gender and social classes (categorical inequalities) - two dimensions that interact in the definition of socio-occupational relations that can express social advantage or status, structuring life-choices and life-chances in different ways across occupations (Costa and Mauritti, 2018).
Multidimensionality of social inequality is also considered by articulating different levels of analysis. Accounting for the transnational integration in globalized capitalism, both, national and transnational levels of analysis are important. If the increasingly globalized context has not put an end to the importance of national states, which are central institutions in contemporary inequality, global interdependencies do not confine social inequalities within national states. Transnational and global inequalities manifest themselves in a heterogeneous conjugation with the historical, structural, institutional and cultural realities of national states (Therborn, 2006; Atkinson, 2015). Therefore, this study on the relation between social inequality and well-being in the OECD European social space is conducted under the perspective of transnationalism, operationalised in two interlinked analytical scales – the national and the transnational (Mauritti et al., 2016).
Social structuring dimensions present important implications for peoples’ lives. Even though there is great variability among countries, in populations all over the world, people from lower social standings have worse chances in life, health and well-being (e.g. Deaton, 2013; Therborn, 2013; Milanovic, 2016). Research suggest that in more unequal societies there is a higher incidence of a wide range of health and social problems such as criminality and poverty (e.g. Pickett & Wilkinson, 2015; Dorling, 2017), fewer chances of economic growth (e.g. OECD, 2015), and higher unbalances in political representation that can seriously undermine the fairness of political and economic institutions (e.g. Stiglitz, 2012).
OECD’s How's Life (2011, 2013, 2015, 2017) offers a valuable framework to assess the relationships between well-being and social inequalities, allowing a broad perspective on the plural combinations among social circumstances, social perceptions, and life styles of families and individuals. The framework is based in an extensive and updated literature review on well-being and social inequality, and it incorporates a vast compilation of comparable measurements. It reflects elements of Sen’s capabilities approach (e.g. Sen, 2009), central in the theorization of social inequality and social justice, and it is closely intertwined with the priorities on the 2030 Agenda for sustainable development (OECD, 2017a, OECD, 2018). In this scope, well-being is understood as a multidimensional concept, framed by
5
material conditions, quality of life and sustainability, and expressed by eleven well-being dimensions – income and wealth, jobs and earnings, housing, health, education, work-life balance, environment, social connections, civic engagement, safety and subjective well-being.
The OECD Framework for Measuring Well-Being and Progress was devised to support better-informed international comparisons in well-being, and well-being inequalities. Our proposal, focused on the perceptions and experiences of individuals, intents to complement those efforts, addressing the structural configurations and multidimensionality of well-being inequalities.
Relying on multifactorial and multivariate micro-data analysis, we account for the interactions between key structuring dimensions of living conditions and well-being, proposing an innovative perspective on the relations between structural characteristics and well-being perceptions of citizens.
Taking a transnational (across OECD European individuals) and a national level of analysis (across OECD European countries), firstly the influence of key dimensions of social inequalities (such as social class, gender, income or education) in the global volume of well-being are addressed, and secondly, differences in structural configurations of well-being are explored, by them-selves and in relation to social inequality indicators. Specifically, the analysis intents to tackle the following research questions: How individuals differ in well-being in OECD European space (total volume and well-being structure)? How distributive inequalities influence well-being (total volume and well-being structure)? How categorical inequalities influence well-being (total volume and well-being structure)?
This working paper systematizes the communication prepared for the IAOS 2018 conference (draft version). In the next section, we present our methodological approach. Then the main results are presented. In the conclusion section, we highlight the key results that allow discussing the relevance of multidimensionality in the study of well-being inequalities.
2. METHODOLOGY
The international European Social Survey (ESS) served as the empirical support for the development of a multivariate analysis of the relation between inequality and well-being. We considered data of individuals with 25 to 64 years old, from 22 OECD European countries, covered by the ESS 2016 (plus Denmark data, from ESS 2014) – considering most of the European Union countries and three associated countries in the European Economic Area (Iceland, Switzerland and Norway).
2.1. Social inequality indicators
Concerning social inequalities indicators, individuals were characterized according to social class and gender (categorical inequalities) and income and education (distributional inequalities) using a set of harmonized indicators.
In an attempt to integrate the most important theoretical frameworks of the Sociology of social classes and stratification disciplines, social class is operationalised using the class typology suggested by Almeida, Costa and Machado (Costa et al., 2002; Costa et al., 2009) – the ACM typology. In operational terms this typology, which has already been used in various European analyses (Costa et al., 2002; Carmo and Nunes, 2013; Nunes, 2013; Mauritti et al., 2016; Costa et al., 2018; Costa and Mauritti, 2018), consists of a socio-occupationnal indicator constructed on the basis of a cross matrix of class locations formed by the ISCO08 occupations and employment status (Table A1, Appendix A). The social classes’ locations are as follows: entrepreneurs and executives (EE), professionals and managers (PM), the self-employed (SE), routine employees (RE), and industrial workers (IW). Thus, this typology not only distinguish different
6
social categories among individuals with different qualifications and life circumstances, but it also allows to address the evolution of the macro institutional context, e.g. in terms of women integration in the labour force (expressed in the proportion of RE, among the less qualified workers, and PM among the most qualified workers), and the knowledge-based sectors of the economy (expressed for example by the proportion of IW) and welfare state development (expressed for example by the proportion of PM).
Education is measured by “years of schooling completed”, in order to ensure a more comparable measure across countries, being an option relatively less dependent on the specific educational systems of each country than others are.
A series of standardization and harmonization processes were applied to income variables at individuals and countries levels of analysis, involving currency conversion for the countries that do not use the Euro, the calculation of annual reported income over 12 months, and the calculation of net-income for countries with only gross income data available. The operationalization of these variables followed the procedures detailed in Mauritti and collaborators (2016, p. 78-79), yet the year of reference was 2016 for both the currency conversions and for the calculations of annual income. Income variable refers to the annual income per adult equivalent after taxes and mandatory contributions on income, based on the total household monetary income generated by employment, self-employment, property values and money transfers. It is measured in Euros among individuals and in Purchasing Power Standards (PPS) among countries.
2.2.Well-being indicators
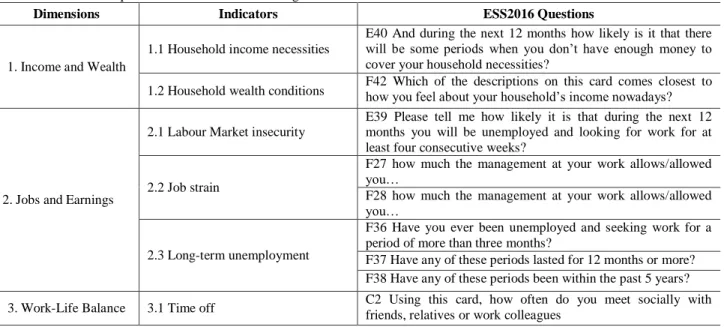
OECD well-being framework was used to identify the key indicators for measuring well-being covered by the European Social Survey. The survey compiles a broad set of indicators that measure the individuals’ perceptions of life circumstances. From the overall set, composed by eleven dimensions, only two are omitted – Housing and Education and Skills are not considered. Housing quality was not addressed in ESS2016 wave and the only indicator congruent with Education and Skills dimension concerned schooling and was discarded (as a well-being dimension) since it is used as an inequality indicator (Table A2, in appendix, presents the dimensions and questions selected to measure well-being in this study).
Since the selected questions presented different units, well-being indicators were normalised, using the min-max method (OECD, 2016), resulting values from zero to 10 in all dimensions. For dimensions with two or more indicators, the arithmetic mean was calculated.
The Well-Being Global Volume was calculated by the arithmetic mean of the nine represented dimensions.
2.3. Analysis
A dual analytical study is conducted, based in transnational and national scales on the data. In both levels of the analysis, well-being global volume scores and well-being profiles are analysed across distributive and categorical social inequality indicators.
Well-being profiles are identified by cluster analysis, accounting for the scores in well-being indicators at the individual level and at the country level (average scores). First, hierarchical methods were applied to determine the appropriate number of clusters (Ward´s, furthest neighbour, and centroid). Second, a non-hierarchical cluster method was used (K-means) to classify cases or countries in a defined number of well-being clusters.
7
The effect of categorical and distribute social structuring dimensions in well-being is evaluated, using multiple regression models concerning Well-Being Global Volume as dependent variable and associations measures with the identified well-being profiles. Additionally, social inequality influence in well-being is assessed within country profiles, by conducting multiple regression models and comparing the scores by gender and social class groups (variance analysis) in the different countries groups.
3. SOCIAL INEQUALITY AND WELL-BEING PROFILES ACROSS INDIVIDUALS
In this section, the transnational analysis of well-being inequality is presented, first addressing the findings concerning the Well-being Global Volume and then concerning the identification and description of Europeans well-being profiles.
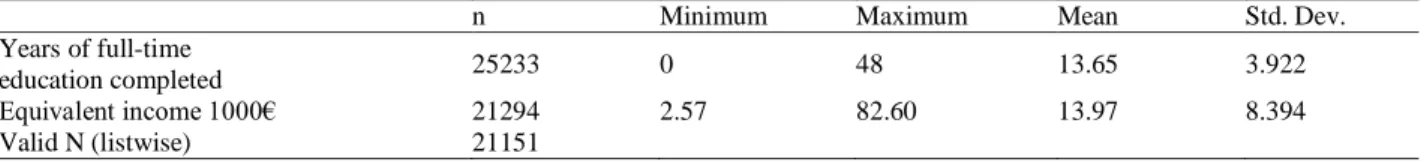
The ESS 2016 sample is gender-balanced, with upper secondary as the most frequent level of education, although 25% of individuals have only the basic level of education. The overall annual equivalent income varies from 2.57 to 82.6 thousands of Euros with about 50% of Europeans with an equivalent annual income less than 12390 €. The class typology constructed shows that professionals and managers (PM) category is the most frequent group (30.6%) followed by routine employees (RE) (28.6%) and industrial workers (IW) (20.1%) (Tables A3 and A4, in appendix). To note that, these are three class locations that have the salaried status in common, but they are characterized by very different structural and cultural conditions. Professionals and managers (in many countries with a growing female prevalence) hold upper-level educational qualifications, performing professional activities enrolled in ISCO08 major groups 2 & 3 (at least skill level 3). Routine employees (more female) and industrial workers (more masculine) refer to activities related with low or intermediate skills (skill 1 and 2), respectively in services, trade and security sectors (routine employees), and in industrial, construction and yard work (industrial workers). In terms of lifestyles and socio-cultural orientations, the professionals and managers have their increasing numerical expression directly associated with the so-called knowledge society, qualified and based on expertise, which in Europe has been institutionally framed by welfare state services, provided and coordinated by the state. The other two categories of class, routine employees and industrial workers, in some other typologies are reunited under the "working class" category (Wright, 1997). By distinguishing the two, is possible to analyze qualification and productive structures of different economies, linked either to processes of technological and industrial configuration (particularly permeable to the effects of the globalization of economic activity), either to processes of expansion of consumption and of personal and administrative services.
3.1. Well-Being Global Volume and social inequality
Based on the questions that best portrayed individuals’ perceptions in the different dimensions of well-being, and the standardization of the indicators in a 0 to 10 scale, the scores for the Well-Being Global Volume and the well-being volume by dimension were calculated1. The nine wellbeing indicators are found to be correlated (Table A5, in appendix), having a reasonable level of reliability (Cronbach’s Alpha=0,60).
The results indicate that Europeans present an average value of 6.2 in the Well-Being Global Volume in a possibility from zero to 10 (Figure 1). Analysing the average value in each dimension is possible to conclude that the score is enhanced in great extent by positive perceptions on health status, the
1
8
dimension with highest mean value (8.3). In opposition, social engagement (political or personal) is the dimension in which the Europeans perceived less wellbeing. The environmental concern and social connections are dimensions that present scores lower than the average, and civil engagement and governance is the dimension with the lowest mean value of well-being, only 2.3.
Figure 1. European Well-Being Global Volume by well-being dimensions
Note: Environmental concern is not measured in Denmark.
Multiple regression models were devised to study the interplay between social inequality indicators and the global volume of well-being in the OECD European space. Education, income, gender, and social class are included, given that categorical indicators are introduced in the model as dummy variables (for gender the reference group is female; for social classes is industrial workers). Since interactions between social class and gender are expected, regression analysis was conducted for the total of the sample (M1) and for men (M2) and women separately (M2). Results are presented in Table 1.
Relevant effects of gender, social class, years of schooling and income on well-being are identified (p <0.001). The first model (M1), using all cases, estimates that approximately 26% of well-being global value variation can be attributed to the set of variables in the model. Income is the characteristic that most positively influences well-being (β = 0.282); for an increase of 1000 € in income, it is estimated that wellbeing score increases by 0.035, on average, on the defined scale. Schooling is the second most important variable that influence well-being (β = 0.227). The increase of one year of schooling should increase the score value by 0.062, on average. When analyzing the variables related to social classes it is verified that industrial workers present the lowest score of wellbeing, and that professionals and managers present, on average, more 0.469 points in the well-being volume than the industrial workers (reference group) (β = 0.208); entrepreneurs and executives more 0.514 (β = 0.176); self-employed workers, 0.495 (β = 0.102) ; and routine employees, with the slightest difference presenting an average of 0.170 higher score than the industrialworkers. The gender is also significant, revealing that men presented on average more 0.194 of global well-being volume than women (β = 0.092).
9 Table 1. Regression coefficients for well-being global volume
Variables
Well-Being Global Volume
All (M1) Male (M2) Female (M3)
Constant 4.391 ** (0.032) 4.721 ** (0.040) 4.134 ** (0.051) Years of full-time education completed 0.062 **
(0.002) 0.058 ** (0.003) 0.065 ** (0.003) Equivalent income € 0.035 ** (0.001) 0.032 ** (0.001) 0.039 ** (0.001) Entrepreneurs and executives (EE) 0.514 **
(0.026)
0.439 ** (0.031)
0.766 ** (0.049) Professionals and managers (PM) 0.469 **
(0.023) 0.418 ** (0.028) 0.649 ** (0.042) Self-employed (SE) 0.495 ** (0.036) 0.368 ** (0.044) 0.803 ** (0.063) Routine employees (RE) 0.170 **
(0.022) 0.210 ** (0.030) 0.305 ** (0.040) Gender (Male=1) 0.194 ** (0.015) Adjusted R2 0.260 ** 0.238 ** 0.281 ** F(7; 16564)=831.064 F(6; 8535)=446.352 F(6; 8024)=440.217 Notes. The standard error values associated with the estimated coefficients are enclosed in parentheses.*p<0.05 **p<0.001
Gender differences are also analyzed by comparing M2 and M3 models. Considering the explanatory power of both models, we observed that about 28% of the variation in well-being in the female group is explained by the variables in the model, while in the male group is about 24%, suggesting higher well-being inequalities among females. In the male sample, the hierarchy of the effects follows the described for the total sample (M1). Income emerges as the characteristic that most influences well-being, in a positive way, followed by schooling. In relation to the social class’s variables, it is verified that all social classes variables introduced in the model present significantly higher well-being scores than industrial workers.
In the female sample, however, the magnitudes of the effects are superior to the ones found in the global sample and the hierarchy of the effects is not similar. As in the other models, the variable that most influences well-being is income (β = 0.298). Alternatively, the variable that comes second in influence is belonging to the professionals and managers class (β = 0.290). Education is also a determinant of well-being; with a one-year increase in schooling, it is estimated to increase in average the global score in 0.065. The remaining variables referring to social classes belonginess are all significant, reporting higher well-being scores in all of them when compared with industrial workers class.
Results suggest that categorical and distributive social indicators influence the global well-being scores across individuals in the OECD European space. Next subsection addresses well-being inequalities accounting the variations not only of the volume but also of the structure of wellbeing.
3.2. Well-Being profiles and social inequality
The selected well-being indicators were used to identify different well-being profiles of Europeans, beyond the borders of the countries to which they belong. Four different clusters were identified by clusters analysis. Figure 2 presents the different profiles considering the scores in global volume of wellbeing and
10
in each well-being dimension (graphic representation). Table 2 describes different well-being profiles in terms of social inequality indicators and the well-being profiles.
Four different clusters were identified based on the scores in the different well-being dimensions - one presenting the highest global volume and the higher scores in all well-being dimensions, another presenting the lowest well-being volume, mostly due to the material social condition indicators, and two other clusters with similar global volume of well-being – among which one is more penalised by lower perceptions of personal security; and the another by lower social engagement (social connections, environment concern). Articulating the well-being structural differences with the social inequality indicators is possible the observed that two of the profiles are mainly structured by social class, opposing the low wage earners groups (Low wage earner well-being profile) from the social classes that concentrate education and qualification resources (Elite well-being profile); and by the gender, opposing more feminized (female well-being profile) and masculinised wellbeing profiles (male well-being profile). Figure 2. Well-being profiles of Europeans
Elite WB profile (38.0%; N=7331) WBGV=7.1
Female WB profile (13.6%; N=2637) WBGV=5.7
Low wage earner WBprofile (17.9%; N= 3452) WBGV=4.9
Male WB profile Cl4 (30.5%; N= 5898) WBGV=5.9
11 Table 2. Wellbeing profiles by social inequalities indicators
The first cluster is formed by people with the highest well-being global volume, equal to 7.1 in average. When compared with others, they had greater well-being in all dimensions. After the health status, the second most evaluated dimension was personal security. Positive perceptions on income, wealth, jobs, and earnings and work-life balance are observed. Even for civil engagement and governance, well-being score is the highest, when compared with the others three groups. This group is relatively gender balanced, being composed mostly by entrepreneurs and executives and professional and managers (63%) with the highest level of education, a mean of 15 years and an equivalent income mean of 17402€. This group represents 38% of individuals, corresponds to people with the highest level of education, income, and higher social class, and reveals a higher mean of well-being global volume. These characteristics thus show the prevalence in this cluster of the two social class locations best positioned in the European social structure, emphasizing the effects of economic and cultural resources, power and social status, and better living conditions. We named this cluster Elite well-being profile.
The second cluster represents 18% of individuals and has the lowest level of well-being global volume (M=4.9). Generally, the well-being is lower in all dimensions, with an exception for environmental concern. After the health status, the second dimension most positively valued is personal security and work-life balance. The lower scores concerns material circumstances, expressed in the scores of income and wealth, and jobs and earnings dimensions. This cluster is almost gender balanced, being essentially composed by routine employees and industrial workers (73%), with about 12 years of schooling and equivalent income less than 10000€, in average.We named this cluster Low-wage earner well-being
profile.
The third cluster refers to the well-being of mostly females (74%), and therefore reports mainly to routine employees and professional and managers (68%) – both feminized social occupation classes, for lower and higher qualification workers, respectively –resulting in a medium-rank schooling and income average with about 14 years of completed education, and a mean of equivalent income of 14162€. After the health status, income and wealth and jobs and earning dimensions are the better evaluated. Well-being total volume is distinguishably penalised by lower scores of personal security in this group. The cluster was named Female well-being profile.
Finally, the fourth group represents 31% of individuals, mostly composed by males, professionals and managers (29.5%), routine employees (25%) and by a relevant weight of industrial workers (22%). In average, it presents nearly 14 years of schooling and an equivalent income of 13677€. After health status, materialconditions and personal security are the dimensions better perceived. In opposition, lower scores in social connections and environmental concerns penalize the well-being in this group. The cluster was named Male well-being profile.
12
4. SOCIAL INEQUALITY AND COUNTRY WELL-BEING PROFILES
In this section, the analysis of well-being inequality is developed assuming a country-based perspective, attending to Well-Being Global Volume average scores and the identification of country well-being profiles.
4.1. Average Country Well-Being Global Volumes
Country average scores in the 22 OECD countries considered in the analysis were calculated. Figure 3 presents the countries ranking in well-being global volume score. The top five of countries with greater average volume of well-being are Sweden, Iceland, Norway, Denmark, and Switzerland. Globally, countries of Northern Europe are better off than the countries of Southern Europe or Eastern Europe. Health status is the dimension that emerges with a higher average score of well-being in all countries, with the exception of Denmark and Sweden (that present higher evaluation in the income and wealth dimension), and Iceland and Norway (that present higher evaluation for the personal securitydimension). By contrast, civil engagement and governance generally appears with the lowest average values, reflecting the low participation of individuals in collective action practices in Europe (Nunes, 2013). In appendix, it is possible to evaluate the well-being of each country with the nine selected dimensions (Table A6).
Figure 3. Ranking of Well-Being Global Volume by country
Note: Environmental concern is not measured in Denmark.
4.2. Country well-being profiles and social inequality indicators
Relying in the average country scores in the nine dimensions of well-being, five country profiles were identified. Figure 4 presents well-being profiles of OECD European countries, according with the
13
scores in each dimension, and Table 4 describes the population in these groups of countries in terms of social inequality indicators.
At the country level of analysis, well-being profiles differ more in terms of well-being volume that in terms of well-being structure. Among the five groups of countries with different well-being profiles, one presents the highest volume of wellbeing, two profiles present a medium-rank wellbeing volume, with scores either more penalized by lower material conditions (income and job earnings), or either by lower work-life balance; and two low-rank well-being profiles, one more penalized by lower scores in work-life balance, and the another more penalized by low scores concerning social engagement (low personal security and low social connections). Country profiles are also partially structured by regional affinities.
The higher-rank well-being cluster presents the highest well-being global volume (M=6.9) and the highest average scores in most dimensions. After the health status, this group assigns higher well-being scores to income and wealth, personal security and jobs and earningsdimensions. The subjective well-being has also the greatest mean value when compared with other clusters. Participation in collective action,even though presenting lower scores than other dimensions, has in this group the highest value. The cluster is formed by Iceland, Norway and Sweden, presenting a relatively higher proportion of professionals and managers, and higher levels of schooling and income, with nearly 15 schooling years, in average and an equivalent mean income of 17685 Euros-PPS.We named this profile Nordic high-rank well-being profile.
The second profile presents the second highest well-being global volume (M=6.4) and is considered a medium-rank well-being profile. Structurally does not differ much from the previous profile, however, their civil engagement and governance are scored lower among these countries, and their concern about climate change is higher. The cluster is almost exclusively composed by central European countries in the sample (Austria, Belgium, Switzerland, Germany, and Netherlands) and with United Kingdom and Finland. The cluster also presents professionals and managers as the most frequent social class, with approximately 14 schooling years in average and an equivalent mean income of 15858 Euros-PPS, being the group of countries with the second highest income. We named this profile Central Europe
medium-rank well-being profile.
The third cluster also presents mid-rank well-being volume (M=6.2). After health status, this group valued more positively personal security, work-life balance and the subjective well-being. The well-being score is relatively penalised by income and wealth, and jobs and earnings dimensions. The group is formed by Southern European countries such as France, Spain, and Portugal. Routine employees are the social class with more relative expression and the group is also characterised by a relative higher proportion of self-employees. The population of this cluster is described by less educational and income resources than the previous groups. The average of schooling years is nearly 14, and the mean of equivalent income is the second lowest, 11719 Euros-PPS. We named this profile Southern Europe medium-rank well-being profile. Two lower-rank wellbeing profiles are identified.The fourth clusteris mainly formed by Eastern European countries, such as Estonia, Hungary, Poland, and Slovenia and by Ireland, with an average well-being global volume of 5.8. This cluster has a high well-well-being in health status and is the only with personal security as the second most evaluated dimension. Well-being scores are penalised mostly by the dimensions related with material conditions (jobs and earnings; income and wealth) and work-life balance; this group also presents the lowest score in civil engagement and governance. A higher proportion of entrepreneurs and executives (17%) and industrial workers (23%) characterize the cluster. The population in this country cluster presents in average, approximately 14 schooling years and have the second lowest equivalent income, with 9325 Euros-PPS. We named this profile Eastern Europe Low-rank well-being
14
Finally, the profile with the lowest well-being global volume (M=5.5), presents the lower score in almost all the dimensions with the exception of health status and environmental concerns. This group is the one with the highest average value on health status being. In relation with the other low-rank well-being profile, the well-well-being scores in this group are more penalised by lower perceptions of personal security and social connections. This cluster is formed by Czech Republic, Lithuania, and Italy, where industrial workers have a high relative frequency. This segment presents the lowest schooling years mean, approximately 13 and the lowest mean income, with 6774 Euros-PPS.We named this profile Low-rank
well-being profile.
Table 4. Country wellbeing profiles by social inequalities indicators
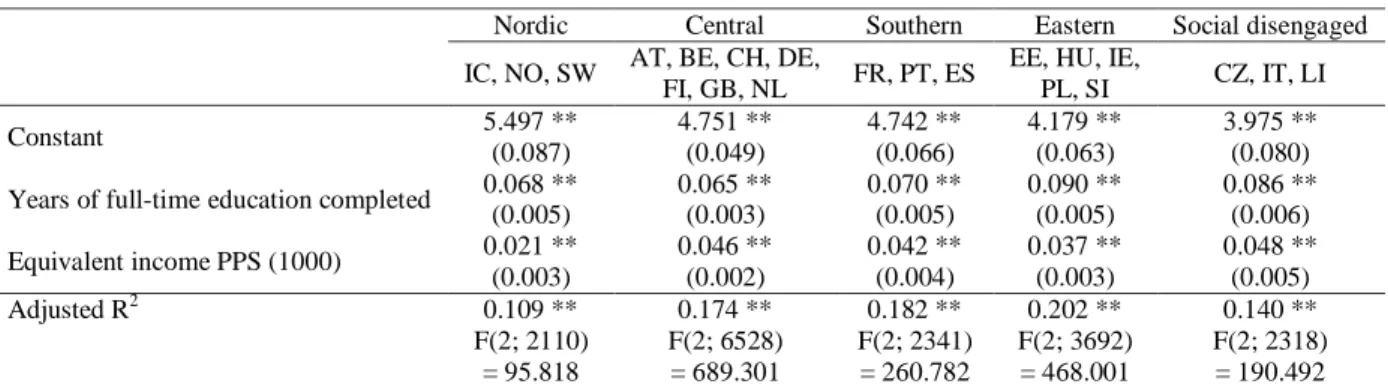
To further the analysis, the association between social inequalities and well-being are studied within the identified profiles. For distributive social inequality indicators, multiple regression models were conducted assessing how education and income influence total volume of well-being in the five different groups of countries. The results are presented in Table 5.
Regression models estimations inform that income and education are significant predictors for well-being, with a positive effect in well-being global volume in the five country profiles. With the exception of the central European profile, education presents the higher effect in global wellbeing volume across the different country profiles.
Table 5. Regression coefficient for well-being global volume by country profiles
Notes. The standard error values associated with the estimated coefficients are enclosed in parentheses. *p<0.05 **p<0.001 Nordic Central Southern Eastern Social disengaged IC, NO, SW AT, BE, CH, DE,
FI, GB, NL FR, PT, ES
EE, HU, IE,
PL, SI CZ, IT, LI Constant 5.497 ** (0.087) 4.751 ** (0.049) 4.742 ** (0.066) 4.179 ** (0.063) 3.975 ** (0.080) Years of full-time education completed 0.068 **
(0.005) 0.065 ** (0.003) 0.070 ** (0.005) 0.090 ** (0.005) 0.086 ** (0.006) Equivalent income PPS (1000) 0.021 ** (0.003) 0.046 ** (0.002) 0.042 ** (0.004) 0.037 ** (0.003) 0.048 ** (0.005) Adjusted R2 0.109 ** 0.174 ** 0.182 ** 0.202 ** 0.140 ** F(2; 2110) = 95.818 F(2; 6528) = 689.301 F(2; 2341) = 260.782 F(2; 3692) = 468.001 F(2; 2318) = 190.492
15
Figure 4. Well-being profile of European countries
Nordic high-rank wellbeing profile
Central Europe medium-rank well-being profile (WBGV=6.4) AT, BE, CH, DE, FI, GB, NL
Southern Europe medium-rank well-being profile (WBGV=6.2) FR, PT, SP
Eastern Europe low-rank well-being profile(WBGV=5.8) EE, HU, IE, PL, SI
Social disengagement low rank well-being profile (WBGV=5.5) CZ, IT, LI
16
Country-profiles were also compared in the distribution of well-being global by class and gender (Figure 5).
Figure 5. Well-being global volume by gender and social class in the different European countriesprofiles
Nordic high-rank wellbeing profile
17
Figure 5. Well-being global volume by gender and social class in the different European countries profiles (Cont.)
Eastern Europe Low-rank wellbeing profile(WBGV=5.8) Social disengaged low rank well-being profile (WBGV=5.5)
Within the higher rank well-being profile, gender differences are not statistically relevant. Differences between social classes are however identified (Welch (9; 267.984) = 26.354; p<0.001). The better
placed class locations in the social structure, entrepreneurs and executives and professionals and managers, have a similar well-being scores, which are higher than routine employees and industrial workers.
In Central European mid-rank being profile, gender and class present a combined effect in well-being values (Welch (9; 1415.059) = 128.313; p<0.001). Routine employees and industrial workers well-being
scores are significantly lower than the entrepreneurs and executives and the professionals and managers, for both men and women. There are no significant differences in well-being scores between genders in most social classes. However, the decrease ofwell-being scores in the categories of routine employees and industrial workers is more pronounced in the case of women. Female industrial workers present the lowest well-being volume in this group.
The cluster formed by France, Spain and Portugal reveal a significant higher well-being value in men than women (F(1; 2580) = 33.707; p<0.001). Considering the social class, well-being scores decrease
from entrepreneurs and executives to industrial workers (F(4; 2580) = 67.186; p<0.001), but due to an
interaction effect, the differences do not occur in the same way between men and women (F(4; 2580) = 4.0;
p<0.001). Among males, there are no differences in well-being volume difference between entrepreneurs and executives and self-employed, categories that present higher scores than routine employees and industrial workers. Professionals and managers and entrepreneurs and executivespresent the highest well-being volume. Among females, there is similarity in well-well-being scores between entrepreneurs and executives, professionals and managers and self-employed. These social classes present significantly higher scores that the routine employees and industrial workers. Men present higher well-being scores than women in all social classes except among entrepreneurs and executives.
Within the Eastern Europe low-rank well-being profile, men have higher values of well-being than women, independently of social class (no interaction). When comparing the social class means, the values
18
decrease as we advance in the categories from the entrepreneurs and executives to the industrial workers (Welch (9; 858.928) = 79.811; p<0.001).
Finally, in the social disengagement low-rank well-being profile the interaction between social class and gender gains again relevance (Welch (9; 691.703) = 69.021; p<0.001). Only within professional and
managers, routine employees and industrial workers, men have a higher well-being value than women. Among men, routine employees and industrial workers have a significantly lower well-being score than entrepreneurs and executives and professionals and managers. Among women, the values decrease as we advance in the categories (with a single similarity between the values of well-being of the self-employed and professionals and managers), decreasing among female routine employees and industrial workers. 5. CONCLUSION
In this working-paper, we present a multidimensional study on well-being inequalities in Europe. The analysis produced incorporates inputs from OECD Well-being Framework, advancing sociological contributions for the well-being dimensioning in terms of volume and structure, taking into account structural characteristics, protagonists and cultural orientations of the Europeans, providing an relevant overview of lifecircumstances as perceived by individuals.
The exercise allowed to observe that, in general, health status is the dimension that enhance the most well-being scores among Europeans, while the dimensions that most penalize these perceptions are linked with contextual conditions of social engagement (formal or informal; civic participation, social connections, environment concerns).
Secondly, it is important to stress the complex ways in which well-being scores and well-being patterns are shown to be intertwined with the multiple dimensions of social inequality. In terms of categorical inequalities, data suggest that men tend to show higher scores of well-being and that gender inequalities interact with class inequalities, in a way that inequalities tend to be higher in the scope of the less qualified social classes. Considering distributive inequality indicators, results confirm the relevance of education and income (with emphasis for the former) in predicting well-being global scores and well-being patterns across the OECD Europe.
In third place, we want to acknowledge how the individual’s profiles defined only by indicators of well-being were so clearly structured by the dimensions of social class and gender. The most favourable profile is clearly associated with social groups that concentrate material and symbolic resources, while the less favorable profile is associated with the less qualified Europeans, and with less material and symbolic resources. Complementarily, the other two profiles emphasized the importance of the gender in structuring life circumstances, by opposing the cluster with the greater preponderance of women – and therefore presenting a socioeconomic profile based on routine workers and professionals and managers – and a cluster with a greater preponderance of men – and higher proportion of more masculinised social occupation class such as self-employees and industrial workers. The two profiles are close in terms of the volume of well-being, differing in terms of the structure of the well-being, one being more penalised by feelings of insecurity and another by perceptions of social disengagement.
Our last remark accounts for the identified country profiles. At the aggregate level of analysis, different profiles were mostly defined in terms of volume of being (high, medium, and low-rank well-being), expressing some predicted regional affiliations. It was possible to conclude that even in an aggregated level of analysis, going from high-rank to low rank well-being profiles is going from higher to lower income and education resources, and from a social class composition that express higher to lower investment in qualified sectors of economy and welfare state development.
The developed analysis confirms the existence of plural intersections between categorical and distributive social inequalities and wellbeing volumes and patterns in Europe, with relevant implications at individual and national levels.
19 6. REFERENCES
Atkinson, A.B. (2015), Inequality: What Can Be Done?, Cambridge (Mass.), Harvard University Press. Bourdieu, P. (1979), La Distinction. Critique Sociale du Jugement, Paris, Les Editions de Minuit.
Carmo, R.M., N. Nunes (2013), “Class and social capital in Europe: a transnational analysis of the European Social Survey”, European Societies, 15 (3), pp. 373-387.
Costa, A.F., F.L.Machado, and J.F. Almeida (2009), “Social classes and educational assets: a transnational analysis”, in A.F:, F.L. Machado, and P.Ávila (Eds.), Knowledge andSociety (Portugal in the
European Context, vol. II), Oeiras, Celta Editora, pp. 5-20.
Costa, A.F., R. Mauritti (2018), “Classes sociais e interseções de desigualdades: Portugal e a Europa”, in: Carmo, R.M. et. al (Eds), Desigualdades Sociais, Parte II: Recursos e Categorias, Lisboa, Mundos Sociais, pp. 79-99.
Costa, A.F., R. Mauritti, S.C. Martins, F.L. Machado, andJ.F. Almeida (2002), “Social classes in Europe”,
Portuguese Journal of Social Science,1 (1), pp. 5-39.
Costa, A.F., R. Mauritti, S.C. Martins, N.Nunes and A.L. Romão (2018), “Distributional and Categorical Inequalities in Europe: Structural Configurations”, in Carmo, R.M., C.Rio and M.Medgyesi (Eds.),
Reducing Inequalities. A Challenge for the European Union?, London, Palgrave Macmillan, pp.
63-74.
Deaton, A. (2013), The Great Escape. Health, Wealth and the Origins of Inequality, Princeton and Oxford, Princeton University Press.
Dorling, D. (2010), Injustice. Why Social Inequality Persists, Bristol, The Policy Press. Dorling, D. (2017), The Equality Effect. Oxford, New Internationalist.
Mauritti, R., S.C. Martins, N. Nunes, A.L. Romão, and A.F. Costa (2016), “The social structure of European inequality: A multidimensional perspective”, Sociologia, Problemas e Práticas,81, pp. 75-93.
Milanovic, B. (2016), Global Inequality. A New Approach for the Age of Globalization, Massachusetts, Harvard University Press..
Nunes, N. (2013) Desigualdades Sociais e Práticas de Ação Coletiva na Europa, [Social Inequalities and Collective Action in Europe] Lisboa, Mundos Sociais.
OECD (2011), How’s Life? Measuring Well-Being, OECD Publishing, Paris. OECD (2013), How’s Life? Measuring Well-Being, OECD Publishing, Paris. OECD (2015), How’s Life? Measuring Well-Being, OECD Publishing, Paris.
OECD (2016), OECD Regional Well-Being: A User´s Guide, OECD Publishing, Paris. OECD (2017), How’s Life? Measuring Well-Being, OECD Publishing, Paris.
OECD (2017a), Measuring Distance to the SDG Targets: An Assessment of Where OECD Countries
Stand,
OECD (2018), Policy Coherence for Sustainable Development 2018: Towards Sustainable and Resilient
Societies, Paris: OECD Publishing.
OECD (2018a), Opportunities for All: A Framework for Policy Action on Inclusive Growth, Paris: OECD Publishing.
Sen A (2009) The Idea of Justice. London: Allen Lane/Penguin.
Stiglitz, J.E. (2012), The Price of Inequality: How Today’s Divided Society Endangers our Future, WW Norton & Company, NewYork.
Therborn, G. (2013), The Killing Fields of Inequality, Cambridge, UK, Polity Press.
Therborn, G.(org.) (2006), Inequalities of the World. New Theoretical Frameworks, Multiple Empirical
Approaches, Londres, Verso.
Tilly, C.S.(1998), Durable Inequality, Berkeley, CA, University of California Press.
Wilkinson, R., K.Pickett (2009), The Spirit Level: Why More Equal Societies Almost Always Do Better, Londres,Penguin.
20 APPENDIX
Table A1. ACM Class locations by Occupation and Employment status Employment status Self-employment with
employees
Self-employment without employees (own account workers)
Employees Occupations ISCO08
1 Managers EE EE EE
2 Professionals EE EE PM
3 Technicians and associate professionals EE EE PM
4 Clerical support workers EE SE RE
5 Services and sales workers EE SE RE
6 Skilled agricultural, forestry and fishery
workers EE SE IW
7 Craft and related trades workers EE SE IW
8 Plant and machine operators, and
assemblers EE SE IW
9. Elementary Occupations
9.1 Cleaners and helpers EE SE RE
9.2 Agricultural, forestry and fishery
labourers EE SE IW
9.3 Labourers in mining, construction,
manufacturing and transport EE SE IW
9.4 Food preparation assistants EE SE RE
9.5 Street and related sales and services
workers EE SE RE
9.6 Refuse workers and other elementary
workers EE SE RE
Notes. ISCO08: International Standard Classification of Occupations 2008. ACM Class locations: Entrepreneurs and Executives – EE, Professionals and Managers – PM, Self-employed – SE , Routine Employees – RE, Industrial Workers – IW
Table A2. ESS 2016 questions selection for well-being indicators and dimensions
Dimensions Indicators ESS2016 Questions
1. Income and Wealth
1.1 Household income necessities
E40 And during the next 12 months how likely is it that there will be some periods when you don’t have enough money to cover your household necessities?
1.2 Household wealth conditions F42 Which of the descriptions on this card comes closest to how you feel about your household’s income nowadays?
2. Jobs and Earnings
2.1 Labour Market insecurity
E39 Please tell me how likely it is that during the next 12 months you will be unemployed and looking for work for at least four consecutive weeks?
2.2 Job strain
F27 how much the management at your work allows/allowed you…
F28 how much the management at your work allows/allowed you…
2.3 Long-term unemployment
F36 Have you ever been unemployed and seeking work for a period of more than three months?
F37 Have any of these periods lasted for 12 months or more? F38 Have any of these periods been within the past 5 years?
3. Work-Life Balance 3.1 Time off C2 Using this card, how often do you meet socially with friends, relatives or work colleagues
21
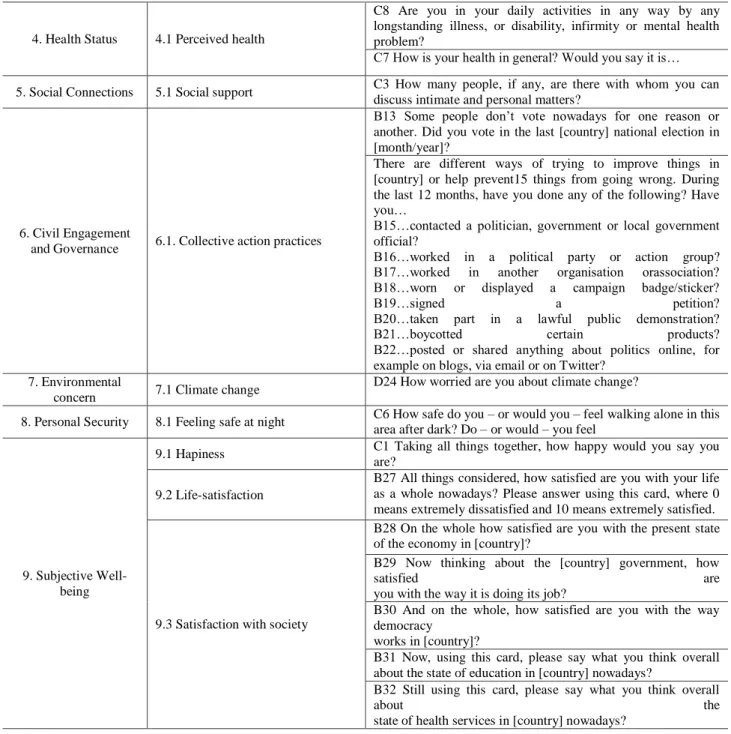
Table A2. ESS 2016 questions selection for well-being indicators and dimensions
4. Health Status 4.1 Perceived health
C8 Are you in your daily activities in any way by any longstanding illness, or disability, infirmity or mental health problem?
C7 How is your health in general? Would you say it is… 5. Social Connections 5.1 Social support C3 How many people, if any, are there with whom you can
discuss intimate and personal matters?
6. Civil Engagement
and Governance 6.1. Collective action practices
B13 Some people don’t vote nowadays for one reason or another. Did you vote in the last [country] national election in [month/year]?
There are different ways of trying to improve things in [country] or help prevent15 things from going wrong. During the last 12 months, have you done any of the following? Have you…
B15…contacted a politician, government or local government official?
B16…worked in a political party or action group? B17…worked in another organisation orassociation? B18…worn or displayed a campaign badge/sticker?
B19…signed a petition?
B20…taken part in a lawful public demonstration? B21…boycotted certain products? B22…posted or shared anything about politics online, for example on blogs, via email or on Twitter?
7. Environmental
concern 7.1 Climate change
D24 How worried are you about climate change?
8. Personal Security 8.1 Feeling safe at night C6 How safe do you – or would you – feel walking alone in this area after dark? Do – or would – you feel
9. Subjective Well-being
9.1 Hapiness C1 Taking all things together, how happy would you say you are?
9.2 Life-satisfaction
B27 All things considered, how satisfied are you with your life as a whole nowadays? Please answer using this card, where 0 means extremely dissatisfied and 10 means extremely satisfied.
9.3 Satisfaction with society
B28 On the whole how satisfied are you with the present state of the economy in [country]?
B29 Now thinking about the [country] government, how
satisfied are
you with the way it is doing its job?
B30 And on the whole, how satisfied are you with the way democracy
works in [country]?
B31 Now, using this card, please say what you think overall about the state of education in [country] nowadays?
B32 Still using this card, please say what you think overall
about the
22 Table A3. Sample description
Characterization
Gender
Total Male Female
N % n % n %
Equivalent income deciles EU €
<= 5040 1006 9.6% 1137 10.5% 2144 10.1% 5041 - 8250 1058 10.1% 1152 10.7% 2209 10.4% 8251 - 9375 952 9.1% 1093 10.1% 2045 9.6% 9376 - 11187 1064 10.1% 1298 12.0% 2362 11.1% 11188 - 12388 1120 10.7% 1117 10.3% 2237 10.5% 12389 - 13428 971 9.3% 979 9.1% 1950 9.2% 13429 - 15416 1020 9.7% 955 8.8% 1975 9.3% 15417 - 17954 1225 11.7% 1132 10.5% 2357 11.1% 17955 - 26996 952 9.1% 944 8.7% 1896 8.9% >=26997 1119 10.7% 999 9.2% 2118 9.9% Total 10487 100.0% 10807 100.0% 21294 100.0% Level of education Basic 3246 25.9% 3182 24.5% 6428 25.2% Upper secondary 5307 42.4% 5277 40.6% 10585 41.5% Higher 3973 31.7% 4545 35.0% 8518 33.4% Total 12526 100.0% 13005 100.0% 25530 100.0% Social Class (5 categories)
Entrepreneurs and executives (EE) 2295 19.0% 1370 11.3% 3665 15.1% Professionals and managers (PM) 3246 26.9% 4171 34.3% 7416 30.6% Self-employed (SE) 760 6.3% 592 4.9% 1352 5.6% Routine employees (RE) 2027 16.8% 4888 40.2% 6915 28.6% Industrial workers (IW) 3720 30.9% 1137 9.4% 4857 20.1% Total 12047 100.0% 12158 100.0% 24206 100.0% Total Gender 12526 49.1% 13005 50.9% 25530 100.0%
Table A4.Education and income sample description
n Minimum Maximum Mean Std. Dev. Years of full-time
education completed 25233 0 48 13.65 3.922
Equivalent income 1000€ 21294 2.57 82.60 13.97 8.394 Valid N (listwise) 21151
23 TableA6. Correlation scores among well-being dimensions
Well-being dimensions Income and wealth Jobs and earnings Work-life balance Health status Social connections Civil engagement and governance Environmental concern Personal security Income and wealth
Jobs and earnings 0.525**
Work-life balance 0.124** 0.074**
Health status 0.220** 0.144** 0.085**
Social connections 0.230** 0.150** 0.235** 0.078**
Civil engagement and
governance 0.166** 0.141** 0.169** -0.004 0.227** Environmental concern 0.005 -0.010 0.033** -0.053** 0.056** 0.197** Personal security 0.186** 0.129** 0.099** 0.131** 0.134** 0.126** -0.037** Subjective well-being 0.440** 0.299** 0.159** 0.287** 0.211** 0.062** -0.007 0.183* * ** p<0.01
Table A6. Well-being dimention scores by country (mean)
Country Income and wealth Jobs and earnings Work-life balance Health status Social connections Civil engagement and governance Environmental concern Personal security Subjective well-being Austria 7.3 7.1 6.5 8.8 5.4 2.5 5.2 6.9 7.0 Belgium 7.1 6.9 6.8 8.2 5.3 2.4 5.5 6.9 6.9 Switzerland 7.8 7.4 7.0 8.9 5.8 2.2 5.4 8.0 7.7 Czech Republic 6.4 6.5 6.3 8.3 3.5 1.6 4.5 6.1 6.4 Germany 7.6 7.2 6.4 7.6 5.8 2.7 6.0 6.5 6.9 Denmark 8.5 7.0 7.0 8.2 5.6 2.6 -- 8.2 7.3 Estonia 6.5 6.6 5.5 7.9 4.1 1.6 4.2 7.0 6.3 Spain 6.4 5.9 6.9 8.6 5.2 2.8 6.3 7.2 6.8 Finland 7.0 7.0 6.5 8.1 5.1 3.1 5.2 8.0 7.2 France 6.3 6.3 7.0 8.0 4.5 2.3 5.8 7.1 6.2 United Kingdom 7.3 7.3 6.1 8.5 5.3 2.5 4.9 7.1 6.6 Hungary 6.3 6.7 4.1 8.6 4.0 1.1 5.2 6.5 6.2 Ireland 6.7 6.9 5.9 8.9 4.8 2.0 4.7 7.2 6.6 Iceland 7.7 7.8 7.2 8.3 5.7 4.3 5.2 8.6 7.1 Italy 5.7 6.4 6.1 8.9 3.5 1.7 5.5 5.8 6.1 Lithuania 5.3 6.2 4.7 8.2 3.1 1.2 4.6 5.5 5.7 Netherlands 7.8 7.1 7.6 8.2 5.9 2.4 5.0 7.0 7.1 Norway 8.2 7.8 7.3 8.2 5.3 3.3 5.0 8.4 7.4 Poland 6.3 6.3 5.0 8.3 4.9 1.5 4.5 7.1 6.7 Portugal 5.5 6.9 8.0 8.2 4.4 2.2 6.2 7.1 6.3 Sweden 8.7 7.7 7.7 8.4 6.2 3.5 4.7 7.7 6.9 Slovenia 7.1 6.8 6.0 8.1 4.5 1.7 5.5 7.8 6.2