The effect of conservation measures on the spatial and
temporal variation of rocky fish assemblages in the Arrábida
Marine Park.
BÁRBARA BASTOS HORTA E COSTA
Tese de Doutoramento em Ciências da Terra, do Mar e do Ambiente, ramo de Ciências do Mar, especialidade de Processos e ecossistemas marinhos
Orientadores/ Supervisors: Prof Doutor Emanuel Gonçalves Prof. Doutor Karim Erzini Prof. Doutor Jennifer Caselle
Título da Tese: O efeito das medidas de protecção na variação espacial e
temporal das comunidades de peixes do recife rochoso do Parque Marinho da
Arrábida.
Declaração de autoria de trabalho:
Declaro ser o(a) autor(a) deste trabalho, que é original e inédito. Autores e trabalhos
consultados estão devidamente citados no texto e constam da listagem de referências incluída.
Copyright: Bárbara Bastos Horta e Costa
A Universidade do Algarve tem o direito, perpétuo e sem limites geográficos, de arquivar e
publicitar este trabalho através de exemplares impressos reproduzidos em papel ou de forma
digital, ou por qualquer outro meio conhecido ou que venha a ser inventado, de o divulgar
através de repositórios científicos e de admitir a sua cópia e distribuição com objectivos
educacionais ou de investigação, não comerciais, desde que seja dado crédito ao autor e
NOME: Bárbara Bastos Horta e Costa
FACULDADE: Faculdade de Ciências e Tecnologia (FCT) / Universidade do Algarve
ORIENTADORES: Prof. Doutor Emanuel Gonçalves (ISPA – UIEE); Prof. Doutor Karim Erzini (UAlg – FCT/CCMAR); Prof. Doutor Jennifer Caselle (UCSB – MSI)
DATA: 2013
TÍTULO DA TESE: O efeito das medidas de protecção na variação espacial e temporal das comunidades de peixes do recife rochoso do Parque Marinho da Arrábida.
Resumo:
As áreas marinhas protegidas (AMPs) têm sido amplamente propostas para cumprir objectivos de conservação e como ferramenta de gestão das pescas. O parque marinho da Arrábida é a primeira AMP em Portugal continental com um plano de gestão, completamente implementado desde 2009. O principal objectivo deste estudo foi a avaliação do efeito das medidas de protecção na comunidade de peixes de recife rochoso e invertebrados comerciais, comparando dados antes-depois e controlo-efeito (reserva vs. áreas de pesca) obtidos através de censos visuais subaquáticos e da análise dos padrões de descargas em lota. Em segundo lugar, amostrámos a actividade da pesca antes, durante e depois da implementação do plano de gestão com o objectivo de compreender as preferências dos pescadores pelas zonas de pesca e a sua adaptação às restrições. Também avaliámos o efeito reserva através da análise conjunta das respostas ecológicas e dos padrões de densidade do esforço de pesca. Em terceiro lugar, identificámos as principais variáveis oceanográficas que influenciam a estrutura da comunidade de peixes de recife e modelámos previsões para a estrutura dessa comunidade para os últimos 50 anos, à luz das alterações climáticas.
No geral, os resultados sugerem respostas positivas em biomassa, embora ainda não em números para algumas espécies comerciais, o que não aconteceu para as espécies não comerciais. O efeito reserva é reforçado pelo aumento das descargas em lota de espécies comerciais, apesar do aumento da densidade do esforço de pesca em algumas áreas, especialmente dos covos para captura de polvo. Os pesqueiros são principalmente escolhidos com base na distribuição das espécies comerciais e seus habitats associados, mas a distância ao porto, as condições do mar e a segurança também influenciam as escolhas dos pescadores. Além disso, as diferentes pescarias respondem de forma diferente às medidas de protecção, e
dentro de cada arte de pesca, os pescadores mostram estratégias distintas, com alguns a operar numa área mais extensa enquanto outros mantêm territórios preferidos. Os nossos resultados mostram que o vento e a temperatura são as principais variáveis oceanográficas a influenciar a estrutura da comunidade de peixes do recife rochoso, que revela uma tropicalização associada a uma deslocação de espécies para norte nos últimos 50 anos, consistente com os padrões da temperatura. Acreditamos que este estudo apresenta importantes conclusões para a conservação marinha e gestão dos sistemas costeiros.
Palavras-chave: Áreas Marinhas Protegidas, pesca artesanal, peixes de recife rochoso, sistemas temperados, Portugal
NAME: Bárbara Bastos Horta e Costa
FACULTY: Faculdade de Ciências e Tecnologia (FCT) / Universidade do Algarve
SUPERVISORS: Prof. Doutor Emanuel Gonçalves (ISPA – UIEE); Prof. Doutor Karim Erzini (UAlg – FCT/CCMAR); Prof. Doutor Jennifer Caselle (UCSB – MSI)
DATE: 2013
THESIS TITLE: The effect of conservation measures on the spatial and temporal variation of rocky fish assemblages in the Arrábida Marine Park.
Abstract:
Marine protected areas (MPAs) have been widely proposed for conservation purposes and as a tool for fisheries management. The Arrábida Marine Park is the first MPA in continental Portugal having a management plan, fully implemented since 2009. The main objective of this study was to evaluate the effect of protection measures on rocky reef fish assemblages and target invertebrates through before-after and control-effect (no-take vs. fished areas) underwater visual surveys and analysis of landings trends. Second, we used surveys before, during and after implementation of the management plan to understand fishers‟ preferences for fishing grounds and adaptation to the new rules, and evaluated the reserve effect through analysis of both ecological responses and fishing effort density. Third, we identified the main oceanographic drivers influencing the structure of reef fish assemblages and predicted the community structure for the last 50 years, in light of climatic change.
Overall results suggest positive responses in biomass but not yet in numbers of some commercial species, with no effects on non-target species. The reserve effect is reinforced by the increase in landings of commercial species, despite increased fishing effort density in some areas, especially with octopus traps. Fishing grounds are mainly chosen based on the distribution of target species and associated habitats, but distance to port, weather conditions and safety also influence fishers‟ choices. Moreover, different fisheries respond differently to the protection measures, and within each fishery, individual fishers show distinct strategies, with some operating in a broader area whereas others keep preferred territories. Our results also show that wind stress and temperature are the main oceanographic drivers for rocky reef fish assemblages, with tropicalization of assemblages and polewards movements of species
over the last 50 years consistent with temperature trends. We believe this study provides significant lessons for marine conservation and management of coastal systems.
Keywords: Marine Protected Areas, artisanal fisheries, rocky reef fish assemblages, temperate systems, Portugal
Resumo alargado:
As áreas marinhas protegidas (AMPs) têm sido amplamente propostas para cumprir objectivos de conservação e como ferramentas de gestão das pescas. Diversos estudos sugerem o seu potencial para a protecção dos recursos e dos ecossistemas bem como podendo contribuir para a exportação de adultos e juvenis para as zonas adjacentes, beneficiando a pesca. No entanto, os efeitos da protecção dependem do contexto ecológico e socioeconómico local bem como dos objectivos da criação das AMPs.
O parque marinho da Arrábida é a primeira AMP em Portugal continental com um plano de gestão que inclui diferentes medidas de protecção, tendo sido aprovado em 2005 e está completamente implementado desde 2009. Os objectivos da criação desta AMP incluem a conservação dos ecossistemas e das espécies bem como a sustentabilidade da pesca artesanal local, que tem uma grande tradição cultural na zona. Esta área possui uma grande variedade de espécies e habitats e situa-se numa zona de transição biogeográfica entre águas temperadas quentes e frias, o que aumenta a sua biodiversidade, mas também faz com que haja uma variabilidade inter-anual na estrutura da comunidade de espécies em relação às condições climáticas. O principal objectivo deste estudo foi a avaliação do efeito das medidas de protecção na comunidade de peixes de recife rochoso e invertebrados comerciais, comparando dados antes-depois (dentro da reserva) e controlo-efeito (reserva vs. áreas de pesca) obtidos através de censos visuais subaquáticos. A caracterização dos habitats também foi realizada para poder detectar possíveis diferenças entre zonas com diferentes medidas de protecção, o que pode influenciar as diferenças ecológicas entre essas zonas. Foram realizados modelos lineares generalizados, bootstraps, e análises multivariadas. Foram analisados os padrões de descargas em lota também de forma a detectar os possíveis efeitos da reserva em algumas espécies com interesse comercial. Em segundo lugar, amostrámos a distribuição da actividade da pesca antes, durante e depois da implementação do plano de gestão com o objectivo de compreender as preferências dos pescadores pelas zonas de pesca e a sua adaptação às novas regras, que foram sendo sucessivamente implementadas desde 2005 até 2009. Foram usadas diferentes ferramentas da estatística espacial, algumas ferramentas de estudo de territórios, adaptadas de investigações de comportamento animal e utilização de habitat, bem como modelos aditivos generalizados e modelos com inflação de zeros. No final deste trabalho avaliámos o efeito reserva através da análise conjunta dos padrões de respostas ecológicas e de densidade do esforço de pesca. Um terceiro objectivo consistiu em identificar as principais variáveis oceanográficas que podem influenciar a estrutura da comunidade de peixes de recife
recorrendo a dados de presença/ausência de espécies obtidos através de censos visuais durante 12 anos, a dados de resolução local e regional de várias variáveis oceanográficas e a modelos de árvores de regressão multivariada. Através do melhor modelo descritivo seleccionado, realizámos modelação preditiva para a estrutura dessa comunidade para os últimos 50 anos, à luz das alterações climáticas.
No geral, os resultados sugerem respostas positivas em biomassa, embora ainda não em números para algumas das espécies comerciais, que aparentemente não se devem a diferenças no habitat entre zonas, o que não aconteceu para as espécies não comerciais. O efeito reserva é reforçado pelo aumento das descargas em lota de espécies comerciais, apesar do aumento da densidade do esforço de pesca em algumas áreas, especialmente dos covos para captura de polvo. Os pesqueiros são principalmente escolhidos com base na distribuição das espécies comerciais e seus habitats associados, mas a distância ao porto, as condições do mar e a segurança também influenciam as escolhas dos pescadores. Além disso, as diferentes pescarias respondem de forma diferente às medidas de protecção, e dentro de cada arte de pesca os pescadores mostram estratégias distintas, com alguns a operar numa área mais extensa enquanto outros mantêm territórios preferidos. Alguns pescadores a operar com covos também parecem ser influenciados pela proximidade à área de protecção total. Os nossos resultados mostram que o vento e a temperatura são as principais variáveis oceanográficas a influenciar a estrutura da comunidade de peixes do recife rochoso, que revela uma tropicalização associada a uma deslocação de espécies para norte nos últimos 50 anos, o que é consistente com os padrões da temperatura. Acreditamos que este estudo apresenta importantes conclusões para a conservação marinha e gestão dos sistemas costeiros.
Palavras-chave: Áreas Marinhas Protegidas, pesca artesanal, peixes de recife rochoso, sistemas temperados, Portugal
Support
This study was funded by the Foundation for Science and Technology – Portugal (FCT): PhD grant (SFRH/BD/41262/2007). Most of the data used in this study was collected by the author with her colleagues during the course of the project “BIOMARES: Management and Restoration of Biodiversity in the Marine Park Site Arrábida-Espichel” – A LIFE project (LIFE06 NAT/P/000192; 2007-2010). Part of the data used here was collected by some co-authors of the published manuscripts.
Apoio
Este estudo foi suportado através de uma bolsa de Doutoramento concedida pela Fundação para a Ciência e Tecnologia (FCT): Bolsa de Doutoramento (Ref: SFRH/BD/41262/2007). A maior parte dos dados utilizados neste estudo foi obtida no âmbito do projecto “BIOMARES: Gestão e Recuperação da Biodiversidade no Parque Marinho Prof. Luiz Saldanha” – um projecto LIFE (LIFE06 NAT/P/000192; 2007-2010). Parte dos dados usados foi recolhida por alguns dos co-autores dos trabalhos publicados.
Acknowledgements
Before anything else I must say I could never succeed in this dissertation without all the valuable help and contributions I had all these years.
Special thanks to Dr. Emanuel Gonçalves, Dr. Karim Erzini and Dr. Jennifer Caselle for accepting being my advisors and for helping me so much during this long journey. I really learned a lot with them in several ways, and I will be always thankful for all the support, time, dedication, effort, patience and valuable and timely advices throughout this study.
Particular thanks to my work team, especially Henrique Folhas and Gustavo Franco. Without them I could not conduct all the surveys. They were always in a good mood to dive and count fish but also to discuss all the doubts we had during our field work and study design. They were always motivated even with all the cold we had after consecutive dives, during consecutive months. They are a big part of this work.
I also want to thank to my colleagues from our ISPA lab: Diana Rodrigues, Ana Faria, Rita Borges and from the Biomares team: Vasco Ferreira, Diogo Paulo, Joana Boavida, Ana Jesus, Marina Mendes, Francisco Pires, Sandra Rodrigues, Alexandra Cunha for all the support when needed.
I want to thank to Dr. Miguel Henriques for all the marine park support, his numerous contributions and information provided, but also to the park rangers Carlos Silva and Antonio Mourato for all the field work they helped always promptly.
Thanks to all co-authors of the manuscripts of this dissertation, especially Marisa Batista, Leonel Gonçalves and Jorge Assis. Some chapters were largely improved due to their valuable collaboration in planning, analysing and interpreting data.
Thanks to Dr. Brian Kinlan, Dr. Craig Syms, Dr. Jorge Cadima, Dr. Rita Borges, Dr. Robert Warner and Dr. Steven Gaines for all the valuable advices during the course of this study. Big thanks to my friends Laura Leite, Marina Mendes, Joana Miodonski, Helena Guimarães, Jorge Assis for being special friends in all important moments. I love you.
Thanks to Sarah Teck and Julio Lorda for their important role in a special phase of my life, they hosted me in Santa Barbara, California while I was far from home, pregnant and alone. They took care of me with friendship.
Thanks to all my friends and family, from Lisbon, Faro, and from the world... They gave me really good moments throughout this period.
Huge thanks to my mother, father and sister. They are my roots and what I am and do are deeply related to them. They give me strength any time I need.
Finally, my special thanks go to Vasco, my husband and lover for all the moments. He supported me in all the good and not so good moments I had during this long journey. He stood for my absences, my tiredness, my stress. He cooked for me and spoiled me all the time.
But he also gave me strength for being motivated most of the time. Above all, deep thanks for being the father of my beautiful daughter, the fruit of our love, but also of our passion for the ocean, nature, quality of life, and our unique and amazing concept of what is really good life style and happiness! We were born to be happy and enjoy this wonderful world together. I dedicate this work to my daughter Concha. She inspired me in all the moments even before she was born. She is part of me and I am part of her, like flesh to flesh. She is so like me... She had to stand for moments when I was not so focused on her, but my deepest love and dedication goes to her. I hope someday she could be proud of her mother, which loves her more than herself.
Table of Contents
Resumo: ... i Abstract: ... iii Resumo alargado: ... v Acknowledgements ... viii Table of Contents ... xi List of Figures ... xvList of Tables ... xix
CHAPTER 1: GENERAL INTRODUCTION ... 1
1.1 The role of marine conservation ... 2
1.2 The science of marine protected areas ... 3
1.3 The model system ... 8
1.4 Dissertation goals ... 10
1.5 List of manuscripts ... 12
1.6 References ... 13
CHAPTER 2: THE RESERVE EFFECT WITHIN A TEMPERATE MARINE PROTECTED AREA IN THE NORTH-EASTERN ATLANTIC (THE ARRÁBIDA MARINE PARK, PORTUGAL) ... 17
2.1 Abstract ... 18
2.2 Introduction ... 18
2.3 Methods ... 21
2.3.1 Study area ... 21
2.3.2 Community survey methodology ... 22
2.3.3 Data Analysis ... 25
2.3.3.1 „Control – effect‟ comparison ... 25
2.3.3.2 „Before – after‟ comparison ... 27
2.3.3.3 Landings data ... 28
2.4 Results ... 29
2.4.1 Control – effect comparison ... 29
2.4.2 Before – after comparison... 32
2.4.3 Landings data ... 34
2.5 Discussion ... 36
2.6 Acknowledgements ... 40
2.7 References ... 41
CHAPTER 3: FISHERIES DISTRIBUTION AND FISHERS’ ADAPTATIONS TO
PROTECTION MEASURES ... 45
CHAPTER 3A: FISHERS’ BEHAVIOUR IN RESPONSE TO THE IMPLEMENTATION OF A MARINE PROTECTED AREA ... 46
3A.1 Abstract ... 47
3A.2 Introduction ... 47
3A.3 Methods ... 50
3A.3.1 Study area ... 50
3A.3.2 Sampling surveys ... 52
3A.3.3 Data analysis ... 54
3A.4 Results ... 56
3A.4.1 Traps ... 56
3A.4.2 Nets ... 59
3A.4.3 Jigs ... 61
3A.4.4 Hotspot analysis and individual vessels trends ... 63
3A.5 Discussion ... 67
3A.6 Acknowledgments ... 72
3A.7 References ... 73
3A.8 Supplementary Information ... 76
3A.8.1 Text 3A.S1 - Hotspot analysis and individual vessels trends ... 76
3A.8.2 Tables 3A.S ... 78
3A.8.3 Figures 3A.S ... 81
CHAPTER 3B: VESSELS’ SITE FIDELITY AND SPATIO-TEMPORAL DISTRIBUTION OF ARTISANAL FISHERIES BEFORE THE IMPLEMENTATION OF A TEMPERATE MULTIPLE-USE MARINE PROTECTED AREA ... 84
3B.1 Abstract ... 85 3B.2 Introduction ... 85 3B.3 Methods ... 87 3B.3.1 Study Area ... 87 3B.3.2 Sampling ... 89 3B.3.3 Data Analysis ... 90
3B.3.3.1 Zero inflated data modelling ... 90
3B.3.3.2 Spatial analysis ... 92
3B.4.1 Zero inflated data modelling ... 95 3B.4.2 Spatial analysis ... 96 3B.5 Discussion ... 102 3B.6 Acknowledgments ... 107 3B.7 References ... 108 3B.8 Supplementary Information ... 111
3B.8.1 Text 3B.S1 – Description of the Topographic measurements ... 111
CHAPTER 4: CLIMATIC INFLUENCE IN THE ROCKY REEF FISH ASSEMBLAGES OF THE ARRÁBIDA MARINE PARK ... 112
CHAPTER 4A: TROPICALIZATION OF FISH ASSEMBLAGES AT TEMPERATE BIOGEOGRAPHIC TRANSITION ZONES ... 113
4A.1 Abstract ... 114
4A. 2 Introduction ... 114
4A.3 Methods ... 117
4A.3.1 Study area ... 117
4A.3.2 Data collection ... 117
4A.3.3 Data analysis ... 119
4A.3.3.1 Descriptive models ... 119
4A.3.3.2 Indicator species ... 119
4A.3.3.3 Semblance analysis ... 120
4A.3.3.4 Predictive models ... 120
4A.3.3.5 Community indices ... 121
4A.4 Results ... 122
4A. 5 Discussion ... 128
4A. 6 Acknowledgements ... 133
4A.7 References ... 133
4A.8 Supplementary Information ... 138
4A.8.1 Tables 4A.S ... 138
4A.8.2 Figures 4A.S ... 143
CHAPTER 4B: FIRST OCCURRENCE OF THE MONROVIA DOCTORFISH ACANTHURUS MONROVIAE [PERCIFORMES: ACANTHURIDAE] IN EUROPEAN ATLANTIC WATERS ... 144
4B.2 Introduction ... 145 4B.3 Methods ... 145 4B.4 Results ... 146 4B.5 Discussion ... 149 4B. 7 Ackowledgements ... 150 4B.8 References ... 150
CHAPTER 5: GENERAL DISCUSSION ... 152
5.1 Importance of the Arrábida Marine Park ... 153
5.2 Summary of results ... 154
5.2.1 Recent reserve effect ... 154
5.2.2 Adequacy of zoning ... 155
5.2.3 Fishery benefits ... 156
5.2.4 Fishing gears ... 157
5.3 Combining and interpreting ecological and fisheries data ... 158
5.3.1 Octopus ... 158
5.3.2 White seabream ... 162
5.4 Climatic influence in the Arrábida Marine Park ... 164
5.4.1 Climatic influence in a continental island ... 165
5.4.2 „Barometer‟ of climate change ... 166
5.5 MPAs and fisheries in a warming ocean ... 167
5.6 Conclusions and future directions ... 167
List of Figures
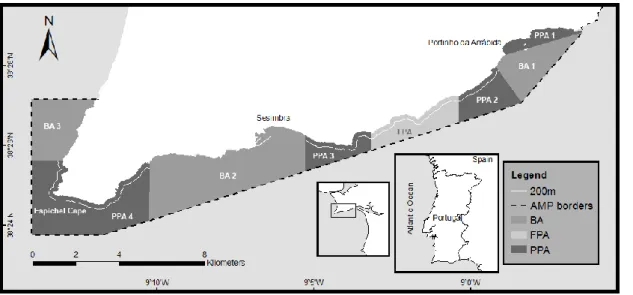
Figure 1.1 - Arrábida Marine Park zoning map. FPA: fully protected area; PPA 1 to 4: partially
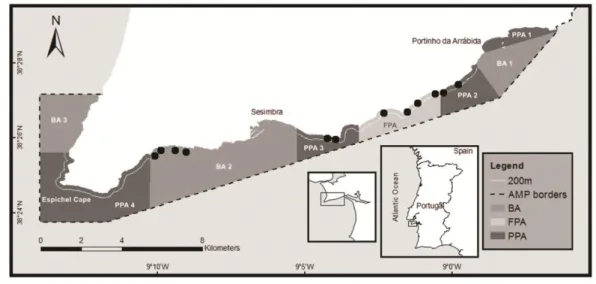
protected areas; BA 1 to 3: buffer areas... 9 Figure 2.1 - Arrábida Marine Park zoning map. FPA: fully protected area; PPA 1 to 4: partially
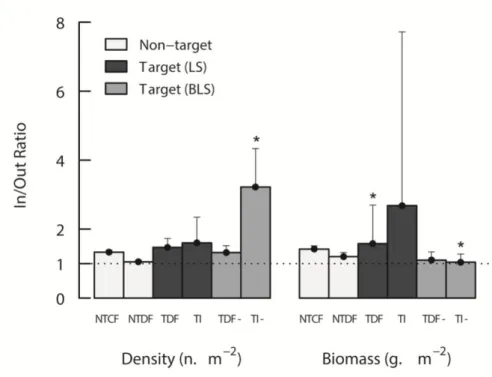
protected areas; BA 1 to 3: buffer areas. Black dots: survey sites (outside the reserve: four sites in BA2; inside the reserve: four sites in PPAs 2 and 3, and four sites in FPA)... 21 Figure 2.2 - Response In/Out reserve ratio ± SE for density (n.m-2) and biomass (g.m-2) of
non-target (white bars), legal-size (black bars) and below legal size (grey bars; indicated with -) non-target groups; NTCF: Non-target cryptobenthic fish; NTDF: non-target demersal fish; TDF: target demersal fish; TI: target invertebrates. Ratios greater than 1 indicate that response variables are
higher inside the reserve. *: significant ratios (GLM results)... 29
Figure 2.3 - Response In/Out reserve ratio ± SE for: (a) density (n.m-2) and (b) biomass (g.m-2) of the most frequently observed non-target (open circles), legal-size (black circles) and below legal size (open diamond; indicated with (-)) target species in the Arrábida Marine Park. Ratios greater than 1 indicate that response variables are higher inside reserve. Significant ratios are indicated
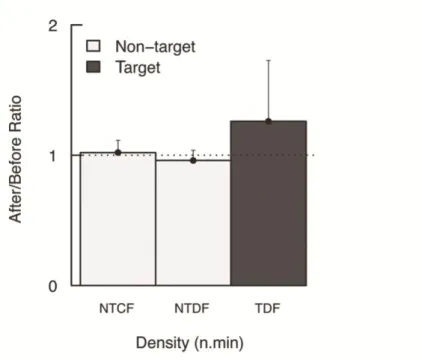
with *... ... 32 Figure 2.4 - Response ratio After/Before the implementation of the management plan ± SE for
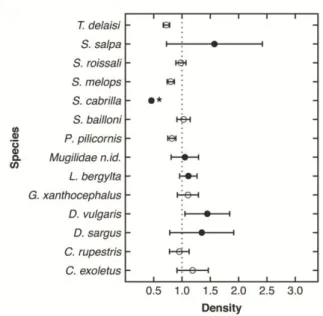
density (n.min-1) of non-target (white bars) and target (black bar) groups; NTCF: Non-target cryptobenthic fish; NTDF: non-target demersal fish; TDF: target demersal fish. Ratios greater than 1 indicate that response variables are higher inside the reserve... 33 Figure 2.5 - Response ratio After/Before the implementation of the management plan ± SE for
density (n.min-1) of the most frequently observed non-target (open circles) and target (black circles) species in the Arrábida Marine Park. Ratios greater than 1 indicate that response variables are
higher in the after period. Significant ratios are indicated with *... 34 Figure 2.6 - Annual fisheries landings (kg) by the number of active licensed vessels of Diplodus
vulgaris, Diplodus sargus and Diplodus spp (x axis). Landings of Octopus vulgaris (kg/no. of
active licensed vessels) are in the right y axis. Data is from vessels with a license to fish in the park. No data are available for 2002 (Source: General Directorate of Fisheries and Aquaculture, DGPA). The vertical grey line in 2006 marks the start of the implementation of the management
plan approved in August 2005... 35 Figure 3A.1 - Map of the Arrábida Marine Park with zoning implemented by the management plan. Zoning: BA – Buffer areas; PPA – Partially-protected areas, FPA – Fully-protected area (divided in FPA1 and FPA2 due to the transitory phase of the management plan implementation – see
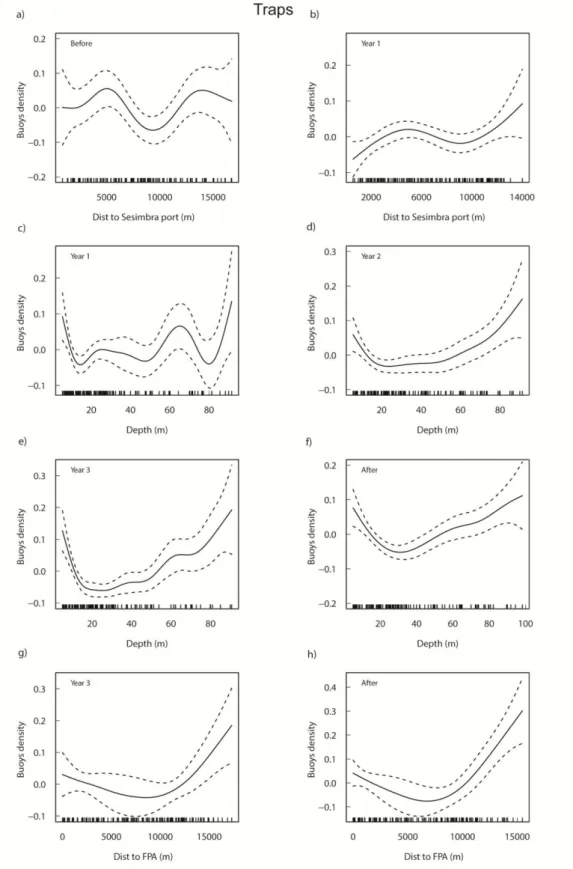
Methods). Bathymetry and main habitat types are shown (Cunha et al., 2011)... 50 Figure 3A.2 - Additive fits of the significant predictor variables to the density of trap buoys for
each period. Distance to Sesimbra port (a, b), depth (c-f), and distance to FPA (g, h) from the significant periods of the selected GAMs(see Table 3A.S1) are shown. Tick marks above the x-axis indicate the distribution of observations and the y-x-axis shows the contribution of the smoother to the fitted values. The solid line is the estimated smoothing curve and the dotted lines show the 95% confidence intervals... 58 Figure 3A.3 - Additive fits of the significant predictor variables to the density of nets buoys for
each period. Distance to Sesimbra port (a-d), depth (e-g) and distance to PPA (h, i) and to FPA (j) from the significant periods of the selected GAMs(see Table 3A.S2) are shown. Tick marks above the x-axis indicate the distribution of observations and the y-axis shows the contribution of the smoother to the fitted values. The solid line is the estimated smoothing curve and the dotted lines show the 95% confidence intervals... 60
Figure 3A.4 - Additive fits of the significant predictor variables to the density of jig vessels for each period. Distance to Sesimbra port (a, b), depth (c-f), and distance to PPA (g) from the significant periods of the selected GAMs(see Table 3A.S3) are shown. Tick marks above the x-axis indicate the distribution of observations and the y-x-axis shows the contribution of the smoother to the fitted values. The solid line is the estimated smoothing curve and the dotted lines show the 95% confidence intervals. Negative distances refer to jig vessels fishing inside the PPA... 62 Figure 3A.5 - Maps obtained from the hotspot analyses of trap buoys for each period. The location of significant clusters (GIZScore > 1.96) by period (a – Before, b – Year 1, c – Year 2, d – Year 3, e – After), and the different protection levels at the Arrábida Marine Park are shown: BA – buffer area; PPA – partial protection area; FPA – fully protected area (see Methods for a detailed description of the protection levels in the park and their implementation through time). The 200 m offshore line is also shown... 64 Figure 3A.6 - Maps obtained from the hotspot analyses of nets buoys for each period. The location of significant clusters (GIZScore > 1.96) by period (a – Before, b – Year 1, c – Year 2, d – Year 3, e – After), and the different protection levels at the Arrábida Marine Park are shown: BA – buffer area; PPA – partial protection area; FPA – fully protected area (see Methods for a detailed description of the protection levels in the park and their implementation through time). The
national legal limit for nets of the line of ¼ nautical miles offshore is also shown... 65 Figure 3A.7 - Maps obtained from the hotspot analyses of jig vessels for each period. The location of significant clusters (GIZScore > 1.96) by period (a – Before, b – Year 1, c – Year 2, d – Year 3, e – After), and the different protection levels at the Arrábida Marine Park are shown: BA – buffer area; PPA – partial protection area; FPA – fully protected area (see Methods for a detailed description of the protection levels in the park and their implementation through time). The 200 m offshore line is also shown... 66 Figure 3A.S1 - Proportion contribution of vessels using traps (T) to each of the significant clusters obtained in the hotspot analysis of trap buoys by period: Before, Year 1, Year 2, Year 3, After. See the location of each cluster in Fig. 3A.5. The number of vessels observed in each cluster is also
shown... 81 Figure 3A.S2 - Proportion contribution of vessels using nets (N) to each of the significant clusters obtained in the hotspot analysis of nets buoys by period: Before, Year 1, Year 2, Year 3, After. See the location of each cluster in Fig. 3A.6. The number of vessels observed in each cluster is also
shown... ... 82 Figure 3A.S3 - Proportion contribution in of jig vessels (J) to each of the significant clusters
obtained in the hotspot analysis of jig vessels by period (jigs were only correctly identified in Year 3 and After periods). See the location of each cluster in Fig. 3A.7. The number of vessels observed in each cluster is also shown... ... 83 Figure 3B.1 - Map of the location of the Arrábida Marine Park (Portugal). The zoning of the
different protection levels (fully protected area – FPA; partially protected areas – PPA; buffer areas – BA) implemented in the management plan (2005) is shown. Sampling stations (A-J), depth
contours and park sectors from the observation network along the marine park are also shown... 88 Figure 3B.2 - Average and respective error of the total fishing effort density of nets (FED = nº of nets x nº of vessels using nets x km-2) by season and sector and maps obtained from the hotspot analysis, showing the location of significant clusters (GIZScore > 1.96 or > 1.65 for p < 0.05 and p < 0.1, respectively) by season: spring; summer; autumn... 99 Figure 3B.3 - Average and respective error of the total fishing effort density of traps (FED = nº of traps x nº of vessels using traps x km-2) by season and sector and maps obtained from the hotspot analysis, showing the location of significant clusters (GIZScore > 1.96 or > 1.65 for p < 0.05 and p < 0.1, respectively) by season: spring; summer... 100
Figure 3B.4 - Average and respective error of the total fishing effort density of jigs (FED = nº of jigs x nº of vessels using jigs x km-2) by season and sector and maps obtained from the hotspot analysis, showing the location of significant clusters (GIZScore > 1.96 or > 1.65 for p < 0.05 and p < 0.1, respectively) by season: spring; summer; autumn... 101 Figure 3B.5 - Average and respective error of the total fishing effort density of longlines (FED = nº of hooks x nº of vessels using longlines x km-2) by season and sector at the Arrábida Marine Park... 102 Figure 3B.S1– Schematic representation of the topographic measurements applied in the
shore-based surveying method... 111 Figure 4A.1 - Location of the study area (Arrábida Marine Park, Portugal). Mean winter
(December to April; left panel) and summer (June to September; right panel) sea surface
temperature (SST, ºC) for the period 1992-2012 is shown... 117 Figure 4A.2 - Best descriptive multivariate regression tree of a 12-year dataset on presence/absence of rocky reef fish from the Arrábida Marine Park. Most important predictor variable was mean winter northward component (V) of wind stress (WINDstV2). Minimum winter significant wave height (SWH1) and mean winter sea surface height (SSH2) were also selected predictors. The tree explained 44.3% of the total species variance. Indicator species for clusters are listed with affinities in parentheses and variance explained (* refers to node discriminant species)... 123 Figure 4A.3 - Trends of high resolution (9 km) mean winter a) northward component (V) of wind
stress (WINDstV2) and b) SST (SST2) for the period 1993-2011; c) the correspondent semblance analysis (temporal wavelet relation) between these two predictors, and d) the tropicalization index (t. i.) for the observed (black crosses) and modelled communities (grey filled circles; connected by the dashed line) obtained from the averaged tropicalization results of the two predictive models
(headed by WINDstV2 and SST2)... 125 Figure 4A.4 - Trends of a) 1-degree resolution mean winter SST (SST2), b) large-scale North
Atlantic Oscillation (NAO) for the period 1960-2012, c) the correspondent semblance analysis (temporal wavelet relation) between these two predictors, and d) the tropicalization index (t. i.) for the observed (black crosses) and modelled communities (grey filled circles; connected by the
dashed line) obtained from the predictive model using long-term SST2 as explanatory variable... 127 Figure 4A.S1 - Semblance analysis (temporal wavelet relation) between high-resolution (9 km) a) mean winter northward component (V) of wind stress (WINDstV2) or b) mean winter sea surface
temperature (SST2) and North Atlantic Oscillation (NAO) for the period 1993-2011... 143 Figure 4A.S2 - Tropicalization index (t. i.) for the observed (black crosses) and modelled
communities (grey filled circles; connected by the dashed line) obtained from the a) main predictive model headed by the driver mean winter northward component (V) of wind stress (WINDstV2) and b) alternative model headed by the driver mean winter sea surface temperature
(SST2)... ... 143 Figure 4B.1 - Acanthurus monroviae (Monrovia doctorfish) observed on 30 December 2007 at the Arrábida Marine Park, Portugal (12 m depth). Photography credits: (A) – Carlos Monteiro and (B,
C) – Cláudio Dias………. 147
Figure 4B.2 - Long-term average SST (ºC) in the Iberian Peninsula. Mean 5-day composite
Pathfinder AVHRR SST, 1985-2009 (4 km). The location of the Arrábida Marine Park is shown... 148 Figure 4B.3 - Average seasonal OI (optimum interpolation) SST by year (1992-2012) from the
Figure 4B.4 - Average seasonal NAO Index by year (1992-2012), with the years 2006/2007
highlighted (source: NOAA)... ... 148 Figure 5.1 - Density of trap buoys by protection area and combining all sampled zones at the
Arrábida Marine Park througouth the different periods of the implementation of the management
plan: Before, Year 1, Year 2, Year 3 and After (see Chapter 3A for details)... 161 Figure 5.2 - Landings per unit effort (LPUE) of Octopus vulgaris and Diplodus sargus througouth the different periods of the implementation of the management plan: Before, Year 1, Year 2, Year 3 and After. Unit effort refers to the number of days fishing and the number of buoys (traps and nets for O. vulgaris and D. sargus, respectively) detected in each fisheries surveying (see Chapter
3A for details)... 161 Figure 5.3 - Total fisheries landings of Octopus vulgaris and Diplodus sargus througouth the
different periods of the implementation of the management plan: : Before, Year 1, Year 2, Year 3 and After (source: General Directorate of Fisheries and Aquaculture; see Chapter 2 and 3A for details). Landings are in kg/number of months included. Landings of D. sargus are in the left
y-axis whereas landings of O. vulgaris are in the right y-y-axis... 162 Figure 5.4 - Density of nets buoys by protection area and combining all sampled zones at the
Arrábida Marine Park througouth the different periods of the implementation of the management
List of Tables
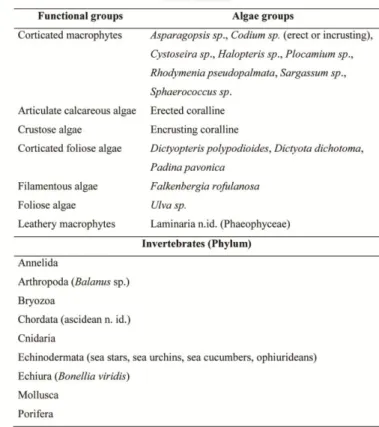
Table 2.1 - Physical habitat categories of the surveyed sites in Arrábida Marine Park, Portugal... ... 24 Table 2.2 - Biotic habitat (algae and invertebrates): algae functional groups and corresponding algae groups (algae species, genus or type); invertebrate groups (aggregated by Phylum) surveyed in the Arrábida Marine Park, Portugal... 25 Table 2.3 - GLM results of reserve and habitat complexity indices effects (roughness and boulders diversity) on biomass (g.m-2) and density (n.m-2) of the four different species groups: NTCF: Non-target cryptobenthic fish; NTDF: Non-Non-target demersal fish; TDF: Target demersal fish; TI: Target invertebrates; LS: legal size; BLS: below legal size. Significant post-hoc comparisons of factor reserve are indicated (highest values): (+) indicates significant reserve effects; significant p-values are shown in bold... ... 30 Table 2.4 - BEST (Bio-Env) results of correlation between habitat features (multivariate data) with a dummy-coded variable to protection and the biomass of the four species groups. NTCF: Non-target cryptobenthic fish; NTDF: Non-Non-target demersal fish; TDF: Target demersal fish; TI: Target invertebrates; LS: legal size; BLS: below legal size. For physical and biotic habitats see Tables 2.1 and 2.2, respectively. Spearman correlation coefficient (Rho) is included; significant p-values are shown in bold... ... 31 Table 2.5 - Mean annual landings (kg) and price.kg-1 (euros) of the most important commercial species from vessels with a license to operate in the marine park in 2010. Means were calculated from 1995 to 2009. D. sargus price was obtained from Diplodus spp. and S. salpa price was obtained from Sparidae n. id. category. No price information was available for Mugilidae n. id. or Labridae n. id. (Source: General Directorate of Fisheries and Aquaculture, DGPA)... 34 Table 2S.1 - Mean ± SE biomass and density (and respective minimum and maximum values), frequency of occurrence, number of species and families between inside vs. outside the reserve for each species group analysed: NTCF: Non-target cryptobenthic fish; NTDF: non-target demersal fish; TDF: target demersal fish; TI: target invertebrates; LS: legal size; BLS: below legal size... 44 Table 3A.S1 - Results of the smoothing terms from the generalized additive models (GAM) testing the density of trap buoys relative to the distance to several spatial features in the Before, implementation (Years 1, 2 and 3) and After periods... . 78 Table 3A.S2 - Results of the smoothing terms from the generalized additive models (GAM) testing the density of nets buoys relative to the distance to several spatial features in the Before, implementation (Years 1, 2 and 3) and After periods... 79 Table 3A.S3 - Results of the smoothing terms from the generalized additive models (GAM) testing the density of jig vessels relative to the distance to several spatial features in the Before, implementation (Years 1, 2 and 3) and After periods... . 80 Table 3B.1 - Zero-altered negative binomial model (ZANB) results of the effects of the distance to Sesimbra port (square rooted) and distance to coast in the distribution and abundance of vessels fishing with nets, traps and jigs. Significant values are in bold; n.s.: non-significant; marginally non-significant values 0.05 ≤ p ≤ 0.07 are also indicated... 95
Table 3B.2 - Zero-altered negative binomial model (ZANB) results of the effects of the distance to Setúbal port, distance to coast and depth in the distribution and abundance of vessels fishing with nets (in this case mainly small trammel nets used as drift nets). The variable Distance to Setúbal port was not possible to model in the count component (NA). Significant values are in bold; n.s.: non-significant... ... 96 Table 3B.3 - Mean core areas (km2) ± standard deviation (sd) by vessel and by gear of the most frequent vessels fishing with nets and traps within the marine park. The number of samples (N) used to compute this analysis is also shown for each vessel... 96 Table 3B.4 - Mean vessels distribution range (km2) and IOR95 ± standard deviation (sd) by vessel
and by gear of the most frequent vessels fishing with nets and traps within the marine park. The number of samples (distribution range) and pairs of samples (IOR95) used to compute this analysis
(N) are also shown for each vessel... ... 97 Table 3B.5 - Mean percentage (%) of the total pairs of samples where some degree of vessels distribution range overlap occurred for each vessel and gear. The number of samples where the vessel was detected (N), the total number of possible pairs of different samples (POS) where the vessel was observed and the number of POS in which overlap occurred within vessels distribution ranges (2 SDE) are also shown for the most frequent vessels fishing with nets and traps within the marine park... .... 98 Table 4A.S1 - Rocky reef fish species and corresponding Families observed in the underwater surveys and included in the multivariate regression models. The biogeographic group affinity is indicated: CT – Cold-temperate; T – Temperate; WT – Warm-temperate; Tr – Tropical; E – Eurythermic... 138 Table 4A.S2 - Environmental predictors used for modelling purposes. Predictors name (SST - Sea Surface Temperature; WINDstV - Daily Wind Stress - northward component (V); WINDstU - Daily Wind Stress - eastward component (U); SSH - Sea Surface Height; SWH - Significant Wave Height; Chla - Chlorophyll a; NAO - North Atlantic Oscillation), data source, temporal range, original resolution, predictor type (RS: Remote sensing; DO: Direct observation), units and derived metric (Winter - DJFMA ; Summer - JJAS). Seasonal NAO dummy variables were also tested: 1 when NAO was positive and 0 when it was negative... 141 Table 4A.S3 - Species variance for the best multivariate regression tree of the presence/absence data of rocky reef fish assemblage of the Arrábida Marine Park. The total species variance is partitioned by species, the whole tree, and the three splits of the tree. Selected predictors of the three principal splits obtained by the best model selected were the mean winter northward component (V) of wind stress (WINDstV2) and sea surface height (SSH2) and minimum winter significant wave height (SWH1)... ... 142
CHAPTER 1: GENERAL INTRODUCTION
1.1 The role of marine conservation
Over the past decades, densely populated coastal areas have been strongly affected by high anthropogenic pressures, compromising their ability to maintain ocean health and to provide goods and services. With marine biodiversity and marine ecosystem functions increasingly being lost due to human-induced impacts, the ecological role of no-take areas in mitigating or reducing such impacts is widely recognized (Lotze et al., 2006; Worm et al., 2006; Mora, 2008). These fully protected areas, also called marine reserves, are a special class of Marine Protected Areas (MPAs), where extractive or destructive activities are forbidden (Lubchenco
et al., 2003). Therefore, marine reserves are increasingly proposed as a tool for
ecosystem-based management, since they provide a spatial refuge for all species and habitats inside their borders and have the potential to promote socio-economic benefits in surrounding areas (Halpern et al., 2010; Fraschetti et al., 2011a; Fraschetti et al., 2011b). However, social acceptance of no-take zones is usually difficult to accomplish and therefore multiple-use MPAs are being increasingly preferred as they encompass a variety of protection measures (including no-take areas) and uses, increasing stakeholders‟ acceptance and socio-economic benefits while still addressing, depending on a number of factors (e.g. size, enforcement, location, types of impacts and uses), the recovery of exploited populations, habitats and ecosystems (Claudet et al., 2006b; Parsons and Thur, 2007).
Challenges concerning the conservation of marine systems go, however, beyond MPAs. Terrestrial pollution from domestic, industry and agriculture sewages, untreated waste, leakage of oils from marine platforms or tank vessels, dams, destructive fisheries, invasive species, climate change, among others human-induced impacts may severely affect marine systems. Therefore, marine conservation should be integrated in a broader management strategy, in which MPAs have an important role, but that also includes an efficient management of marine and terrestrial activities, a shift towards green energy and into a more local and less consumer society.
While MPAs alone cannot address widespread impacts such as pollution, climate change or overfishing (Halpern et al., 2010), they may contribute to local and regional marine conservation and management and potentially increase ecosystem resilience in the face of
global changes, especially if a network of connected MPAs exists (Munday et al., 2008; McLeod et al., 2009).
1.2 The science of marine protected areas
The science of marine reserves (no-take zones) has developed rapidly over the last three decades, with a vast amount of literature showing significant benefits of protection measures (Russ, 2002; Gell and Roberts, 2003; Micheli et al., 2004; Claudet et al., 2008; Lester et al., 2009). The expected effects from the exclusion or reduction of extractive activities within MPAs – the so-called “reserve effect” – are an increase in biodiversity, abundance, size and biomass of marine species, especially those that are highly commercial and fished (Mosquera
et al., 2000; Russ, 2002; Tetreault and Ambrose, 2007; Lester et al., 2009). Since protection
measures attempt to recover resources by allowing a sufficient fraction of the population to grow, reach maturity and reproduce, the fecundity and subsequent total production are also likely to increase exponentially (Tetreault and Ambrose, 2007; Fraschetti et al., 2011a). Sedentary species are expected to show larger responses to protection, since even small reserves may include most of their home ranges (Kramer and Chapman, 1999), but demersal mobile species forming „facultative schools‟ also demonstrate positive responses to protection (Claudet et al., 2010).
Depending on a number of factors such as mobility and other fish traits (Botsford et al., 2003; Claudet et al., 2010), density-dependent mechanisms and carrying capacity of protected and adjacent areas (Abesamis and Russ, 2005), as well as connectivity of suitable habitats (Forcada et al., 2008; Vega Fernández et al., 2008), the “reserve effect” may also include biomass export of post-settlers to the surroundings (spillover) (Kramer and Chapman, 1999; Roberts et al., 2001; Russ, 2002), which may create fishing opportunities in adjacent areas. The magnitude and extent of spillover depends on the presence of contiguous suitable habitats further away from the reserve and on the mobility and site fidelity of species (Lowe et al., 2003; Forcada et al., 2009). Despite this, some authors have also suggested that fisheries are more likely to benefit through larval export from reserves to surrounding areas due to an increase in size and fecundity of adults inside the reserve (Russ, 2002; Tetreault and Ambrose, 2007), although these benefits have been much more difficult to detect (Goñi et al., 2010; Pelc et al., 2010).
Indirect effects may also occur and affect nearby areas after some time due to the build-up of top-predators and subsequent trophic cascades inside no-take areas (Micheli et al., 2004; Guidetti and Sala, 2007). In fact, some studies showed considerably different compositions of reef assemblages among protected and fished areas due to distinct predator-prey abundances (Micheli et al., 2005; Guidetti, 2006; Ling et al., 2009).
The exclusion of destructive fishing gears, such as trawls, or physical damage (such as anchoring) can also lead to habitat recovery since those activities have the potential to cause severe habitat degradation. Therefore, the taxonomic and functional diversity of habitat-forming species and of higher levels of the food web may improve with protection measures. This way, the recovery of impacted populations and the subsequent shifts in marine communities contribute to an increased ecological resilience (Ling et al., 2009).
These conservation and fisheries benefits vary in magnitude depending on the design and age of the reserve but also on species and habitat characteristics within and surrounding no-take areas. Although in the meta-analysis of Guidetti and Sala (2007), reserve age was not related to species‟ responses (only to functional groups), more recent studies found significant differences with areas protected for more than 3 years responding more strongly than younger ones (Halpern and Warner, 2002; Claudet et al., 2006a; Claudet et al., 2008). This is not unexpected given that the recovery of exploited populations takes time and depends on particular environmental and ecological conditions. In fact, size and biomass of individuals probably respond faster than density which, in some cases is dependent on increases in size, fecundity, production and recruitment (White and Caselle, 2008; Borges et al., 2009; Taylor and McIlwain, 2010). Enhanced recruitment is, in turn, also dependent on interannual oceanographic and climatic fluctuations (Perry et al., 2005; Munday et al., 2008). Moreover, the recruitment success is influenced by density-dependent processes which may vary within and across species (Hixon and Webster, 2002; Goodwin et al., 2006).
Although reserve size could be expected to influence the magnitude of effects and the range of species showing positive benefits, some empirical studies did not find a size effect
relatively small size of the reserves, to the more sedentary target species studied (Lester et al., 2009), or even to the wide variety of MPAs across different ecosystems. However, a more recent review, studying European MPAs concluded that protection performance is size-dependent (Claudet et al., 2008). Very small reserves may fail to encompass all essential habitats and species‟ home ranges, leading to only a partial protection of the daily or seasonal range of most targeted species (Kramer and Chapman, 1999). Despite this, even small reserves can cause large increases in individual size, especially for less mobile commercial species (Claudet et al., 2008; Lester et al., 2009). The optimal size depends on the reserve goals and species considered. For example, in some modelling studies, reserves that were larger than a particular size did not add any subsequent increase in fisheries yield, but conservation goals were better achieved by the largest area. In fact, there has been a large debate about whether to establish several small reserves or single large ones (Single Large or Several Small: SLOSS) leading to a number of theoretical studies about this topic (Gerber et
al., 2003; Hastings and Botsford, 2003). Empirical evidence about what is the best design is
challenging to gather in marine systems but by evaluating tradeoffs among multiple goals in modelling frameworks, optimization may be possible.
Until recently, different responses were hypothesized to occur between tropical and temperate MPAs. Due to the generally greater mobility patterns and to theoretically longer larval durations of temperate species, and thus higher rates of adult movement and larvae dispersal, temperate MPAs were suggested to have less reserve benefits for exploited species than tropical ones or would have to be much larger (Shipp, 2003; Floeter et al., 2004; Kaiser, 2004; Blyth-Skyrme et al., 2006; Laurel and Bradbury, 2006; O'Connor et al., 2007; but see Leis et al., 2013 for tests of some of these assumptions). However, a recent study analyzing several MPAs around the globe found similar if not greater reserve effects in temperate systems, at least for reefs (Lester et al., 2009).
Despite growing evidence of the ecological benefits of no-take areas around the globe, other types of MPAs may not provide similar responses. Some authors found that partially protected areas (PPAs) do not have positive effects, since they do not decrease mortality by fishing and may attract users, especially displaced fishers, to the surroundings of closed areas due to the expected benefits they may supply (Shears et al., 2006; Stelzenmüller et al., 2007; Claudet et al., 2008; Lester and Halpern, 2008). In fact, even a moderate fishing effort may
reduce a significant proportion of larger individuals (Di Franco et al., 2009). Despite the greater benefits of no-take areas, PPAs may still show some positive effects when compared to openly fished areas, for some heavily fished species (Floeter et al., 2006; Sciberras et al., 2013). Moreover, no-take areas may generate stronger antagonism from local users, whereas PPAs may lead to a higher socio-economic acceptance, while also reducing economic costs associated with full protection (Lester and Halpern, 2008; Sciberras et al., 2013). However, more research is needed to distinguish among the effects of the huge variability in design and allowed uses of PPAs in order to understand which aspects affect positively both the ecological and socio-economic responses.
An important factor influencing the effectiveness of MPAs is related to the attraction of fishers to the reserve border. Some studies showed that expectations of benefits or perceived spillover lead to an increase of fishing effort adjacent to no-take borders („fishing the line‟, Kellner et al., 2007). Moreover, even if perceived benefits are not the reason, displaced fishers may prefer to operate as close as possible to former fishing grounds, resulting in increased fishing effort in the reserves surroundings (Lédée et al., 2012). In both situations, spillover may then be compromised by higher densities of fishing effort in particular areas, with its magnitude and extent depending on gear selectivity and the target species ability to avoid such gears. If gears are very selective and their density is too high in the surroundings of reserves, repercussions on target species may extend inside the no-take areas, compromising their conservation goals (Goñi et al., 2008). Spillover is usually interpreted from a gradient of abundance or biomass from the centre of a no-take zone to further away outside its borders (Francini-Filho and Moura, 2008; Goñi et al., 2010). Since such gradient can be an artifact of a large increase of fishing effort in the surroundings of the reserve, spillover should only be assumed if there is evidence of a biomass build up inside the reserve after protection (Wilcox and Pomeroy, 2003; Goñi et al., 2010), and net movements of species across the boundaries of reserves (Abesamis and Russ, 2005; Amargós et al., 2010).
In addition, the appearance of a reserve effect may also be detected if reserves are placed in better habitats or areas with higher diversity or species abundances. Indeed, many reserves were chosen to protect such areas from human activities without assessing the extent of pre-existing differences between reserves and open areas (Roberts, 2000). Although a recent
better habitats (Lester et al., 2009), data from inside and outside reserves before and after they were established are crucial to accurately evaluate protection benefits.
Besides the importance of ecological baseline information to distinguish natural habitat variability between no-take and fished areas (Claudet et al., 2006a; Lester et al., 2009; Huntington et al., 2010), socio-economic data also have an important role in assessing the effectiveness of protection at different levels (Leleu et al., 2012). Moreover, data about the distribution of fishing effort before protection is also essential to detect patterns of change within and surrounding MPAs in relation to the reserve effect (Abbott and Hayne, 2012; Campbell et al., 2012).
To better understand the spatial allocation of fishing effort within and around MPAs, studies have assessed the importance of the proximity of fishing activity to MPA borders, water depth, home port or specific habitats (Goñi et al., 2008; Stelzenmüller et al., 2008; Forcada et
al., 2010) and they found that the distance to home port and to no-take borders were important
for most fisheries. However most of these studies did not include data before protection and therefore it is difficult to have clear understanding of fishers‟ adaptations when displacement occurs. Only a few and recent empirical studies have analysed fishing effort distribution before and after protection (Murawski et al., 2005; Abbott and Hayne, 2012; Campbell et al., 2012; Lédée et al., 2012), while to the best of our knowledge only one related fisheries displacement to ecological responses of fishing closures (Campbell et al., 2012).
Environmental fluctuations can also influence the response of marine species to protected areas. In fact, regardless of the role of habitat complexity and diversity in shaping species assemblages, oceanographic or climatic variables drive the temporal variability of community structure since the presence and density of species can be strongly related to specific environmental conditions (Pörtner and Peck, 2010; Heath et al., 2012). For example, in the face of steady global warming where more frequent extreme events may occur, species are predicted to move their ranges polewards, affecting existing marine assemblages and trophic interactions (Cheung et al., 2009; Hawkins et al., 2009; Figueira and Booth, 2010; Cheung et
al., 2012; Cheung et al., 2013; Wernberg et al., 2013). Additive or synergistic effects possibly
non-linear and unpredictable responses of species and ecosystems (Munday et al., 2008; Griffith et al., 2011). In this context, MPAs may contribute to increasing resilience of marine communities, buffering against some of these unpredicted effects (Ling et al., 2009). The potential role of MPAs in mitigating the effect of ocean warming can be enhanced by a network of connected MPAs. Target species changing their distribution limits may achieve protection in connected MPAs (Munday et al., 2008; McLeod et al., 2009), through larval dispersal and/or adult migration if habitats are connected (Gruss et al., 2011).
1.3 The model system
The Arrábida Marine Park (Portugal) also called the Luiz Saldanha Marine Park is an ideal model system to investigate many of the above mentioned topics since different initiatives over time allowed gathering ecological and fishing data before and after the implementation of the MPA management plan in 2005. This marine park is a multiple use-MPA located near important cities such as Lisbon and Setúbal, and has a small touristic fishing town, Sesimbra, at its centre. In this region human uses occur year round as the orientation of the majority of the park is towards the south and the adjacent high cliffs protect its waters from the prevailing north and north-west winds and waves. The main users are local commercial fishers, recreational fishers, divers and tourists taking advantage of scenic views, beaches and maritime recreational activities.
The park is located in an important biogeographic transition area along the Portuguese continental coast, resulting in exceptional levels of biodiversity. The park encompasses the northern and southern limits of warm and cold species, respectively, and also contains highly complex shallow rocky reefs and variety of other habitat types. The marine park was created to accomplish conservation goals as well as to guarantee fisheries benefits for small-scale local artisanal fishers.
The Arrábida Marine Park is adjacent to a terrestrial park (established in 1978), but only in 1998 was the marine portion designated a protected area. However, it remained without a management plan until 2005 when zoning and management measures were finally approved (Figure 1.1).
Figure 1.2 - Arrábida Marine Park zoning map. FPA: fully protected area; PPA 1 to 4: partially protected areas; BA 1 to 3: buffer areas.
Zoning (Figure 1.1) includes a fully-protected area (FPA) (4 km2 in area); four partially-protected areas (PPA) (totalling 21 km2); and two buffer areas (BA) (totalling 28 km2). The FPA is a no-take, no-go area (with the exception of research, monitoring and education purposes). The PPAs (except PPA1 where no extractive uses are permitted) allow local commercial fishing with traps and lines but only beyond 200 m from shore and no extractive recreational activities (e.g. angling, spearfishing) are permitted. In the BAs, fishing vessels less than 7 m in length and recreational fishing activities are allowed. Commercial diving for bivalves or other marine organisms, spearfishing, trawling and purse seine nets are forbidden in the entire park. Only commercial fishers from Sesimbra are allowed to operate within the park .These licensed fishers have to report a minimum 100 sales per year to retain the license.
Since this is a region with historical artisanal fishing activity, a transition phase was included in the management plan for fisheries, in which the different zones were gradually implemented during the first four years. In 2006, management measures were enforced in the BAs, the east half of the current FPA began as a PPA and the Portinho PPA (PPA1) was implemented. In 2007, the remaining PPAs were implemented and the west half of the FPA started as a PPA. In 2008, the east half of the (current) FPA changed from PPA to FPA. The west half of the FPA was enforced in the summer of 2009, which ended the transition period.
The licensed fishing gears allowed to operate within the park are nets (trammel and gill nets) catching mainly soles, skates, demersal fish and cuttlefish; octopus traps that also capture some crustaceans during some months, longlines for fish and jigs for cuttlefish and squid. These gears are operated from small vessels, especially jigs and rod and reel angling, which are the main recreational fishing gears.
1.4 Dissertation goals
There are three overarching goals to this dissertation. The first one is the investigation of the ecological effects of protection measures on the rocky reef fish and invertebrate assemblages (Chapter 2). Before and after data as well as no-take and fished areas were compared in terms of fish and invertebrates density, size and biomass while accounting for differences in physical and biotic habitat among areas. Trends in landings of the most important commercial species (i.e. those most likely to contribute to a reserve effect) were also assessed from before and after protection using data from commercial fishers allowed to operate within the park.
The second objective is to understand and describe fishers‟ preferences and fisheries displacement dynamics after the implementation of the management plan (Chapter 3). The comparison of the adaptations of licensed fishers in the selection of fishing zones before, during (transition phase) and after the implementation of protection measures allowed an assessment of fishers‟ behaviour, preferences and constraints while choosing available fishing grounds (Chapter 3A). This is one of the first empirical studies evaluating, through direct observations, spatial patterns of artisanal fisheries before, during and after the establishment of protection measures within a temperate MPA. Moreover, the location, home range and site fidelity of the most important gears and of individual fishers before zoning was implemented could help to detect the factors influencing their previous distribution (Chapter 3B).
The third goal of this study was to evaluate the most important oceanographic variables affecting interannual fluctuations of the rocky reef fish communities and to try to understand and predict the effect of ocean warming on the structure of such assemblages in this marine park (Chapter 4). Fish community structure from the past 12 years was related to oceanographic variables at local and regional scales and predictive modelling for the past 50
climate change (Chapter 4A). Furthermore, the detection of the first occurrence of a vagrant tropical species in this temperate MPA located in at a biogeographic transition zone was also described. This record could also contribute to the evidence of the role of such areas as important climatic „barometers‟ (Chapter 4B).
At the end of this dissertation, the main findings from each chapter were integrated and discussed considering the current state of knowledge (Chapter 5). To better understand the ecological responses of the most targeted species with apparent reserve effect, we combined the fishing trends with the information gathered about the redistribution of fishing effort density. The future challenges to both rocky fish assemblages and artisanal fisheries on them, were discussed in relation to scenarios of ocean warming in temperate biogeographic transition zones and in the context of connected areas and the existence of a network of MPAs.
1.5 List of manuscripts
Chapter List of manuscripts
Chapter 2 Horta e Costa, B., Erzini, K., Caselle, J.E., Folhas, H.,
Gonçalves, E.J. 2013. The reserve effect within a temperate marine protected area in the north-eastern Atlantic (the Arrábida Marine Park, Portugal). Marine Ecology Progress Series, 481: 11-24.
Chapter 3A Horta e Costa, B., Batista, M. I., Gonçalves, L., Erzini, K., Caselle, J. E., Cabral, H. N. & Gonçalves, E. J. 2013a. Fishers‟ Behaviour in Response to the Implementation of a Marine Protected Area. PLoS One, 8: e65057.
Chapter 3B Horta e Costa, B., Gonçalves, L. & Gonçalves, E. J. submitted. Vessels‟ site fidelity and spatio-temporal distribution of artisanal fisheries before the implementation of a temperate multiple-use marine protected area, submitted to Fisheries Research.
Chapter 4A Horta e Costa, B., Assis, J., Franco, G., Caselle, J. E., Erzini, K., Henriques, M. & Gonçalves, E. J. submitted. Tropicalization of fish assemblages at temperate biogeographic transition zones.
submitted to MEPS.
Chapter 4B Horta e Costa, B. & Gonçalves, E. J. 2013. First occurrence of the Monrovia doctorfish Acanthurus monroviae (Perciformes: Acanthuridae) in European Atlantic waters. Marine Biodiversity