UNIVERSIDADE DA BEIRA INTERIOR
Ciências
Biosynthesis of therapeutic DNA plasmid using
agri-food subproducts media
Mafalda do Espírito Santo Silva Matos
Dissertação para obtenção do Grau de Mestre em
Biotecnologia
(2º ciclo de estudos)
Orientador: Prof. Doutor Luís António Paulino Passarinha
Co-orientador: Prof. Doutor João António de Sampaio Rodrigues Queiroz
iii
Acknowledgments
I would like to thank to my supervisors, Professor Doctor Luís Passarinha and Professor Doctor João Queiroz, for all the guidance and support during the last year. I’m really thankful for all criticism, wisdom and confidence along my research work.
I would also like to thank very much to Professor Guilhermo Gosset (Universidad Nacional Autónoma de México) and Professor José Teixeira (Universidade do Minho), for providing indispensable resources that have allowed the development and execution of all this project. A very special thanks to Luís Martins and Guilherme Espírito Santo for all the help, support and knowledge. They taught me all I know about laboratory procedures and techniques. Thank you both, very much.
To all my friends and colleagues in the Health Sciences Research Center, I’m very appreciate for everything you’ve done, especially the coffee times and the availability of helping me. You’ve made the work so much pleasant.
Not forgetting, to my family and friends, thank you for smiling despite of my occasionally bad temper. For my family, in special my grandparents and my mother, thanks the cuddles and all the strength in the crucial moments. Love you all. To “TOP”, you know you’re the best friends I’ll ever have. Regardless of all, you were always present, being a part of my work. More than faculty friends, Friends for a life.
Last but not least, to Diogo Figueiredo. Thanks for believe in me, encourage me and being always next to me. You really made everything so much easier. Thanks for all the understanding, patience and all that tiny -but very special- moments after the lab and the work. You’re the best. Love you.
v
Resumo
O aumento da relevância da aplicabilidade biomédica do DNA plasmídico (pDNA) para induzir efeitos terapêuticos tem tido um grande impacto na indústria e pesquisa biofarmacêutica. A terapia génica e as vacinas de DNA são uma nova abordagem no tratamento de doenças genéticas, como o cancro. Estas novas terapêuticas têm por base a entrega de fármacos baseados em ácidos nucleicos, que atuam ao nível das células alvo, corrigindo ou destruindo as células afetadas. A Escherichia coli (E. coli) é o sistema hospedeiro mais utilizado na produção de pDNA, dado o seu elevado crescimento em meios mínimos e a sua fácil manipulação genética. No presente trabalho é utilizada a E. coli VH35, uma variante com modificações genéticas que minimizam a acumulação de acetato. Diversos estudos têm sido efetuados nas diferentes etapas de produção e purificação de DNA plasmídico em E. coli, com a finalidade de aumentar o rendimento e produtividade final desta biomolécula. No entanto, apesar de diversas otimizações alcançadas, os substratos comerciais utilizados como meios de cultura para produzir esta biomolécula, tendo em conta o rendimento final, tornam todo o processo de produção de pDNA bastante dispendioso. De modo a superar este problema, os substratos comerciais podem ser suplementados ou substituídos por excedentes industriais, obtendo-se uma produtividade de pDNA bastante semelhante comparativamente aos substratos comerciais, através de um processo muito mais económico. No presente trabalho é utilizado o CSL (“corn step liquor”) e o CWPS (“Cheese whey poder solution”) como substratos alternativos em meios de cultura para a produção de pDNA em E. coli.
Palavras-Chave
Terapia génica, DNA plasmídico, Escherichia coli VH35, “Corn Steep Liquor”, “Cheese whey powder solution”.
vii
Resumo Alargado
Ao longo das últimas décadas, o DNA plasmídico (pDNA) tem sido utilizado como uma ferramenta biológica na clonagem e expressão de proteínas recombinantes. Recentemente, tem aumentado a sua aplicabilidade como potencial biofármaco, em terapia génica e em vacinas de DNA. Estas novas abordagens terapêuticas têm por base o mesmo princípio, a introdução de ácidos nucleicos em recetores de células ou tecidos humanos de forma a restaurar, bloquear, modificar ou introduzir uma função bioquímica. A aplicação do pDNA como vetor surgiu pelas vantagens que apresenta comparativamente a um sistema viral, exibindo fraca resposta imunológica, pelo facto de ser um sistema mais seguro e fácil de manipular. Atualmente, os ensaios clínicos realizados no âmbito da terapia génica estão na sua maioria focados na área oncológica (64%), seguidos pelas doenças genéticas monogénicas (9.5%) e por fim a área cardiovascular (7.9%).
Sendo o cancro o maior alvo da terapia génica têm surgido novas abordagens de resposta terapêutica, que se baseiam no p53, um gene supressor de tumor com importante função na homeostasia celular. Este gene, em resposta ao stress celular, induz a apoptose das células ou bloqueia o seu ciclo, evitando, desta forma, a acumulação de células de DNA danificadas que podem levar ao aparecimento de células cancerígenas. A sua forma mutada conduz à perda da sua atividade e por isso é necessário que ocorra a sua reativação ou restauração.
Por forma a analisar e pesquisar todas as vantagens que o pDNA oferece é necessário desenvolver processos de produção com elevado rendimento. Por este motivo existe uma necessidade de aumentar a produtividade nas etapas de produção e também purificação. Na etapa de produção um dos passos cruciais para aumentar a produtividade é a escolha adequada do sistema vetor/hospedeiro que afeta diretamente a quantidade e qualidade da biomolécula a sintetizar.
A Escherichia coli (E.coli) é dos sistemas hospedeiros mais utilizados devido à sua robustez, capacidade de crescer em meios com mínimos requisitos nutricionais, e além disso, o seu genoma já se encontra totalmente sequenciado, o que permite a sua manipulação relativamente fácil. A manipulação genética deste hospedeiro permite a modificação dos seus ciclos metabólicos com o objetivo de alcançar uma estirpe com as características mais adequadas para a sua aplicação em terapia génica.
Para garantir o crescimento adequado do hospedeiro e a síntese adequada de pDNA, é necessário desenvolver um processo fermentativo adequado e que satisfaça todas as necessidades metabólicas. A escolha adequada do meio de fermentação terá repercussões diretas na quantidade e qualidade de plasmídeo biossintetisado, tendo também interferência com a etapa de purificação. Na formulação do meio de cultura, existem diversos fatores a ter
viii em consideração, como a fonte de carbono, a fonte de azoto, a presença de sais, a temperatura, pH e oxigénio dissolvido. As fontes de carbono e azoto mais utilizadas e descritas na literatura são a glucose ou glicerol e extrato de levedura ou peptona, respetivamente. Existem diversas soluções de sais descritas na literatura, contendo na sua composição magnésio, zinco, cobre, entre outros minerais essenciais. A temperatura ronda os 37ºC e o pH utilizado é de aproximadamente 7.
A produtividade de pDNA obtida está descrita na literatura na ordem das 5 a 40 mg/L. Tendo em conta a possível densidade populacional que poderá ser alvo deste tipo de tratamento, a produtividade obtida neste processo é ainda relativamente baixa. Além da otimização de toda a etapa de produção, uma diferente abordagem pode ser realizada, tornando todo o processo mais económico, aumentando a sua rentabilidade. Essa diferente abordagem passa pela substituição dos meios comerciais atualmente utilizados, que utilizam glucose, extrato de levedura, peptona, entre outros, como fontes de energia, aumentando todo o custo do processo, por substratos mais económicos.
A utilização de excedentes industriais como fontes de energia são uma boa alternativa aos substratos comerciais utilizados na produção de pDNA em E. coli. Neste trabalho o CWPS (cheese whey poder solution) e o CSL (corn step liquor) são os excedentes industriais utilizados como fonte de carbono e azoto, para a produção de pDNA em E. coli. A produtividade obtida é muito próxima da descrita na literatura, o que comprova a possibilidade da utilização destes excedentes industriais como fontes alternativas de energia, tornando a etapa de produção muito menos dispendiosa.
x
Abstract
Increased relevance of biomedical applications of plasmid DNA (pDNA) to induce therapeutic effects has having a great impact on industry and biopharmaceutical research. Gene therapy and DNA vaccines are a new approach for treating genetic diseases such as cancer. These new therapies are based on delivery systems of drugs based on nucleic acids that act at the level of the target cell, correcting or deleting the affected cells. Escherichia coli (E. coli) is the most used host system in the production of pDNA, due to their high growth in minimal media and its easy genetic manipulation. In this paper we used E. coli VH35, a variant with genetic modifications that minimize the accumulation of acetate. Several studies have been performed in different steps of production and purification of plasmid DNA into E. coli in order to increase the yield and productivity of this biomolecule. However, despite several optimization achieved, commercial substrates are used as culture media to produce this biomolecule, taking into account that the final yield of pDNA make the whole production process quite expensive. In order to overcome this problem, the commercial substrates may be supplemented or replaced by industrial wastes resulting in a pDNA yield very similar compared to commercial substrates, via a more economical process. In this paper we used the CSL ("corn step liquor") and the CWPS ("Cheese whey power solution") as alternative substrates in culture media for production of pDNA in E. coli.
Keywords
Gene therapy, plasmid DNA, Escherichia coli VH35, Corn Steep Liquor, Cheese whey powder solution.
xii
Index
Acknowledgments ... iii
Resumo……….v
Resumo Alargado ... vii
Abstract
………
xIndex of figures ... xv
Index of tables ... xviii
List of Acronyms ... xx
Justifications and Objectives ... xxiii
Chapter 1-Revision of Literature ... 1
1.1. Plasmid DNA and gene therapy ... 1
1.2. Plasmid DNA Production ... 3
1.3. Fermentative process for bacterial growth ... 10
1.4. Agri-food subproducts media ... 12
Chapter 2-Experimental Part ... 16
2.1. Materials and Reagents ... 16
2.2. Plasmid ... 16
2.3. Strain ... 17
2.4. Transformation of competent cells ... 17
2.5. Master and working cell bank ... 18
2.6. Pre-treatment of by-products ... 18
2.7. Cultivation Conditions for plasmid production... 19
2.8. Alkaline cell lysis ... 20
2.9. Plasmid DNA quantification ... 20
2.10. Plasmid DNA quality analysis ... 20
2.11. Metabolites Assessment ... 21
2.12. Plasmid copy number determination ... 21
Chapter 3-Results and Discussion ... 23
xiii
3.2. CWPS as alternative medium culture ... 29
3.3. CSL as alternative medium culture ... 31
3.4. Combination of CSL and CWPS as culture medium ... 33
3.5. Addition of yeast extract to the by-products ... 36
Chapter 4-Conclusions ... 40
Chapter 5-Future perspectives ... 42
xv
Index of figures
Figure 1 - Integrative approach for non-viral cancer gene therapy. (I.) Purification of plasmid DNA and recovery of the sc pDNA isoform using arginine affinity chromatography; (II.) Nanoparticle mediated delivery and transfection; (III.) Expression of the p53 tumour suppressor (adapted from [21]). ... 2 Figure 2 - Vector engineering strategies. The bacterial elements required for propagation of the plasmid in E. coli are the selectable marker and the plasmid origin of replication. The eukaryotic elements of the vector required for in vivo efficacy include the eukaryotic promoter, therapeutic or antigenic gene, and polyadenylation signal (polyA) (adapted from [23]). ... 5 Figure 3 – Central carbon metabolism pathway in E. coli. In the figure PTS (in blue), the non PTS glucose uptake system (in purple), PEP node (green) and AAA (yellow) enzymes are depicted. The allosteric effects that PEP has in EMP and acetate biosynthesis are in orange line for inhibition and blue arrow for activation (adapted from [39]). ... 8 Figure 4 – Full sequence map of pcDNA3–FLAG–p53 by addgene (www.addgene.org/10838, August 2015). ... 16 Figure 5 – Typical growth profile of E. coli VH35 with different concentrations of lactose. ... 23 Figure 6 – Sugars and acetate concentration in fermentations carried out at to 2,5 g/L of lactose. ... 25 Figure 7 – Sugars and acetate concentration in fermentations carried out at 5 g/L of lactose. ... 25 Figure 8 – Sugars and acetate concentration in fermentations carried out at 7.5 g/L of lactose. ... 26 Figure 9– Sugars and acetate concentration in fermentations carried out at 30 g/L of lactose. ... 26 Figure 10 – Plasmid copy number per cell in relation to 5, 7.5 and 30 g/L of lactose. ... 27 Figure 11 –Agarose Gel Electrophoresis. The lanes correspond to plasmid obtained at 5 and 7.5 g/L lactose at 11, 20 at 30 hours fermentation. Two last lanes correspond to 30 g/L lactose at 11 and 30 hours. ... 29 Figure 12 – Typical growth profile of E. coli with CWPS as substrate at 0.6, 1.2 and 5% (n=3). ... 30
xvi Figure 13– Sugars and acetate concentration in fermentations carried out at CWPS 1.2% (m/V) (n=3). ... 30 Figure 14 – Typical growth profile of E. coli with CSL as substrate with 5, 10 and 15% concentrations (n=3). ... 32 Figure 15 - Typical growth profile of E. coli with different combinations of CSL and CWPS as substrate (n=3). ... 33 Figure 16 – Sugars and acetate concentration in fermentations carried out at CSL 1% with CWPS 2.5% (n=3). ... 34 Figure 17 – Sugars and acetate concentration in fermentations carried out at CSL 2% with CWPS 1.2% (n=3). ... 34 Figure 18 – Sugars and acetate concentration in fermentations carried out at CSL 2.5% with CWPS 5% (n=3). ... 35 Figure 19 - E. coli growth curve using a medium with CSL 2%, CWPS 1.2% and 5 g/L YE. ... 37 Figure 20 –Agarose Gel Electrophoresis. The lanes 1 to 5 correspond, respectively to 5g/L lactose, CWPS 1.2%, CSL 5%, CSL 1% + CWPS 2.5%, CSL 2% + CWPS 1.2% + 5 g/L YE. ... 38
xviii
Index of tables
Table 1 - E. coli host strains commonly used in plasmid DNA biosynthesis (adapted from [30]). ... 6 Table 2– E. coli W3110 variants with different genetic modifications used in plasmid DNA biosynthesis (adapted from [39]). ... 9 Table 3– Composition of a typical salt solution apply in the fermentation medium (adapted from [37]). ... 12
Table 4 - Equation curves of lactose, glucose, galactose and acetate. ... 24
Table 5 – Effect of different lactose concentrations on plasmid DNA volumetric and specific yield and purity. ... 28
Table 6– Effect of different CWPS concentrations on plasmid DNA volumetric and specific yield
and purity. ... 31
Table 7 - Effect of different CSL concentrations on plasmid DNA volumetric and specific yield
and purity. ... 32 Table 8– Effect of different combinations of CSL and CWPS concentrations on plasmid DNA volumetric and specific yield and purity. ... 36
Table 9 – Effect of CSL and CWPS supplemented with 5 g/L of yeast extract on plasmid DNA
xx
List of Acronyms
AAA Aromatic Aminoacids ATP Adenosine Triphosphate BOD Biochemical Oxygen Demand
BP Pair bases
CCC Covalently Closed Circular CDM Cell Dry Mass
COQ Chemical Oxygen Demand
CW Cheese Whey
CWPS Cheese Whey Powder Solution DNA Deoxyribonucleic Acid
DO Dissolved Oxygen
E. coli Escherichia coli
EDTA Ethylene-diamine tetraacetic acid EMP Embden Meyerf Parnas pathway FDA Food and Drug Administration
G6P Glucose 6-phosphate
GalP Galactose Permease
gDNA Genomic Deoxyribonucleic Acid
HPLC High Performance Liquid Chromatography Hpr Histidine-containing Protein
Kb Kilo bases
xxi mRNA Messenger ribonucleic acid
OAA Oxaloacetate
OC Open Circular
OD Optical Density
ORI Bacterial Origin of Replication PCN Plasmid Copy Number
pDNA plasmid DNA
PEP Phosphoenolpyruvate
Poly A Polyadenylation sequence PPP Pentose Phosphate Pathway PTS Sugar Phosphotransferase System RID Refractive Index Detector
RNA Ribonucleic Acid
RT-PCR Real Time Polymerase Chain Reaction
SC Supercoiled
SDS Sodium Dodecylsulfate Solution TAE Tris–Acetate–EthyleneDiamine
TB Terrific Broth
TCA Tricarboxilic Acid Cycle TIR Translation Initiation Regions WHO World Health Organization
xxiii
Justifications and Objectives
The plasmid DNA biosynthesis has increased vastly in response to rapid advances in its application in gene therapy and DNA vaccines. The potential number of patients to combat diseases is very high, creating a large demand for pDNA. Further, DNA vaccines for veterinary application will increase this request.
In order to response that, high yield pDNA production processes are necessary to fully develop and exploit the advantages that both DNA vaccine and gene therapy treatment options have to offer. For these reasons, there is a continued need to increase the productivity of pDNA manufacturing and purification methodologies.
The production costs associated with developing biopharmaceuticals is an increasingly important consideration for companies that develop these products. As products approach commercialization and companies have to reconcile the high cost of production with relatively low repayment rates, this consideration receives even more attention. There are many aspects of production that can be evaluated and optimized.
For this reason there is a growing need to reduce the overall cost of pDNA production process. The use of by-products as a media for the biosynthesis of pDNA is an emerging and possible approach that will make the upstream process less expensive, with the same productivity and less costs. This will help a greater population range to have access to this new therapeutic approach in the near future.
1
Chapter 1- Revision of Literature
1.1. Plasmid DNA and gene therapy
1.1.1. Plasmid DNA definition
Plasmid are linear and circular polymers of deoxyribonucleotides linked by phosphodiester bonds/groups that are polyanionic above pH 4. Two anti-parallel DNA strands are wound and connected by hydrogen bonds between complementary nucleotides in each strand, along a common axis forming right-handed double helix structure with highly hydrophobic channels accessible to solvent and ligand molecules [1]. They are present in archaea, bacteria, and some yeasts with at least one origin of replication (ori), where the plasmid replication starts independently of the chromosomal DNA [2].
1.1.2. Gene therapy and vaccination
Plasmid DNA vectors could be applied as preventive or therapeutic DNA vaccines for several diseases or for other indications such as cancer, or gene therapy products. The production and application of plasmid DNA involve four typical phases. The first one, plasmid with interest gene is transformed into a bacterial cell and then its propagation in shake flasks or bioreactors [3]. Second, the produced cells are lysed and plasmid DNA is purified and formulated for gene delivery [4]. In third place, plasmid with interest gene is deliver to a eukaryotic cell [6]. Finally, in the last phase, the gene is expressed while the vector stimulates innate immune responses [8, 13].
Gene therapy is related with the introduction of genetic material into human cells or tissues, in order to treating a disease by modifying their genome [7]. There are two principal treatment approaches, the first one is related with the repair of damage cellular DNA by inserting and expressing appropriate DNA into the cells to achieve the pre-designed function. The second one, consists in silencing the defective gene and stop the expression of the pathogenic protein [9]. In order to ensure the success of gene delivery it’s necessary to provide a suitable vector that could be viral or non-viral. Although viral vectors are very efficient for gene delivery due to the presence of viral proteins that interact with cell surface receptors and also because can mimic real-life infection. The viral proteins induce specific immune responses that may restrict the ability to re-administer the vector, which can be a problem in translation of preclinical studies to human treatments [10, 11]. As an alternative, the plasmid vectors (non-viral) are
2 preferable and studies are focused in their improvement both on upstreaming as in downstreaming process [12]. Those vectors use naked DNA in gene delivery system, which when injected directly into certain tissues, produce significant levels of gene expression. Beyond these characteristics, non-viral vectors show weak immunogenicity, allowing a course of multiple treatments and are safer and easy to manufacture [12, 16]. Currently, the major clinical trials in gene therapy are related to cancer diseases (64%), monogenic diseases (9,5%) and cardiovascular diseases (7,9%). Only in the last year where approved about 130 gene therapy clinical trials. (http://www.abedia.com/wiley/indications.php, August 2015).
DNA vaccines are another approach of DNA based therapeutics. Contrasting with conventional protein or polysaccharide based vaccines, DNA vaccines contain plasmids encoding the vaccine antigen in addition with a strong eukaryotic promoter used to conduce protein expression [14]. Once injected into the cells of the body, the host cells convert DNA into pathogenic proteins. Since these proteins are recognized as foreign, when they are processed by the host cells and displayed on their surface, the immune system is alerted, activating an immune response. When the immune system has created its primary immune response to destroy the pathogen, it will acquire a memorized immunity for the disease. One of the major advantages associated with the use of plasmids is that DNA vaccination stimulates both the antibodies and cell-mediated components of the immune system, whereas conventional protein vaccines normally stimulate only the antibody response, offering the potential for immunotherapy of diseases like cancer [15, 17]. Another advantages related with the use of plasmids are their stability, easy and inexpensive manufacture along with an easier transport and store (longer shelf life) due to their stable temperature [18].
Figure 1 - Integrative approach for non-viral cancer gene therapy. (I.) Purification of plasmid DNA and recovery of the sc pDNA isoform using arginine affinity chromatography; (II.) Nanoparticle mediated delivery and transfection; (III.) Expression of the p53 tumour suppressor (adapted from [21]).
3
1.1.3. p53 gene in cancer
The p53 transcription factor is a tumour suppressor with an important role in cellular homeostasis. In response to cellular stress, his function is to induce apoptosis or block cell cycle progression, in order to avoid the accumulation of DNA damage cells which can lead to a cancer phenotype [19]. As one of the most studied tumour suppressor, is known that mutation of p53, leading to loss of wild-type activity, is frequently detected in different tumour types, being one of the most commonly mutated gene in human cancer [20]. As a transcription factor, p53 forms a complex gene regulatory network. The frequency of p53 mutation varies from approximately 10%, related with hematopoietic malignancies, to 50-70% related with ovarian, colorectal, head and neck malignancies [19]. Most of mutation in p53 occur in DNA binding domain, preventing transcription of its target genes. On the other hand, mutant p53 is not just related with a loss of normal function of the wild-type, but also with new abilities to promote cancer development [19, 22]. Taking this into account, it is important to consider that the restoring of the wild-type p53 expression and consequent reactivation of its downstream effector pathways has impact on cancer therapy. Therefore, an effective application of a p53 DNA-based cancer is an emerging possibility, using plasmid DNA as a non-viral delivery system, being a suitable approach for gene therapy in cancer diseases [21].
1.2. Plasmid DNA Production
1.2.1. Plasmid DNA vector selection
The vector and host selection is one of the most crucial steps in recombinant technology. It is necessary assure plasmid stability, enhance product safety, increase yield and facilitate downstream steps [23]. Plasmid vectors have the ability for transgene DNA, and can accommodate large segments of genomic DNA for physiological regulation of expression where is needed. The construction of the plasmid DNA vector is relatively easy and well known. It also allows the manipulation of several regulatory elements. The deletion of unnecessary pDNA sequences is recommended to keep the pDNA molecule small and easy to manipulate, increasing the efficiency of the overall production [24]. It is important to guarantee the compatibility between the DNA plasmid vector and the host strain with the goal of inducing the expression of the interest gene. The genetic elements of the expression plasmid include an origin of replication (ORI), a selective marker, antibiotic resistance, transcriptional promoters, translation initiation regions (TIR) and transcriptional and translational terminators (see figure 2) [25].
4 Many vector engineering efforts are focused on modifications to the basic therapeutic backbone. The goal of these modifications is to enhance the production process by increasing yield, improving product homogeneity and quality, and/or ensuring the sequence fidelity of the final plasmid product. The sequence integrity of a plasmid vector should be controlled during the production process because of its enormous impact on product safety, yield, and quality. Modifications in the strain and vector used for production of pDNA can ensure that the sequence and structure of the plasmid is maintained during the whole process [23]. That point is directly related with plasmid structural and segregational stability. The structural instability could be due to deletions, insertions, duplications, inversions and translocations. Another factors affecting plasmid structural stability like the plasmid size, polyA sequences, direct repeats and inverted repeats. However, the environmental stresses (antibiotic concentration, medium composition and temperature and oxygen fluctuations) can be directly connected with the occurrence of spontaneous mutations [26]. The segregational instability is related to the loss of multi copy plasmids from cultures during cell division due to uneven plasmid transfer into daughter cells. In prokaryotic cells, transcription and replication processes are competitive, which means that an increased transcription blocks the segregation of plasmid molecules and, also, overloads the bacterial ability to repair plasmid DNA. Moreover, the segregational instability results of the accumulation of plasmid multimers leading to a decrease in the number of segregating units, increasing the probability of plasmid loss [27]. Culture conditions, such as pH and dissolved oxygen could also affect plasmid maintenance, affecting the segregational stability [30].
Another relevant issue is the plasmid isoform. Supercoiled isoform is considered more effective because it can produce higher levels of transgene expression. Furthermore, the risk of integrate the linear isoform into the host genome is higher and could lead to adverse deleterious effect [27, 36]. Thus, the supercoiled isoform is the preferred form of DNA when the goal is gene therapy and vaccination application, and should be greater than 95%. This is a requirement of FDA, which demand a minimum level of supercoiled isoform in the final product. Taking that into account, the goal is to obtain high levels of SC-DNA and less of the contaminating genomic DNA, RNA and proteins without compromising the final product stability [30]. The degree of supercoiling in E. coli is controlled by DNA topoisomerases and DNA gyrases, ranging according with environmental conditions (pH, nutrient supply, dissolved oxygen). Also, during E. coli fermentation the percentage of supercoiled isoform is constant along the most of exponential phase, however, at the beginning of the stationary phase that percentage decrease. Another influence on the quality of pDNA, specially, the supercoiled isoform is the growth media and strain used [27].
As referred previously, there are issues related with health concerns. Vectors used in DNA vaccines require special considerations from World Health Organization (WHO), Food and Drug Administration (FDA) and European Agency for the Evaluation of Medicinal Products (EMEA).
5 There are many issues to take in consideration such as: 1) the plasmid should not contain significant homology to the target organism genome in order to reduce chances of chromosomal integration; 2) Not encoded sequences should be removed, but take in account the bacterial yield, quality, eukaryotic expression and immunogenicity; 3) Regions encoding antigenic peptides should not be present, like cryptic open reading frames that may be expressed in eukaryotic cells; 4) The in vivo effects of antibiotic resistance must be evaluated and their use is not advisable; 5) Antigen genes with enzymatic activity or virulent issues should be inactivated or have attenuated mutations [13].
Figure 2 - Vector engineering strategies. The bacterial elements required for propagation of the plasmid in E. coli are the selectable marker and the plasmid origin of replication. The eukaryotic elements of the vector required for in vivo efficacy include the eukaryotic promoter, therapeutic or antigenic gene, and polyadenylation signal (polyA) (adapted from [23]).
1.2.2. Host Selection
In order to achieve an appropriate immune response, DNA vaccines require milligram dosages, so, the volumetric and specific yield of plasmid DNA should be maximized during the upstream phase [3]. Accordingly with that, it is necessary to improve the production step, selecting a suitable host/vector, which directly affect the quality and quantity of the purified DNA. For pDNA biosynthesis, E. coli strains with high plasmid copy numbers and high plasmid retention levels are preferentially used as host [30]. This Gram-negative bacterium is the one of the most
6 used host because of its robustness, capable of fast growth with minimal nutritional requirements, and the genome is fully sequenced and could be easily manipulated [32]. The E.
coli strains are being developed continuously, with suitable characteristics for molecular
biology in order to achieve a strain with the requirements desired for gene therapy application (see table 1). Two genes that are frequently knocked out to improve plasmid yield and quality are endA and recA. The first one encodes DNA-specific endonuclease 1 and the other one encodes for a protein essential for the recBCD pathway of homologous recombination [32]. Mutation in endA prevents plasmid degradation after cell lysis. Mutation in recA, ensure insert stability and also decreasing mutation frequency, preventing plasmid structural instability [27].
Table 1 - E. coli host strains commonly used in plasmid DNA biosynthesis (adapted from [30]).
1.2.3. Escherichia coli metabolism
As stated above, E. coli can be genetically modified by molecular tools, allowing the appearance of industrial strains for the production of metabolites and recombinant proteins. This microorganism is able to grow in defined media using different carbon sources, like glucose and glycerol. When glucose is the primary source of carbon, central metabolism of E. coli is mainly constituted be the Embden Meyerhof Parnas (EMP) pathway, the Pentose Phosphate pathway (PPP) and the Tricarboxilic Acid cycle (TCA). Acting synergistically, those pathways provide energy, reducing power and biomass precursors for the cell [33, 39]. This sugar can be internalized into the cell by the sugar phosphotransferase system (PTS). The system consists of
7 sugar-specific PTS permeases, which include enzymes II (EII), and two general PTS proteins, enzyme I (EI) and histidine-containing protein (HPr) that participate in the phosphorylation of all PTS-transported carbohydrates [28]. In E. coli, the enzyme II complexes, IIGlc and IIMan, are
involved in glucose import. Glucose can also be actively transported into the cytoplasm by systems that are normally involved in galactose internalization, like Galp protein [33].
Galactose and glucose can be used for E. coli system, and find in the medium, when lactose is used as carbon source. Lactose can be hydrolysed to glucose and galactose by β-galactosidase [31]. A diauxic growth occurs when this two sugars (glucose and lactose) are present, because
E. coli uses preferentially glucose and just starts to metabolize lactose when glucose is
exhausted [34]. At the presence of glucose, lactose permease, shows weaker activity, because the transport of glucose into the cell by PTS decreases the level of phosphorylation of enzyme IIGlc that binds to lactose permease, inactivating it [35].
When glucose is the preferencial sugar for E.coli metabolism, an inherent problem is the acetate accumulation that affects the cell physiology and the productivity of cell culture [37]. This fact can be explain through the conversion of phosphoenolpyruvate (PEP) in pyruvate, and consequently in acetate. PEP is a precursor in the reaction catalysed by pyruvate kinase (Pyk) isozymes, Pyk A and Pyk F producing pyruvate and ATP. These isozymes are encoded by genes
PykA and Pyk F. The last one, shows higher activity than PykA in wild type [39]. It has been
observed in previous studies the effect of PykF knockout, showing that the growth rate of the mutant cells was barely lower than wild type and in consequence, acetic acid formation was smaller. Briefly, a decrease on acetate formation centred on metabolic pathways because the synthesis of pyruvate would decrease and PEP would be converted to oxaloacetate (OAA) without pyruvate kinase activity (see figure 3) [32].
8 Figure 3 – Central carbon metabolism pathway in E. coli. In the figure PTS (in blue), the non PTS glucose uptake system (in purple), PEP node (green) and AAA (yellow) enzymes are depicted. The allosteric effects that PEP has in EMP and acetate biosynthesis are in orange line for inhibition and blue arrow for activation (adapted from [39]).
Acetate secretion is a problem for cells and pDNA production because of many factors such as: 1) overflow metabolism, inhibiting cellular growth due to it toxicity; 2) limits recombinant protein production; 3) is vital for the design of fermentation processes and some biotransformations [40]. To overcome this problems, new E. coli strains have emerged like E.
coli VH34 and E. coli VH35 with knockout in Pyk A and Pyk F genes, respectively. However,
despite the knockout in Pyk genes, which decrease the pyruvate synthesis and consequent the acetate production, that precursor, in the presence of glucose, can be converted in pyruvate through PTS system. A knockout in PTS gene is the solution to overcome that problem (see table 2) [32, 39]. On the other hand, a lack in PTS activity shows lower growths in the presence of
9 glucose, therefore, a selection method isolating mutants that display rapid growth on glucose was employed [39].
Table 2– E. coli W3110 variants with different genetic modifications used in plasmid DNA biosynthesis (adapted from [39]).
The genetic modification of E. coli strains are made to improve pDNA production by knockout or overexpression of carefully selected genes. Modification of central carbon catabolism genes is an interest and focus area in order to increase flux toward nucleotide and aminoacid precursor synthesis and decrease the production of by-products such as acetate. As well as, genes associated to improving pDNA yield are also common targets [32].
10
1.3. Fermentative process for bacterial growth
1.3.1. Medium Characterization
The fermentation success it is dependent of the interaction host/vector and the growth environment. The composition of medium culture can severely affect the purity and yield of the plasmid, and consequently the overall cost of the production. This process requires a balanced medium that supplies adequate amounts of nutrients needed for energy, biomass and cell maintenance, in order to maximize product yield and minimize the levels of contaminants [41, 42]. Designing a balanced medium is centred on the cell’s energy requisites and elemental composition. The nutrients requirements are satisfied by a defined, semi-defined or complex media. Defined (minimal) media supply minimal nutritional requirements, and microorganisms like E. coli can growth and synthesize metabolites in that minimal medium, just needing a simple carbon source, nitrogen source and salts. There are some evidences showing that media and the overall upstream process can provide higher plasmid copy number [27, 38]. This type of medium is composed just for carbon sources (glucose or glycerol), salts, vitamins and specific amino acids or another substances like thiamine, having the advantage that their composition is exactly known. Semi-defined medium, are composed of a defined and a complex portion. The complex components most commonly used are yeast extract, casamino acids and peptones [12, 45]. The addition of those components provides growth factors, amino-acids, purines and pyrimidines and supports higher cell densities. Complex medium are predominantly composed by complex components, originated from biological material, which will have repercussion in process yield and also in downstream processing because could be presents undesired substances. Although this media could lead to the formation of undesired products upon sterilization, is difficult to handling because the low dissolution [30, 43].
Succinctly, plasmid DNA production is influenced by several parameters like the host strain, the plasmid sequence and the fermentation conditions. The media composition will directly affect the plasmid quality and yield. So, when formulating a media for plasmid production, it is necessary to consider various factors such the effect of components on plasmid yield and quality, biomass yield and the potential interference with downstream stage [41, 44].
1.3.1.1. Carbon Source
The carbon source provides energy and biomass and is usually the limiting nutrient in cultures. Glucose and glycerol are the most conventional choices as carbon source for plasmid DNA production. Glucose is inexpensive and easily metabolized by E. coli, but high levels could lead to undesired acetate production, which inhibit growth and plasmid biosynthesis [45, 46].
11 Although glycerol avoids higher levels accumulation of acetate, which allow the use of higher concentrations without becoming inhibitory, however the general yield is smaller than glucose as carbon source [45]. A different approach is the addition of alternative carbon sources such as fructose, lactose, mannitol and sucrose to the culture medium. This sugars could increase the plasmid DNA yield, when compared with complex medium [47].
1.3.1.2. Nitrogen Source
Bacteria requirements for nitrogen can be satisfied by inorganic or organic sources. Inorganic and organic ammonia and ammonium salts like ammonium chloride or ammonium sulphate are used in minimal media. Another complex compounds like yeast extract, peptones and casamino acids are used in semidefined media [45].
The selection of the nitrogen source and the determination of its concentration are critical to the optimization of pDNA biosynthesis. Casamino acid and yeast extract are two nitrogen sources which affect plasmid DNA productivity. Zhi-nan and coworkers (2005) demonstrated that using yeast extract as nitrogen source showed higher plasmid content and cell mass than casamino acids [49]. Yeast extract and tryptone contain the required aminoacids (aspartic acid, glutamic acid, glycine, histidine, leucine, and tryptophan), nucleosides (adenosine, guanosine, and thymidine) and thiamine for cell growth and higher plasmid DNA yield. They also contain phosphorus (0.75% and 0.29% respectively to yeast extract and tryptone) which support the building of nucleotides [43]. Another approach used to increase the plasmid DNA yield is the carbon/nitrogen (C/N) ratio. This has a direct impact on plasmid copy number with the highest results obtained with a typically 2.78/1 C/N ratio [50, 51].
1.3.1.3. Salts and minerals
Minerals are important for bacterial growth, metabolism and enzymatic reactions. Di and monopotassium phosphates work as buffer agents. The salt solution could also provide, in lower amounts, other essential minerals like calcium, iron, copper, cobalt, manganese, molybdenum and zync. Whether to adjust osmolarity, this could be performed with sodium chloride [41]. In table 3 there is an example of composition of a typical salt solution apply in the fermentation medium.
12 Table 3– Composition of a typical salt solution apply in the fermentation medium (adapted from [37]).
Component Concentration (mM) K2HPO4 90 KH2PO4 10 (NH4)2SO4 40 NaCl 20 MgSO4.2H2O 1.6 CaCl2 0.05 FeSO4·7H2O 0.072
1.3.1.4. Dissolved oxygen, temperature and pH
Dissolved oxygen (DO), pH and temperature are crucial parameters that directly affect plasmid quality and yield. Fermentation process in bioreactor allows the control and monitoring of these parameters [41].
The temperature effect on plasmid production is related to the nutrient effect. Underneath the optimal temperature of growth of 37ºC in most E. coli strains, the cell membrane has a reduced ability to actively transport nutrients into the cell, which will produce a starvation effect. The effect of temperature depends of the type of the vector. In some cases, a temperature shift can be used to amplify plasmid copy number [44]. Oxygen and temperature affect the isoform of plasmid DNA. Oxygen also have an important role in plasmid stability. It was observed that a single drop in dissolved oxygen concentration to 5% of air saturation caused a rapid loss in plasmid stability and oscillations in oxygen input lead to plasmid instability [45]. Relatively to pH it is showed that using a pH between 7.0 and 7.2 could be a good strategy, promoting fast bacterial growth [44].
1.4. Agri-food subproducts media
1.4.1. Cheese whey as substrate
Whey is the main by-product of dairy industry, produced during the manufacture of cheese and casein from milk during coagulation process. It contains a high concentration of organic matter,
13 exhibiting high ranges of biochemical oxygen demand (BOD) and chemical oxygen demand (COQ) which causes environmental problems and creates countless difficulties for the dairy industry in their disposal. As a general rule of thumb, to make 1 kg of cheese about 9L of whey are generated [57, 58, 61]. This problem could be minimized with whey valorisation, having a good applicability in the food industry because of the high nutritional and functional values due to the proteins of whey. It can be used in soups, bakery and desserts for example. However, there are another interesting applications of cheese whey after the separation of its components, like a substrate for laboratory research and production of interest metabolites or compounds instead the commercial and most expensive substrates [54].
Some companies provide cheese whey in a powder solution (CWPS) which will make easier the manipulation and laboratory steps. The composition of the powder solution is approximately 73% lactose, 12% proteins, 1.5% lipids and the rest is a moisture [54]. That high content in lactose makes it able to use as a carbon source [59].
Is known that cheese whey has already some applications: inductor on recombinant high-cell-density fed-batch fermentations with E. coli [59]; production of bio-ethanol with S. cerevisae [54]; substrate on hydrogen production by E. coli [60].
Léon Rodriguez and collaborators (2006) produce penicillin acylase by E. coli using cheese whey (CW) as a carbon source (70% lactose). They demonstrate that all lactose was consumed by the host for all the assays performed (the CW concentration varied 5 g/L to 15 g/L), concluding that CW can be successfully applied as unique carbon source and inducer for the production of recombinant proteins [67].
1.4.2. Corn steep liquor as substrate
Corn steep liquor (CSL), a major by-product of corn starch processing, is a low-cost source of proteins, amino acids, minerals, vitamins and trace elements. It can be used as a rich and effective nutritional supplement, in particular, as a replacement for yeast extract and peptone, being an adequate nitrogen source [52, 53]. For use as supplement of culture medium, CSL should suffer a pre-treatment process of centrifugation. The typical composition of CSL supernatant was determined as: 65% water, 6.1% ashes, 3.4% free reducing sugars, 2.2% total kjeldahl nitrogen, 2.6% fat, density 1.14 and pH 4 [54].
CSL is an inexpensive nutrient-rich source and has been often used as a supplement in several microbial fermentations. However, some studies reveal that a supplementation of CSL with yeast extract result in higher yields and productivity [5, 48]. There are several examples of CSL applications such as: CSL used as carbon source at polyhidroxybutyric acid production in
14 by Acetobacter sp. V6 [56]; used as major nitrogen source on ethanol production by
Sacharomyces cerevisae [52, 53].
According with Agarwal and coworkers (2006), CSL as nitrogen improved succinic acid production by E. coli because it is a complex nitrogen source and contains many amino acids and sugars. They also demonstrate that higher concentration of CSL (10-20%) aren’t very effective because resulted in the distortion of C/N ratio leading to other pathways and the high viscosity of the medium results in a decrease on E. coli growth. In this study, CSL was supplemented with yeast extract in order to achieve higher productivity [48].
16
Chapter 2- Experimental Part
2.1. Materials and Reagents
Sulfuric acid (HPLC-grade) was acquired from VWR Internacional (Carnaxide, Portugal). The ethylene-diamine tetraacetic acid (EDTA), lactose was acquired from VWR (Carnaxide, Portugal), galactose was acquired from Sigma-Aldrich (Sintra, Portugal). Tris Base was acquired from Fisher Scientific (Porto Salvo, Portugal). Yeast extract was acquired from VPL (Famões, Portugal). Cheese whey powder solution (CWPS) and Corn Steep Liquor (CSL) were kindly provided by Professor José Teixeira (Universidade do Minho) acquired from Lactogal (Portuguese dairy company) and COPAM (starch manufacturer, Portugal), respectively.
2.2. Plasmid
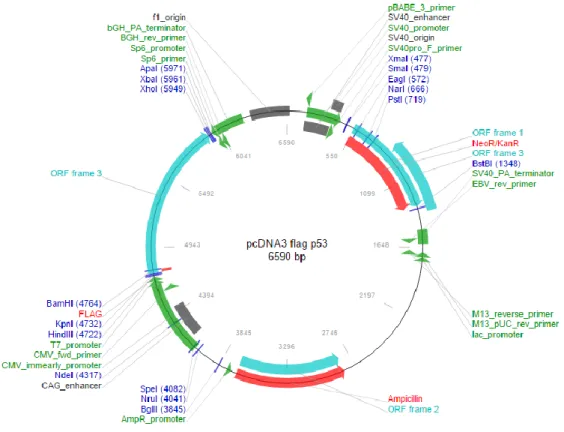
The 6.59 kbp pcDNA3–FLAG–p53, ampicillin-resistant plasmid, with pcDNA3 based backbone (see figure 4), was gently provided by Thomas Roberts.
17
2.3. Strain
The strain used in this work was E. coli VH35, gently provided by Professor Guillermo Gosset from the “Instituto de Biotecnología from Universidad Nacional Autónoma de México”. This strain was generated from E. coli VH33. Besides the glucose import dependent on GalP and glucose phosphorylation on glucokinase activity from VH33 strain, VH35 strain also contains a knock out on pykF gene. The transformation of that strain was performed with the 6.59 kb plasmid, described previously in section 2.2.
2.4. Transformation of competent cells
The development of competent cells and process transformation was performed according to Current Protocols in Molecular Biology (1.8.4-1.8.5) (1997) with minor changes, as described below.
2.4.1. Development of E. coli competent cells
A single colony of E. coli was inoculated into 25 mL LB medium during overnight at 37°C. With this cells, a fresh LB medium (10 g/L triptone, 5 g/L YE, 10 g/L NaCl) was inoculated with 5 mL of pre inoculum and the growth was performed at 37°C, 300 rpm and the inoculum grown to 0.35-0.40 of OD600. The flask was chilled during 15-30 minutes on ice and the cells were
centrifuged in falcon tubes (1000 x g, 15 min, 4ºC). The supernatant was discarded and the pellet was resuspended with prechilled glycerol 10%. Again, the cells were centrifuged (1000 x g, 15 min, 4ºC), supernatant was discarded and the pellet was resuspended with GYT medium (10% glycerol, 15.5 g/L YE, 2.5 g/L triptone). The concentration of cells in this broth was approximately of 2-3x10¹⁰ cells per mL and total volume was distributed (100 μL) for aliquots,
which were rapidly frozen with liquid nitrogen and stored at -80°C.
2.4.2. Cell Transformation
An aliquot of competent cells was defrost on ice together with the cuvette, and the plasmid was added to a suspension cells. This mixture was transferred to electroporation cuvette and incubated 5 minutes in ice. The cuvette was placed on an electroporation system where it was applied a pulse with 2500 V. After this, 500 µL of SOC medium (0.5% YE, 2% tryptone, 10 mM NaCl, 2.5 mM KCl, 10 mM MgCl2, 10 mM MgSO4, 20 mM glucose) pre-autoclaved was added to
18 SOC medium sterile and incubated during one hour a 37ºC. At the end, LB plates were supplemented with ampicillin for further inoculation.
2.5. Master and working cell bank
The Master cell bank was prepared from a single colony picked from agar plate and inoculated in LB medium supplemented with 100 μg/mL ampicillin. Cultures were grown between 0.5 and 0.6 OD600 at 250 rpm and 37°C. Then, 7 mL of cell culture was put into a falcon tube, followed
by addiction of 3 mL glycerol, achieving a final glycerol concentration of 30 % (v/v). This mixture was distributed in 1 mL cryotubes and frozen first at -20ºC and finally at -80°C. The working cell bank was prepared by growing an aliquot of the master cell bank. The procedure and conditions used were the same as the master cell bank.
2.6. Pre-treatment of by-products
2.6.1. Preparation of CSL as a supplement or medium culture
When directly used as a medium or supplement, after autoclaved, CSL formed some precipitates which can interfere with growth kinetics and plasmid DNA production. Based on Silva and coworkers (2010), a CSL solution 50% (v/v) was prepared, the pH was set to 6.9 and then autoclaved. After that, the solution was centrifuged (3900 x g, 45 min, 4ºC) maintaining sterile conditions. The sediment was discard and the supernatant was stored for further application. These substrate was added to the medium culture with the adequate dilutions to that work. In the present study CSL was used as medium at the concentrations 5%, 10% and 15%. When used as supplement, concentrations of 1%, 2% and 2.5% were applied.
2.6.2. Preparation of CWPS as medium culture
Typically CWPS doesn’t needed a pre-treatment like CSL. The powder was directly added to the medium. However if after autoclaved the medium shows some turbidity, a centrifugation step like in CSL is needed. With CWPS a largest range of concentrations where tested: used as unique substrate, concentrations of 0.6%, 1.2%, 5% were tested. When used as complement of CSL, it was tested concentrations of 1.2%, 2.5% and 5%.
19
2.7. Cultivation Conditions for plasmid production
2.7.1.
Pure lactose as substrate
At first, studies with pure lactose were performed, in order to observe E. coli VH35 response to this carbon source. Concentrations of 2.5 g/L, 5 g/L, 7.5 g/L and 30 g/L were tested.
E. coli VH35, was cultivated into different media conditions. All pre-culture and culture
fermentations contained 100 µg/mL of ampicillin to maintain a selective growth and their conditions and compositions were always the same. The same salt solution was used: 90 mM K2HPO4, 10 mM KH2PO4, 40 mM (NH4)2SO4, 20 mM NaCl, 1.6 mM MgSO4.2H2O, 0.05 mM CaCl2,
0.072 mM FeSO4.7H2O. Salts solution were autoclaved with medium and the concentration used
was 10%. The nitrogen source was always the same and yeast extract was fixed at 10 g/L. To understand the effect of lactose as carbon source, cells were grown in media with different lactose concentrations. All media contained lactose (2.5, 5, 7.5 or 30 g/L) and 10 g/L of yeast extract. It is necessary adjust pH to 6.9.
The fermentations were performed in 500 mL shake flasks containing 125 mL of medium at 250 rpm, 37ºC. The fermentation time was near 30 hours and several fermentation broth samples were taken for further analyses. All cultures started with an OD600 of approximately 0.2 by
inoculation with a pre-culture grown in 500 mL shake flasks containing 125 mL of medium at 250 rpm at 37°C.
2.7.2.
CWPS and CSL as substrate
In initial experiments these by-products were tested separately. The concentrations studied for each one were 0.6%, 1.2% and 5% for CWPS, and 5%, 10% and 15% for CSL. After that, a conjugation of the by-products were performed with the concentrations: CSL 1% with CWPS 2.5%, CSL 2% with CWPS 1.2% and CSL 2.5% with CWPS 5%. The same salt solution (described above in 2.7.1.) was added in all assays. With the exception of a final assay performed with 5g/L YE added to CSL 2% with SQ 1.2%, there was no addition of any other supplements to the mediums. The pH is set to 6.9.
The pre-culture was equal to the culture, with 100 µg/mL of ampicillin, and once again the culture was initiated with OD600 of approximately 0.2. The fermentation were performed
20
2.8. Alkaline cell lysis
Typically, in all assays, 100 mL of bacterial pellets were collected from centrifugation of cell broth at 3900 x g for 30 min at 4°C (Beckman Coulter Allegra X22 centrifuge). The 100 mL of bacterial pellet was thawed and dissolved in 8 mL resuspension buffer (50 mM glucose, 25 mM Tris-HCl, EDTA, pH 8.0) and transferred to lysis tubes. Then, alkaline lysis was performed by adding and gently mixing 8 mL of a 200 mM NaOH, 1 % (w/v) sodium dodecylsulfate (SDS) solution, and staying 5 minutes incubating at room temperature. After that, cellular debris, gDNA and proteins were precipitated by adding and gently mixing 7 mL of prechilled 3 M potassium acetate, pH 5.0, and then incubate on ice during 20 minutes. The precipitate was removed by centrifuging twice at 20,000 × g during 30 min at 4°C with a Beckman Coulter Allegra 25R centrifuge. With this clarified extract, quantification of plasmid were performed on an ÄKTA Purifier system (GE HealthCare Biosciences) [37, 63].
2.9. Plasmid DNA quantification
To measure the concentration and purity of pDNA an HPLC method based on hydrophobic interaction chromatography was selected . In this method was applied a 4.6/100 mm HIC Source 15 PHE PE column (Amersham Biosciences) connected to an ÄKTA Purifier system (GE HealthCare Biosciences). Initially, the column was equilibrated with 1.5 M (NH4)2SO4 in 10 mM
Tris-HCl buffer, pH 8.0. The loop of system allowed a 20 µL sample injection with 1 mL/min of flow rate. The absorbance of samples was recorded at 260 nm. The pDNA concentration in each sample was calculated using a calibration curve constructed with pDNA standards (1–100 µg/mL) purified with a commercial Qiagen kit (Hilden, Germany). The purity degree was defined as the percentage of the pDNA peak area related with the total area (area of all peaks on the chromatogram) [62, 63].
2.10. Plasmid DNA quality analysis
The agarose gel electrophoresis experiments were performed using a 1 % agarose gel supplemented with green safe (0.5 μg/mL). Electrophoresis was carried out at 110 V for 30 min in Tris–Acetate–EthyleneDiamine (40 mM Tris base, 20 mM acetic acid and 1 mM EDTA, pH 8.0) (TAE) buffer. The agarose gels were visualized under UV light in a Vilber Lourmat system (ILC Lda, Lisbon, Portugal) [37].
A highly pure plasmid DNA for eletroforese analyse was obtained using a NZYMiniprep kit from Nzytech (Lisboa, Portugal). That kit is based on the alkaline lysis of bacterial cells followed by adsorption of DNA onto silica in the presence of high salt.
21
2.11. Metabolites Assessment
For metabolites determination (lactose, glucose, galactose and acetate) samples were recovered at specific times and centrifuged at 13,000 × g for 7 min at 4ºC. The resulting supernatant was then filtered through a 0.22 µm filter (Millipore) for subsequent HPLC analysis onto an Agilent 1290 Infinity LC HPLC system (Waldbronn, Germany) coupled with a Refractive Index Detector (RID) (Agilent 1260 Infinity). Compound separation was achieved using a Hi-Plex H ion-exchange analytical column (Agilent, Santa Clara, CA, USA) with a 7.7 × 300 mm and 8 µm pore size. The mobile phase consisted of a 5 mM H2SO4 solution prepared with ultrapure
water, filtered through a 0.2 µm pore membrane and degassed for 15 min before use. Flow rate was set to 0.6 mL/min and column temperature was set to 50ºC [37].
2.12. Plasmid copy number determination
Quantitative real-time PCR (RT-PCR) for determination of plasmid content was performed. The amplified fragment (209 bp) was achieved by using a specific primers to ampicillin resistance gene (forward primer 5′-AAT AAA CCA GCC AGC CGG AA-3′, reverse primer 5′-TTG ATC GTT GGG AAC CGG AG-3′) and analysis were carried out in Bio-Rad iQ™ 5 real-time PCR Detection System using the Maxima™ SYBR Green qPCR Master Mix. The reactions were incubated at 95 °C for 10 min, followed by 30 cycles of 10 s at 63 °C and 30 s at 70°C. The calibration curve relates the Ct value versus the logarithm of pDNA mass and it was prepared with purified pDNA and
non-transformed E. coli VH35 cells. The number of cells used in each reaction (standards and samples) was kept constant (OD600 = 0.2). The assessment of PCN was based on plasmid base
pair number (6590 bp) and the average molecular weight of DNA base pair (660 Daltons) [37]:
𝐷𝑁𝐴 (𝑐𝑜𝑝𝑦) = 6.02 × 10
23× 𝐷𝑁𝐴 𝑎𝑚𝑜𝑢𝑛𝑡 (𝑔) 𝐷𝑁𝐴 𝑙𝑒𝑛𝑔ℎ𝑡 (𝑏𝑝) × 660(𝑔. 𝑚𝑜𝑙𝑏𝑝−1)
23
Chapter 3- Results and Discussion
3.1. Lactose assays and plasmid yield
According to the literature, that one of the acquired substrates (CWPS) is rich in lactose, with concentrations on a range of 50 g/L to 70 g/L [54, 57, 64]. The preliminary assays with pure lactose were performed in order to understand the best concentration of lactose, as carbon source, for plasmid DNA production in E. coli VH35. In previous studies, Martins and co-workers (2013) have optimized plasmid DNA yields using glucose as carbon source. Having this in account, assays with lactose at 5, 7.5 and 30 g/L were performed and analysed.
3.1.1. E. coli growth
As mentioned in materials and methods section, different lactose concentrations were tested at the same conditions (250 rpm, 37ºC, pH 6.9), using 10 g/L of yeast extract. Three replicates were used in all experiments.
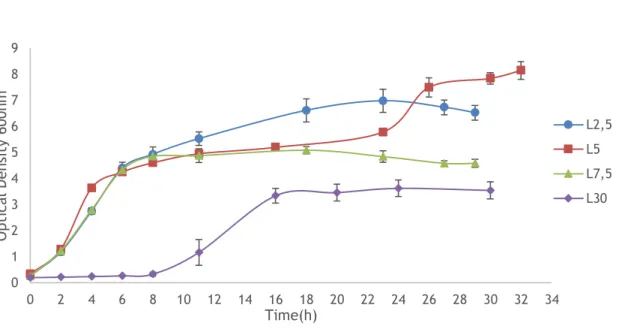
Figure 5 – Typical growth profile of E. coli VH35 with different concentrations of lactose (n=3).
The growth curve present in Fig.5 showed that higher concentrations of lactose are not favourable for E. coli growth and the stationary phase is reached after 16 hours and the growth
0 1 2 3 4 5 6 7 8 9 0 2 4 6 8 10 12 14 16 18 20 22 24 26 28 30 32 34 O pt ic al D en si ty 6 00 nm Time(h) L2,5 L5 L7,5 L30
24 is lower in comparison to all lactose concentrations under study. When lower concentrations were used, the stationary phase was reached earlier, between 10 and 12 hours. The growth of
E. coli achieved in terms of optical density was higher when 5 g/L of lactose is used. Besides
that, the specific growth is smaller when highest lactose concentrations are used (7.5 g/L and 30 g/L), and when lowest concentrations are used (2.5 g/L and 5 g/L), the specific growth is superior. When a concentration of 30 g/L is used, the adaptation phase is higher. The explanation for that is given below, after an overall analyse of the metabolites and the plasmid yield.
3.1.2. Determination of lactose, glucose, galactose and acetate on HPLC system
Quantification of sugars (lactose, glucose and galactose) and other metabolites (acetate) were performed as described above by HPLC system coupled with RID.The calibration curves for lactose and galactose were obtained using increasing concentrations and 3 replicates of each one. Calibrators were prepared in the concentrations of 1, 2, 5, 10, 15, 20, 30, 35 g/L. The remain calibration curves for glucose and acetate were already obtained by Martins L. (2013) [65].
The equation curves obtained and used in that study are described in table 4:
Table 4 - Equation curves of lactose, glucose, galactose and acetate.
Metabolite m b R2
Lactose 289627 48440 0.9989
Glucose 284767 27984 0.9980
Galactose 288628 29187 0.9980
Acetate 1473478 68.72 0.9990
Lactose was the carbon source used in these assays, so it is very important to understand how this strain is able to metabolize that sugar.
Lactose is hydrolyzed to glucose and galactose by β-galactosidase [66]. This phenomenon can be observed at figures 6, 7, 8 and 9, where is revealed a decrease in lactose concentration, with a consequent increase in glucose and galactose concentrations. At the same time, an increase of acetate production is observed due to glucose consumption [39].
25 Figure 6 – Sugars and acetate concentration in fermentations carried out at to 2,5 g/L of lactose.
The data demonstrate that when using a 2.5 g/L of lactose, the stationary phase is achieved after 6-8 hours, which is in accordance with the total consumption of glucose and galactose. However, the growing continues due to acetate consumption, becoming main substrate for E.
coli metabolism. These conditions are not ideal because it is proved that acetate is toxic for
the cell, which affect the growth and consequent on plasmid biosynthesis.
Figure 7 – Sugars and acetate concentration in fermentations carried out at 5 g/L of lactose.
When a concentration of 5 g/L was used, optimal conditions using lactose as carbon source where founded. Therefore, this concentration, can satisfy E. coli metabolic needs without resorting to acetate consumption. Figure 5 shows a diauxic growth, which suggests that all glucose is consumed by E. coli as preferential carbon source, and just after that, lactose is metabolized. The absence of lactose in the medium is another evidence that supports that fact [66]. -0,1 0,4 0,9 1,4 1,9 2,4 0 2 4 6 8 10 12 14 16 18 20 22 24 26 28 30 32 D O 6 00 nm Time (h) Lactose 2.5 g/L Lactose Glucose Galactose Acetate -0,1 0,9 1,9 2,9 3,9 4,9 5,9 0 2 4 6 8 10 12 14 16 18 20 22 24 26 28 30 32 Con ce nt ra ti on ( g/ L) Time (h)
Lactose 5 g/L
Lactose Glucose Galactose Acetato26 Figure 8 – Sugars and acetate concentration in fermentations carried out at 7.5 g/L of lactose.
Figure 9– Sugars and acetate concentration in fermentations carried out at 30 g/L of lactose.
For higher lactose concentrations the results are completely different. In figure 8 and 9 it’s possible to observe an inefficient consumption of all sugars. Mainly for 30 g/L lactose concentration it’s possible to reach that even lactose was not totally consumed by E. coli. Concerning the bacterial cell growth, the figure 5 shows the difficult of cell to adapt in these conditions and consequently the maximum growth is low. This fact can be explained by the inducer exclusion process. In E. coli, inducer exclusion is mediated by the glucose-specific enzyme IIA (EIIglc) of the PTS. When a PTS substrate like glucose, is present, the phosphate
group of PTS proteins is drained to the incoming sugar. Consequently, EIIglc exists pre-
dominantly in its unphosphorylated form. This form of EIIAglc binds to non-PTS sugar permeases
-0,1 0,9 1,9 2,9 3,9 4,9 5,9 6,9 7,9 0 2 4 6 8 10 12 14 16 18 20 22 24 26 28 30 32 Con ce nt ra ti on ( g/ L) Time (h)
Lactose 7,5 g/L
Lactose Glucose Galactose Acetato -4 0 4 8 12 16 20 24 28 32 36 0 2 4 6 8 10 12 14 16 18 20 22 24 26 28 30 32 Con ce nt ra ti on ( g/ L) Time (h)Lactose 30 g/L
Lactose Glucose Galactose Acetato27 (like lactose permease), that are specific for lactose. As a result, transport of this sugar is inhibited. Therefore, lactose is not able to enter on E. coli metabolism, and because of that, the cell becomes into an impasse and the growth will stop [28, 31, 66].
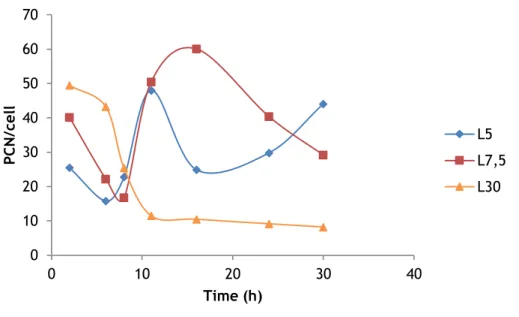
3.1.3. Determination of plasmid copy number
Figure 10 – Plasmid copy number per cell in relation to 5, 7.5 and 30 g/L of lactose.
The figure 10 shows that the lactose concentrations with higher PCN values are at 5 and 7.5 g/L lactose. However, at 7.5 g/L after approximately 15 hours the PCN values starts decreasing, otherwise, at 5 g/L after 15 hours there was an increase in PCN values. Once again, 30 g/L shows the worst result, with minor values for PCN.
3.1.4. Quantification of plasmid DNA
More important than understand how E. coli responds to lactose as carbon source and the sugars analyses, is to know if an alteration on carbon source really affects plasmid DNA production and yield. In table 5 are showed the results of pDNA volumetric and specific yield for 2.5, 5 and 7.5 g/L concentration of lactose. 0 10 20 30 40 50 60 70 0 10 20 30 40 P C N /c e ll Time (h) L5 L7,5 L30
28 purity.
As expected, the concentration of 5 g/L lactose shows higher volumetric and specific yield as well as purity. These results are very similar with one obtained by Martins and coworkers, of approximately 37μg/mL pDNA volumetric yield and 2.32% purity (using 20 g/L of glucose, 20 g/L triptone and 24 g/L of yeast extract). Accordingly with that, we can observe that using just 5 g/L of lactose supplemented with 10 g/L of yeast extracts, allow to achieve similar plasmid yield [37].
The experiments with 2.5 g/L of lactose shows that work at this low concentration doesn’t satisfy E. coli metabolic needs, leading to a starvation response, which is the reason of the appearance of a lag phase in figure 5, and that could the reason of a lower plasmid yield [66]. Taking into account the results obtained on the other assays, growth curve, sugars metabolization and PCN values, the concentration of 30 g/L was discarded. That shows that higher lactose concentration doesn’t favour E. coli growth and plasmid DNA yield.
3.1.5. Plasmid DNA quality
After the upstream stage, the quality of the obtained plasmid is an important factor to be considered for the choice of a sustainable fermentation medium formulation. The agarose gel electrophoresis (figure 11) shows that the medium L5 and L7.5 produce more plasmid in the supercoiled form. In contrast, and once again, as expected, the fermentation media L30 showed a poor quality and low yield of SC plasmid. This data supports the idea that definitely this concentration is not a good concentration to support pDNA biosynthesis.
Peak Area Concentration Purity
Lactose concentration
(g/L)
pDNA gDNA RNA
pDNA volumetric yield (μg/mL) pDNA specific yield (μg pDNA/ mg CDM) pDNA/ nucleic acids (%) 2.5 8.33±0.42 76.58±2.46 444.55±25.56 18.1±0.82 6.54 1.57 5 17.71±0.79 98.32±1.48 640.16±10.38 36.19±1.53 10.24 2.34 7.5 2.98±0.64 99.44±3.70 480.43±7.87 7.78±1.23 3.30 0.51


![Table 1 - E. coli host strains commonly used in plasmid DNA biosynthesis (adapted from [30])](https://thumb-eu.123doks.com/thumbv2/123dok_br/18068143.864258/30.893.182.769.426.815/table-coli-host-strains-commonly-plasmid-biosynthesis-adapted.webp)
![Table 2– E. coli W3110 variants with different genetic modifications used in plasmid DNA biosynthesis (adapted from [39])](https://thumb-eu.123doks.com/thumbv2/123dok_br/18068143.864258/33.893.332.621.274.770/table-variants-different-genetic-modifications-plasmid-biosynthesis-adapted.webp)