Aquatropolis – Contributions for the definition of an intelligent
management system in aquaculture.
Simone Isabel Ferreira Teixeira
Aquatropolis – Contributions for the definition of an intelligent
management system in aquaculture.
Simone Isabel Ferreira Teixeira
Dissertation for the Master's Degree in Aquaculture
Dissertation conducted under the guidance of Dr. Sérgio Leandro
Title: Aquatropolis – Contributions for the definition of an intelligent management system in aquaculture.
Título: Aquatropolis – Contributos para a definição de um sistema de gestão inteligente em aquacultura.
Copyright © Simone Isabel Ferreira Teixeira
A Escola Superior de Turismo e Tecnologia do Mar e o Instituto Politécnico de Leiria têm o direito, perpétuo e sem limites geográficos, de arquivar e publicar esta dissertação através de exemplares impressos reproduzidos em papel ou de forma digital, ou por qualquer outro meio conhecido ou que venha a ser inventado, e de a divulgar através de repositórios científicos e de admitir a sua cópia e distribuição com objetivos educacionais ou de investigação, não comerciais, desde que seja dado crédito ao autor e editor.
VI Page intentionally left blank
Agradecimentos
Esta dissertação não seria possível de realizar sem a ajuda de algumas pessoas e ao qual não posso deixar de agradecer.
Primeiramente quero agradecer aos meus pais que são o meu pilar e sempre se sacrificaram imenso para eu poder realizar todos os meus sonhos e chegar onde estou hoje.
Quero agradecer a toda a minha família pelo apoio e força que me deram nesta etapa. Agradecer ao meu namorado e companheiro Tiago Rodrigues pelo apoio incondicional, pela força nas horas de maior desespero e por todo o amor e carinho, foste o meu porto de abrigo.
Ao meu colega de trabalho e fiel amigo Pedro Pires, à minha colega Beatriz Trindade e ao meu colega Marco Simões pela ajuda preciosa nestes meses, a tese não teria tanta animação sem vocês.
À minha colega de casa e amiga Catarina Rosado Correia pelo companheirismo e conselhos durante esta etapa.
Ao meu orientador Dr. Sérgio Leandro pela confiança que depositou em mim para a realização desta dissertação e por todo o tempo que dispensou para me guiar nesta etapa.
À Especialista Teresa Baptista por toda a ajuda e tempo dispensado, foi sem dúvida um grande apoio.
Ao Hugo Metelo Diogo e à Ana Ribeiro da Compta pela oportunidade que me deram para fazer parte da equipa do projecto Aquatropolis.
O trabalho foi desenvolvido no âmbito do projeto “Aquatropolis – Intelligent Management System for Sustainable Aquacultures (copromoção n.º 17888)”, cofinanciado pelo FEDER – Fundo Europeu de Desenvolvimento Regional, no âmbito do Programa Portugal 2020, através do COMPETE 2020 – Programa Operacional Competitividade e Internacionalização.
VIII Page intentionally left blank
Resumo
A pesca e a aquacultura continuam a ser fontes importantes de alimento, nutrição, rendimento e meios de subsistência para centenas de milhões de pessoas em todo o mundo. O abastecimento mundial de peixe per capita atingiu um novo recorde de 20 kg em 2014, graças ao vigoroso crescimento da aquacultura, que agora fornece metade de todo o peixe para consumo humano e a uma ligeira melhora no estado de determinadas unidades populacionais de peixes devido à melhoria da gestão da pesca. Atualmente, uma quarta parte do pescado consumido na UE é produzido em aquacultura, em 2011, 1,24 milhões de toneladas de pescado de aquacultura foram produzidos na UE, com um valor de € 3,51 bilhões. Os modelos de produção têm como objetivo o desenvolvimento de estratégias que ajudem a aquacultura a tornarem-se mais eficientes e menos nocivas para o meio ambiente, as espécies robalo e dourada são espécies representativas da aquacultura portuguesa e também são espécies com maior importância em termos ibéricos e aquacultura europeia. A legislação que regula a atividade da aquicultura, especialmente quando é desenvolvida em áreas do domínio público, é muito dispersa e complexa, em particular pelo grande número de entidades envolvidas. Um aspeto muito importante no processo de produção é a quantidade adequada de alimento, que é calculada em função da biomassa e da temperatura da água, a fim de otimizar os índices de crescimento, FCR, SGR, DGI e K. A aplicação de tecnologias de visão por computador na aquacultura é complicada, os peixes são sensíveis, suscetíveis a stress e livres para se deslocar num ambiente em que a iluminação, a visibilidade e a estabilidade não são controláveis na maioria dos casos, portanto o projeto Aquatropolis tem como objetivo principal desenvolver recursos tecnológicos para otimizar as operações, reduzir os riscos e as incertezas que afetam o processo produtivo e, dessa forma, garantir mais rendimento aos produtores, qualidade e segurança alimentar para o consumidor final.
A abordagem metodológica do presente estudo foi estruturada em 3 tarefas: sistematização do processo de licenciamento aquático e revisão da legislação portuguesa; descrição dos modelos de produção aplicados nas principais espécies produzidas em Portugal e validação experimental dos protocolos de crescimento.
A compilação do licenciamento e legislação permite ao produtor uma leitura melhor e um fácil acesso, sendo uma ótima ferramenta de suporte. Os modelos de produção foram projetados para a automação de operações através de ordens de produção feitas para intervenção humana ou de equipamentos, combinadas com os diferentes parâmetros hidrológicos para uma produção inteligente que pode ser adaptada ao melhor custo-benefício. Para a validação dos protocolos de crescimento, concluiu-se que o melhor método de alimentação é a tabela de alimentação mostrando um melhor FCR, com a ajuda da Hydrology DS5 Water Quality Multiprobe com medição constante de parâmetros hidrológicos.
X Page intentionally left blank
Abstract
Fisheries and aquaculture remain important sources of food, nutrition, income and livelihoods for hundreds of millions of people around the world. World per capita fish supply reached a new record high of 20 kg in 2014, thanks to vigorous growth in aquaculture, which now provides half of all fish for human consumption, and to a slight improvement in the state of certain fish stocks due to improved fisheries management. Presently, a quarter of seafood products consumed in the EU are produced on farms, in 2011, 1.24 million tonnes of aquaculture goods were produced in the EU, worth €3.51 billion. The production models have as objectives the development of strategies that help aquaculture become more efficient and less harmful to the environment, the species seabass and gilt-head bream are representative species of Portuguese aquaculture and also, they are species with greater importance in terms of Iberian and European aquaculture. Legislation regulating aquaculture activity, especially when it is developed in areas of the public domain is too dispersed and complex, in particular by the large number of entities involved. A very important aspect in the production process is the adequate dosage of feed, which is calculated as a function of biomass and water temperature, in order to optimize growth rates, FCR, SGR, DGI and K. Application of computer vision technologies in aquaculture is complicated, the inspected subjects are sensitive, susceptible to stress and free to move in an environment in which lighting, visibility and stability are not controllable in most cases so the Aquatropolis project has as main objective develop technological resources to optimize operations, reduce risks and uncertainties affecting the productive process, and in that way ensuring more income for producers, quality and food safety for the final consumer. The methodological approach of the present study was structured on 3 tasks: systematization of the aquaculture licensing process and review of the Portuguese legislation; description of the production models applied on the main species produced in Portugal and experimental validation of growth protocols.
The licensing and legislation compilation allows the producer a better reading and easy access being a great tool of support to the producer. The production models were designed for the automation of operations through production orders made for human intervention or equipment operations, combined with the different hydrological parameters to an intelligent production that can be adapted to the best cost-benefit. For the validation of growth protocols, we conclude that the best feeding method is the feeding table showing a best FCR, with help of the Hydrolab DS5 Water Quality Multiprobe with constant measuring of hydrological parameters.
Keywords: Legislation, licensing, production models, hydrological parameters, Sparus aurata,
XII Page intentionally left blank
Index of contents
1. Introduction ... 1
1.1. Aquaculture in the world ... 1
1.2. Aquaculture in Europe ... 2
1.3. Aquaculture in Portugal ... 4
1.3.1. Aquaculture representative species in the Portuguese context – Seabass and Gilt-head bream……….7
1.4. Aquaculture legislation and licensing in Portugal ... 12
1.5. Water quality – hydrological parameters ... 12
1.6. Growth Rates ... 17
1.7. New technologies in aquaculture ... 18
1.8. Aquatropolis project ... 19
2. Material and Methods ... 21
2.1. Licensing and legislation ... 21
2.2. Production Models ... 21
2.3. Validation of growth protocols ... 21
2.3.1. Hydrological parameters... 21
2.3.2. Sampling ... 22
2.3.3. System and Feeding ... 22
2.3.4. Growth Rates ... 25
3. Results ... 27
3.1. Licensing and legislation ... 27
3.1.1. Licensing Entities ... 27 3.1.1.1. Other licenses ... 31 3.1.2. Legislation ... 32 3.1.2.1. Operation ... 37 3.1.2.2. Commercialization ... 39 3.2. Production Models ... 39 3.2.1. Gilt-head bream ... 40 3.2.2. Parameters... 41 3.2.3. Seabass ... 42 3.2.4. Parameters... 43
3.3. Validation of growth protocols ... 45
3.3.1. Sampling ... 45 3.3.2. Hydrological parameters... 45 3.3.3. Growth rates ... 47 4. Discussion ... 49 5. Conclusion ... 55 6. Bibliographic References ... 57
XIV Page intentionally left blank
Index of figures
Figure 1 - Evolution of EU aquaculture production volume (2008 - 2014). Volume in tonnes live weight, EU - 28. [Source: EUROSTAT].
Figure 2 - Main aquaculture species in EU countries. Average volume in tonnes live weight 2008 - 2014. [Source: EUMOFA].
Figure 3 - Main aquaculture producing EU countries. Average volume in tonnes live weight 2008 - 2015. [Source: EUROSTAT].
Figure 4 - A: Number and area of aquaculture establishments in Portugal; B: Type of aquaculture establishments in Portugal. [Adapted from INE, 2016].
Figure 5 - Aquaculture production by type of water and regime (2014). [Adapted from INE, 2016]. Figure 6 - Structure of production volume in aquaculture by species (2013-2014). [Adapted from INE, 2016].
Figure 7 - Sparus aurata. [Source: Fishbase, 2017]
Figure 8 - Distribution of the Gilt-head bream. [Source: Fishbase, 2017] Figure 9 - Dicentrarchus labrax. [Source: Fishbase, 2017]
Figure 10 - Distribution of the European seabass. [Source: Fishbase, 2017] Figure 11 - Aquatropolis logo and with the respective cofinanciers.
Figure 12 - Experimental tank.
Figure 13 - YSI Professional Series probe.
Figure 14 - Feeding chart supplied by the company Sorgal- Sociedade de Óleos e Rações S.A. for Sparus aurata.
Figure 15 - Hydrolab DS5 Water Quality Multiprobe.
Figure 16 - Temperature and dissolved oxygen ratio for August. Figure 17 - Temperature and dissolved oxygen ratio for September. Figure 18 - Temperature and dissolved oxygen ratio for October.
XVI Page intentionally left blank
Index of tables
Table 1 - Impact of hydrological parameters on aquaculture productivity. Table 2 - Hydrological parameters for adults of gilt-head bream and seabass. Table 3 - Important licensing for aquaculture.
Table 4 - Other important licenses/authorizations/registrations for aquaculture. Table 5 - Important legislation for aquaculture.
Table 6 - Important legislation about operation in aquaculture.
Table 7 - Important legislation about commercialization in aquaculture. Table 8 - Production model for gilt-head bream.
Table 9 - Water parameters for the breeding phase for gilt-head. Table 10 - Water parameters for the larval state phase for gilt-head. Table 11 - Water parameters for the pre-ongrowing phase for gilt-head. Table 12 - Water parameters for the growing out phase for gilt-head. Table 13 - Production model for seabass.
Table 14 - Water parameters for the breeding phase for seabass. Table 15 - Water parameters for the larval state phase for seabass. Table 16 - Water parameters for the pre-ongrowing out phase for seabass. Table 17 - Water parameters for the growing out phase for seabass. Table 18 - Initial and final weights and lengths of the three test months. Table 19 - Growth rates for the months August, September and October.
XVIII Page intentionally left blank
List of abbreviations
AGR Absolute Growth Rate
APA Aquaculture Production Area (Área de Produção Aquícola)
BPAO Byproducts of Processed Animal Origin (SPOAT – Subprodutos de Origem
Animal Transformados)
CE Conformité Européenne
CEE Comunidade Económica Europeia
CGAP Code of Good Agricultural Practises (CBPA – Código de Boas Práticas
Agrícolas)
CO2 Carbon dioxide
CRCD Commission for Regional Coordination and Development (CCDR –
Comissão de Coordenação e Desenvolvimento Regional)
DGI Daily Growth Index
DGRM Directorate for Natural Resources, Safety and Maritime Services (Direção
Geral de Recursos Naturais, Segurança e Serviços Marítimos)
DO Dissolved oxygen
DOC Dissolved organic carbon
EIA Environmental Impact Asssessment (AIA – Avaliação do Impacte Ambiental) EU European Union
FAO Food and Agriculture Organization
FCR Food Convertion Ratio
HRA Hydrographic Region Administration (ARH – Administração da Região Hidrográfica)
I&D Investigation and Development
INCB Institute for Nature Conservation and Biodiversity (ICNB – Instituto da Conservação da Natureza e da Biodiversidade)
INE Instituto Nacional de Estatística (National Institute of Statistics)
K Fulton Condition Index
MSPP Maritime Space Planning Plan (POEM - Plano de Ordenamento do Espaço
Marítimo)
NER National Ecological Reserve (REN – Reserva Ecológica Nacional)
PMTI Port and Maritime Transport Institute (IPTM – Instituto Portuário e dos Transportes Marítimos)
RDAF Regional Directorates for Agriculture and Fisheries (DRAP – Direção
Regional de Agricultura e Pescas)
XX
RGEL Regime Governing the Exercise of Livestock (REAP – Regime do Exercício
da Atividade Pecuária)
SGR Specific Growth Ratio
SMEs Small and medium-sized enterprises T Temperature
TGC Thermal Growth Coefficient
UV Ultraviolet
VCN Veterinary Control Number (NCV – Número de Controlo Veterinário) WSN Wireless sensor networks
1. Introduction
1.1. Aquaculture in the world
Fisheries and aquaculture remain important sources of food, nutrition, income and livelihoods for hundreds of millions of people around the world. World per capita fish supply reached a new record high of 20 kg in 2014, thanks to vigorous growth in aquaculture, which now provides half of all fish for human consumption, and to a slight improvement in the state of certain fish stocks due to improved fisheries management. Recent reports by high-level experts, international organizations, industry and civil society representatives all highlight the tremendous potential of the oceans and inland waters now, and even more so in the future, to contribute significantly to food security and adequate nutrition for a global population expected to reach 9.7 billion by 2050 (FAO, 2016).
As stated in FAO, 2016 in 2014, fish harvested from aquaculture amounted to 73,8 million tonnes, with an estimated first-sale value of US$ 160,2 billion, consisting of 49.8 million tonnes of finfish (US$ 99.2 billion), 16.1 million tonnes of molluscs (US$ 19 billion), 6.9 million tonnes of crustaceans (US$ 36.2 billion), and 7.3 million tonnes of other aquatic animals including frogs (US$ 3.7 billion). Measured at the national level, 35 countries produced more farmed than wild-caught fish in 2014. Countries in this group include five major producers, namely, China, India, Viet Nam, Bangladesh, and Egypt. The other 30 countries in this group have relatively well-developed aquaculture sectors, e.g. Greece, the Czech Republic and Hungary in Europe, and the Lao People’s Democratic Republic and Nepal in Asia.
According to FAO, 2016, by 2014, a total of 580 species and/or species groups farmed around the world, including those once farmed in the past, had been registered with production data by FAO. These species items include 362 finfishes (including hybrids), 104 molluscs, 62 crustaceans, 6 frogs and reptiles, 9 aquatic invertebrates, and 37 aquatic plants.
In agreement with FAO, 2016, many millions of people around the world find a source of income and livelihood in the fisheries and aquaculture sector. The most recent estimates indicate that 56.6 million people were engaged in the primary sector of capture fisheries and aquaculture in 2014. Of this total, 36 % were engaged full time, 23% part time, and the remainder were either occasional fishers or of unspecified status. For the first time since the period 2005–2010, the total engagement in fisheries and aquaculture did not increase. Overall employment in the sector decreased, almost entirely due to a decrease of about 1.5 million fishers, while engagement in aquaculture remained more stable. Consequently, the proportion of those employed in capture fisheries within the fisheries and aquaculture sector decreased from 83% in 1990 to 67% in 2014, while that of those employed in fish farming correspondingly increased from 17 to 33%.
1.2. Aquaculture in Europe
The aquaculture sector in Europe is diverse, encompassing traditional artisanal and family shellfish and pond-culture operations through medium-scale fish-farm businesses to multinational marine farming companies. The applied production technologies also show great diversity. However, more than 90 percent of the aquaculture farms are rather small farms that are geographically dispersed throughout Europe. The European aquaculture sector has emerged as an increasingly important contributor to the region’s food production sector and has grown significantly over the last two decades (Varadi et al., 2001).
Presently, a quarter of seafood products consumed in the EU (including imports) are produced on farms, in 2011, 1.24 million tonnes of aquaculture goods were produced in the EU, worth €3.51 billion. There are over 14 000 aquaculture enterprises in the EU, directly employing 85 000 people in total (Science for Environment Policy, 2015). Since European aquaculture is concentrated mainly in peripheral coastal and rural regions, there are also significant socio-economic benefits of aquaculture development in Europe. Much growth has been stimulated by consumer demand, as well as technological development work, making the different and various forms of production technically and economically viable (Varadi et al., 2001).
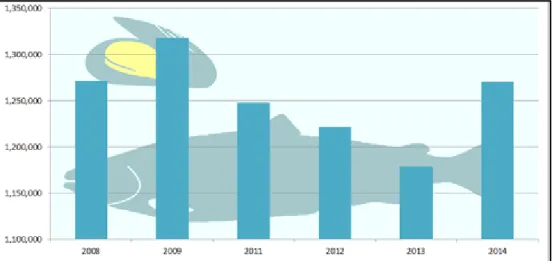
The percentage contribution of European aquaculture to world aquaculture production has decreased since 1988 due to the higher rate of increase seen in other regions, however, it is growing in absolute terms (Figure 1).
Figure 1 - Evolution of EU aquaculture production volume (2008 - 2014). Volume in tonnes live weight, EU -
28. [Source: EUROSTAT].
Although competition exists between wild and farmed supplies, the extent of direct substitution is variable and depends on the species concerned.
The contribution of aquaculture to food security has become and will remain important in certain regions of Europe, either directly, through consumption of the products, or indirectly, through the income and economic benefits obtained by the people involved in aquaculture and its related activities (Varadi et al., 2001)
The main species produced in Europe are mussels, trout and salmon. Following with other species like oyster, seabream, carp and seabass (Figure 2).
Figure 2 - Main aquaculture species in EU countries. Average volume in tonnes live weight 2008 - 2014.
[Source: EUMOFA].
Europe produced 2 930,1 thousand tonnes in 2014 c0orresponding to a world percentage of 3.97%. Its main producers were Spain, United Kingdom, France, Italy and Greece (Figure 3).
Figure 3 - Main aquaculture producing EU countries. Average volume in tonnes live weight 2008 - 2015. [Source: EUROSTAT].
In agreement with the European Commission, 2017, in Europe, aquaculture accounts for about 20% of fish production and directly employs some 85 000 people. The sector is mainly composed of SMEs or micro-enterprises in coastal and rural areas. EU aquaculture is renowned for its high quality, sustainability and consumer protection standards.
EU overall output has been more or less constant in volume since 2000 whereas global production, at the same time, has been growing by nearly 7% per year.
The Commission intends to boost the aquaculture sector through the Common Fisheries Policy reform, and in 2013 published Strategic Guidelines presenting common priorities and general objectives at EU level. Four priority areas were identified in consultation with all relevant stakeholders: reducing administrative burdens, improving access to space and water, increasing competitiveness and exploiting competitive advantages due to high quality, health and environmental standards.
On the basis of the guidelines, the Commission and EU countries are collaborating to help increase the sector's production and competitiveness. EU countries have been asked to set up multiannual plans to promote aquaculture. The Commission is helping with the identification of bottlenecks but also facilitates cooperation, coordination and exchange of best practices between EU countries.
1.3. Aquaculture in Portugal
In Portugal, until the 1970s, aquaculture production was dominated by mugilids, typically forage species of low commercial value, which accounted for about 80% of fish production. The 1980s were characterized by a large increase in fish farms in inland waters (particularly rainbow trout), accompanied by bivalves (especially clams) in brackish and marine waters. The 1990s are characterized by the strong growth and modernization of aquaculture of marine species, initially focused on sea bass and gilt and, more recently, on turbot and sole (DGRM, 2014).
The use of salt industry infrastructures (yew, dikes, floodgates, monks, etc.) by marine aquaculture has emerged as a cheap and easy process to turn these neutralised facilities into productive units with lower environmental impacts. However, the size of the tanks, the characteristics of the bottoms and the water flow rates, are limiting factors of the productivity of this traditional aquaculture system, falling under the semi-intensive production regimes, termed "esteiro" or "estuarine” aquaculture. Still using traditional methodologies, in the areas between tides are bivalve nurseries, in extensive regime, that contribute with a very significant portion for the national aquaculture production. In recent years, some establishments have been installed on the coast, operating in an intensive regime, capturing sea water and producing, in particular, turbot and sole (DGRM, 2014).
Since the early 1990s, aquaculture production has increased from 4 457 tonnes in 1990, increasing its production in 2015 to 10 791 tonnes, amounting to 50 million euros, which is justified
by the higher production of turbot and by its lower value in relation to the previous year, because of the increase of the production and the demand of fish of smaller sizes (DGRM, 2014; INE, 2016).
During this period, aquaculture production in fresh water has been reduced, both in absolute and relative terms, in relation to crops produced in marine or brackish waters, but increasing its production up to 2015 reaching 788 tonnes. The production in marine and brackish waters has therefore shown a growing trend, with the most commonly produced species being turbot, gilt-head bream/seabass, clams and oysters (DGRM, 2014). At the end of 2014, there were 1 521 licensed aquaculture establishments for fresh, salty and brackish water, 1 unit less than in 2013, with about 88,3% of ponds to produce bivalve molluscs, most of which are in Ria Formosa (Figure 4) (INE, 2016).
Since the sector is constituted, in the overwhelming majority, by very small companies, with a few exceptions, many of the difficulties experienced may be minimized or even exceeded through a greater degree of associative, either through collaboration between companies, both with the manufacturing industry and also with the institutions of the scientific and technological system with a view to improve production processes.
There are three types of production in aquaculture: we have the extensive regime in which it exclusively takes advantage of the available natural conditions and where the control of the production is almost non-existent. In the semi-intensive regime, it still requires a low level of control, but there is some recourse to inert feed. In the intensive regime, there is full control of the entire production, high technology and only used inert food.
The production of aquaculture in fresh water is exclusively intensive. In salty and brackish water, the intensive regime, which strengthened its weight in 2014, it originated 39.2% of production, while the semi-intensive sector accounted for only 13.1% of total production (Figure 5). The decrease in semi-intensive production was due to the conversion of many fish farms to extensive bivalve production (DGRM, 2014).
A
B
Figure 4 - A: Number and area of aquaculture establishments in Portugal; B: Type of aquaculture establishments in Portugal. [Adapted from INE, 2016].
Figure 5 - Aquaculture production by type of water and regime (2014). [Adapted from INE, 2016].
The main species produced in Portugal in fresh water are rainbow and common trout; in brackish and marine water (fish, molluscs and crustaceans) are meagre (Argyrosomus regius), gilt-head bream (Sparus aurata), European eel (Anguilla anguilla), sole (Solea solea), turbot (Psetta maxima), seabass (Dicentrarchus labrax), white seabream (Diplodus sargus), clams (Ruditapes decussatus), common edible cockle (Cerastoderma edule), common periwinkle (Littorina littorea), ditch shrimp (Palaemonetes varians), grooved razor shell (Solen marginatus), mussels (Mytilus edulis), Japanese oyster (Crassostrea gigas) and Portuguese oyster (Crassostrea angulata) (Figure 6) (INE, 2016).
Figure 6 - Structure of production volume in aquaculture by species (2013-2014). [Adapted from INE, 2016].
1.3.1. Aquaculture representative species in the Portuguese context – Seabass and Gilt-head bream
Production protocols are the secret of any aquaculture. It is stealthy and only those who work in the company have access because there is the danger of plagiarism of other competing companies, information leakage by the workers and a poorly drawn protocol leads to losses. A well-crafted and optimized protocol will generate a greater profit margin. Protocols are associated with a species in the context of a production phase that have associated production models with the aim of planning and triggering production orders and other daily actions to be performed by people or equipment.
A production model is a set of tasks that should constitute the day-to-day of the professionals who operate the production. A model is defined as a schedule of activities, each of which will require action and the collection of data. The models have as objectives the development of strategies that help aquaculture become more efficient and less harmful to the environment, thus justifying the hope and investment put in this type of culture and the optimization of protocols for production of traditional species and development protocols for new species in maternity and organic production methods, allowing diversification of supply.
The species seabass and gilt-head bream are representative species of Portuguese aquaculture and also, they are species with greater importance in terms of Iberian and European aquaculture.
The gilt-head bream, Sparus aurata, is a bream belonging to the Sparidae family and is currently the most cultivated saltwater fish in the Mediterranean (Figure 7).
It is a fish compressed laterally with the convex head profile and well-armed with teeth. It is easy to distinguish by the characteristic yellow stripe on the forehead, between the eyes, and is most evident in adult individuals. Another characteristic is the presence of a black spot on the operculum with the beginning of the line. The head is large, with the profile of the convex face and small eyes. The muzzle and preopercle have no scales. The mouth is large, and the upper jaw extends beyond the middle of the eye. It presents some, very thick fleshy lips, the upper jaw and is slightly larger than the lower one. Both jaws have 4 to 6 canines located in the anterior part and then 2 to 4 sets of small but powerful molars capable of crushing shells of molluscs from which they feed. In the lower part of the operculum, which has a characteristic pink band that can sometimes spread to occupy most of the operculum. The body is oval, tall and long laterally. It has a continuous dorsal fin with 11 soft thorny rays and 13 below. The anal fin has 3 hard and 11-12 soft rays. The pectoral fins are long and pointed, reaching the back of the beginning of the anal fin. The caudal fin is bifurcated, with two pointed lobes. The body is covered with cycloid scales, between 75 and 85 on the lateral line, which is simple and continuous. The colour is darker in the back and quite light in the silvery grey of the
belly. The dorsal fin is bluish grey, and has a medium black line, and the caudal fin is grey with black edges (Ortega, 2008).
Figure 7 - Sparus aurata. [Source: Fishbase, 2017]
It is common throughout the Mediterranean, it is also distributed along the eastern coast of the Mediterranean from Guinea and Senegal to the Bay of Biscay and the south of the British Isles. It is also present in the Canary Islands (Figure 8) (Sola et al.,2014).
Figure 8 - Distribution of the Gilt-head bream. [Source: Fishbase, 2017]
It is a marine species, very common in rocky and algae bottoms and Posidonia oceanica, which is not very often found on sandy or muddy bottoms. Young individuals have more coastal habits, living in bottoms of less than 30 meters, to which adults can reach 100-150 meters deep. Despite being a gregarious species, they often live alone or in small groups. However, reproductive migrations can form groups of thousands of individuals (Sola et al.,2014).
It is a eurytherm and euryhaline fish that is very sensitive to low temperatures, failing to feed if the temperature drops from 12-13 °C, which can withstand lower temperatures, being its minimum lethal in the order of 5-7 °C. On the contrary, it can withstand quite high temperatures, growing very fast at temperatures of 25-26 °C and withstand temperatures up to 32-33 °C. In relation to its euryhaline nature, its ecological plasticity is even greater: gilthead is a species that has been shown capable of living in salinity conditions varying between 3 and 70, crossing estuaries and coastal lagoons with a wide range of salinities (Ortega, 2008; Sola et al.,2014).
Their food is mostly carnivorous, preferring bivalve molluscs and small fish or cephalopods (Sola et al.,2014).
Its reproduction is hermaphrodite protandric type: first it behaves like male and later like females. During the first year of life they are immature, to which some can get to mature as males. But in most fish, the first sexual maturation only occurs during the second year of life. At this moment, the ventral part of the gonad develops, originating functional testicles. At the end of this reproductive phase, all individuals initiate a process of sexual inversion, which is completed by approximately 80% of the population that from the third year of life will behave like females. The remaining 20% interrupt reversion processes and remain male. However, this proportion also depends on other social factors. The maturation of the gonad is progressive, and this translates into a sequential set carried out for 2-4 months at a rate of about thousands of eggs per day. The total number of eggs per female is variable, ranging from 500 000 to 3 000 000 eggs/kg of females. The diameter of the eggs ranges from 0.9 to 1 mm. In nature, the posture season extends from November to February, which due to the posture zone may be delayed or delayed for a few weeks (Ortega, 2008; Sola et al.,2014).
The European seabass (Figure 9) is a percomorph of the Serranidae family. Its scientific name is Dicentrarchus labrax (Linnaeus, 1758) and is, together with gilt-head bream, the most important example of Mediterranean aquaculture, with a total production in 2015 exceeding 1 471 tonnes. There are other species of fish, some of which are freshwater, known as seabass: American seabass, Morone saxatilis (Walbaum, 1792), Asian seabass, Lates calcarifer (Bloch, 1790), etc. (Ortega, 2008).
Its body is broad and vigorous and is provided with large scales. The head is pointed, the mouth large, terminal and slightly protrusive. The nasal openings are relatively small, and the lower jaw is somewhat prominent. It has two dorsal fins, the first of which has 8-9 thorny rays and is triangular, while the second has 1 hard radius and 11-12 soft rays and is more irregular. The anal fin also has 3 hard spines rays, and the caudal fin is slightly bifurcated. The caudal peduncle is large, and the lateral line is complete, with 62-74 scales. Its colour is grey lead, darker in the dorsal part. The ventral part is yellowish and the sides are silver. These colours may vary depending on its area of distribution and the funds it is in. They have a diffuse black spot on the upper angle of the
characteristic spines. The vomer has teeth, the shape of which is characteristic in Dicentrarchus punctatus (Bloch, 1792). Its maximum size can reach 80-100 cm, with sizes between 40 and 55 cm being more common. (With this maximum size, its weight oscillates between 2 and 5 kg). It does not present sexual dimorphism to which the females have the head wider and the body is higher than the males, they grow faster and reach larger size (Ortega, 2008; FAO, 2017).
Figure 9 - Dicentrarchus labrax. [Source: Fishbase, 2017]
In the Mediterranean, there are two species of the genus Dicentrarchus: Dicentrarchus labrax and Dicentrarchus punctatus. They differ fundamentally by the teeth of the vomer, which in D. punctatus has an arrowhead, while in D. labrax they adopt a V shape; while the eye of D. labrax is larger and only juveniles may have a dotted at the top, the eye of D. punctatus is smaller and has characteristic splashes on the flanks and back, it is permanent, even in adults. Another difference is that while D. labrax presents cycloidal scales on the upper part of the head, D. punctatus presents ctenoid scales. D. labrax reaches larger sizes, reaching almost 1 meter in length and weighing more than 10 kg. However, in D. punctatus, specimens weighing more than 1 kg are scarce (Ortega, 2008).
It is a specie of shallow coastal waters that only live grouped when they are young, but that only live alone or in couples when they are adults. They can be found on the rocky coasts and at the rivers mouths and salines, penetrating the estuaries and occasionally reassembling the rivers. It is a very voracious animal and feeds itself of small fishes and invertebrates of all type: squid, prawns, etc. (Ortega, 2008).
Its distribution area extends throughout the Mediterranean (Figure 10), including the Black Sea, and the East Atlantic stretches from the British Isles to the north, reaching as far as Norway and south to Morocco and the Canary Islands, reaching the coast of Senegal (FAO, 2017).
Figure 10 - Distribution of the European seabass. [Source: Fishbase, 2017]
It is a specie with great ecological plasticity, very euryhaline and eurythermal. Thus, they can live in almost sweet waters (salinity of 0.5) and withstand very high salinities, higher than 60. Although these changes are progressive, they have already been shown to be able to withstand abrupt changes of salinity in the order of 8-10. Regarding to temperature, they are capable of withstanding temperatures ranging from 3 to 30 °C. Its reproductive value is between 10 and 15 °C for Atlantic sea bass and 2 °C for Mediterranean seabass (Ortega, 2008; Eroldogan et al.,2003).
Seabass is a very active predator (its name derives from the latin lupus, which means wolf), reason why its feeding is carnivorous. It feeds mainly on other fish and cephalopods, crayfish and less on other crustaceans such as crabs. In short, we can say that it is an opportunistic predator that feeds on everything that finds and that presents the appropriate size. Most of its movements, outside the breeding season, are related to the search for food, approaching coastal and estuarine environments. Below 10-12 °C their feed rate decreases considerably, so in winter they may leave the coastal lagoons returning to the open sea (Ortega, 2008; FAO, 2017).
It is a gonocoric specie that does not present sexual dimorphism. In the Mediterranean males generally reach sexual maturity from the second year of life, when they weigh more than 300-400g, while females do not do so until the third or fourth year of life when they weigh more than 500 -600g. However, in the Atlantic sea bass takes a year or two to reach its first sexual maturation. The seabass matures your gonad synchronously, and has only one posture in the year. The eggs are spherical and have 1 to 3 drops of fat that are fused to one after hatching. The size of the eggs according to the literature is between 1.1 and 1.5 mm in diameter, and the number oscillates around 300 000 eggs/kg of females. The variability in size is because there are differences according to the region; the eggs of Atlantic seabasses are larger in size (ranging from 1.2 to 1.5 mm), while eggs of Mediterranean seabass do not pass 1.2 mm in diameter. It is a fish with a winter stance; the natural time of laying goes from January to March, which may vary depending on the latitude: in
Mediterranean waters, can begin to reproduce if in December while in the Atlantic the posture can extend until May or June (Ortega, 2008; FAO, 2017).
1.4. Aquaculture legislation and licensing in Portugal
Legislation regulating aquaculture activity, especially when it is developed in areas of the public domain (about 90% of establishments) is too dispersed and complex, in particular by the large number of entities involved. This is accompanied by a series of administrative procedures that are too time-consuming and complex to obtain titles for the use and exploitation of water resources, allied until a few years ago, with too short deadlines for water use licenses (10/15 years) (DGRM, 2014).
The complexity of allocating new areas for aquaculture production, coupled with the need to involve various areas of knowledge, to which the economic agent must resort, makes the licensing process too costly and slow, a difficulty which is a barrier to entry. New investors that favour the renewal of the sector. The burden inherent in this difficulty may be reduced by allocating licences for the use of water resources for longer periods (DGRM, 2014). As Joe Healy, president of the Irish Farmers Association, “many of the deficiencies and delays in licensing which has cost the industry millions of euro and hundreds of jobs.”
However, some changes have been occurring since 2008, notably with the publication of Regulatory Decree No. 9/2008, of March 18, which allowed the creation of aquaculture production areas in the open sea. More recently, in the preparation of the Maritime Spatial Planning Plan (MSPP), other open sea areas have been identified that may be regulated for aquaculture purposes (DGRM, 2014).
1.5. Water quality – hydrological parameters
Successful aquaculture depends on providing animals with a satisfactory environment in which to grow. Good initial conditions for aquaculture can be assured by selecting a site with suitable soils and a high-quality water supply. An adequate environment must then be maintained over the culture period so that animals will survive and grow rapidly (Claude et al., 1998).
Water temperature is perhaps the most important variable affecting aquaculture production. Water temperature affects the natural productivity of aquatic ecosystems and directly or indirectly affects all other water quality variables. In aquaculture, it is seldom cost-effective to cool or heat large volumes of water, so the water temperature prevailing at a particular site determines which species can be cultured and the potential growth, health, and reproductive success of that species (Claude et al., 1998).
However, certain processes occur in narrow ranges of temperature, such as reproduction and growth. Out of this range fish are subjected to stressful conditions, which make them susceptible to diseases (manual del participante aquicultura, 2011). The requirement in temperature depends on the species of fish and the stage of development in this one is (egg, larva, post-larva or juvenile). On the other hand, there is an inverse relationship between the maximum amount of oxygen, which
can dissolve in water and temperature. The higher the temperature, the lower the amount of oxygen in the water (Manual del participante aquicultura, 2011).
Salinity refers to the total concentrations of all ions in water. It is not, as some people think,
the concentration of sodium chloride in water. The major ions contributing to salinity are calcium, magnesium, sodium, potassium, bicarbonate, chloride, and sulfate. The absolute and relative concentrations of these ions vary greatly among different waters. Each species of aquatic animal has an optimum range of salinity for reproduction and growth; outside that range, performance is diminished and survival may be poor. Fortunately, the salinity tolerance of most aquaculture species is rather wide and only large differences in salinity or sudden changes are likely to be important. Salinity also interacts with other water quality variables because the ionic strength of a solution affects equilibrium constants for all chemical reactions, and increasing the salt concentration of a solution decreases the solubility of dissolved gases through the "salting-out effect." Of practical importance, as the salinity of water increases, the solubility of dissolved oxygen decreases and the percentage of total ammonia present as toxic un-ionized ammonia decreases (Claude et al., 1998). The pH value expresses the intensity of the acidic or basic character of water. It is defined as the negative logarithm of the hydrogen ion activity which, in fresh water, is essentially equal to the hydrogen ion concentration. The pH scale is usually represented as ranging from 0 to 14, but the pH can extend past those values. Conditions become more acid as pH values decrease and more basic as pH increases. Exposure of aquatic animals to extremes of pH can be stressful or lethal, but the indirect effects of pH and interactions of pH with other variables are usually more important in aquaculture than the direct toxic effects. Important interactions include the effects of pH on certain aqueous equilibria involving ammonia, hydrogen sulphide, chlorine, and metals. The fertility of aquatic ecosystems is also strongly influenced by environmental pH (Claude et al., 1998). Generally, pH values of 6.5 to 9 are most suitable for fish production. Extreme values impair growth and reproduction and can lead to death. The pH values may vary during the day depending on the photosynthetic activity and the concentrations of carbon dioxide in the water.
In addition to the above on pH, it is pertinent to point out that fish can be cultured in intervals of 6.5 to 9, and some can survive at more extreme pH. The changes of this parameter in a body of water are related to the concentration of carbon dioxide during photosynthesis, in such a way that this process determines in part the fluctuation of the pH, and this is how it rises during the day and decreases in the night (Manual de participante de aquicultura, 2011).
The availability of dissolved oxygen frequently limits the activities and growth of aquatic animals. Oxygen is the most important element in water for aquatic organisms, since animals need adequate quantities of this gas to perform the oxidative processes that allow them to obtain energy from the food (Manual de participante de aquicultura, 2011). Water saturated with oxygen contains 20-40 times less oxygen by volume than air and the energetic costs of breathing water are greater than for air because water is much denser and more viscous. The oxygen content in aquatic
with (oxygen is a sparingly soluble gas in water), so small differences in the metabolism of the aquatic community can dramatically change dissolved oxygen concentrations. If dissolved oxygen concentrations are consistently low, aquatic animals will not eat or grow well and will be susceptible to infectious diseases. If concentrations fall to very low levels, the animal may die (Claude et al., 1998).
Ammonia is the principal nitrogenous waste product excreted by crustaceans and most
fishes. Some fish excrete significant quantities of urea, but it is rapidly hydrolysed in the environment to ammonia and carbon dioxide. Ammonia is also produced when nitrogen-containing organic matter decomposes. Accumulation of ammonia in aquaculture systems is undesirable because un-ionized ammonia is toxic to aquatic animals. Ammonia is also a source of combined inorganic nitrogen for plant growth and its availability may influence the productivity of aquatic ecosystems (Claude et al., 1998).
Nitrite (NO
-2) is a naturally occurring intermediate product in two bacteria-mediated
processes involving transformations of nitrogen in water and soils. Nitrite occasionally accumulates in aquaculture systems and can be toxic to aquatic animals. Nitrite is an intermediate in the process of nitrification, which is the two-step oxidation of ammonium to nitrate carried out by highly aerobic, gram-negative, chemoautotrophic bacteria. Nitrite normally does not accumulate in the environment because it usually is converted to nitrate as quickly as it is produced. Under certain conditions, however, the rate of ammonia oxidation can exceed the rate of nitrite oxidation and nitrite will accumulate. Nitrite is also an intermediate in denitrification, which is the biological reduction of nitrate to dinitrogen gas (N2) or nitrous oxide (N2O). Denitrification occurs under anaerobic conditions when
heterotrophic bacteria use nitrate instead of oxygen as a terminal electron acceptor in respiration. Nitrite is an intermediate in the process and may accumulate in anaerobic soils and bottom muds (Claude et al., 1998).
Turbidity refers to an optical property of water that causes light to be scattered or absorbed
rather than transmitted through the water in a straight line. Turbidity is caused by suspended material (such as soil particles, plankton, and organic detritus) and soluble coloured organic compounds. Turbidity caused by plankton generally is desirable in fish ponds. The relatively still, unmixed water in many aquaculture ponds favors sedimentation of solids, and suspended solids seldom exceed 100 or 200 mg/L for more than a few days. Even though turbidity caused by suspended soil particles will seldom have immediate direct effects on fish in ponds, in the long run it may harm fish populations. Clay turbidity will restrict light penetration, adversely affecting plant growth, and some of the particles will settle to the bottom and smother fish eggs and destroy benthic communities (Claude et al., 1998).
Chlorophylls, which are the primary photosynthetic pigments in phytoplankton, absorb light
strongly in the blue and red wavelengths. Photosynthesis requires light and chlorophyll to convert carbon dioxide and water to sugar (carbohydrates), oxygen, and water. Chlorophyll allows photosynthesis. Plants use the sun energy stored in the carbohydrates through respiration. The
respiration process employs carbohydrates and oxygen to produce carbon dioxide, water, and energy. Plants take advantage of this energy for growth and reproduction (Parker, 2012). The minimum light requirement for net phytoplankton growth varies from less than 5 to over 20 µE/m2/s, and depends on species, nutrient status, water temperature, and other factors. Models of phytoplankton growth can be used to estimate standing crops corresponding to maximum net primary production, but such estimates can vary widely depending on the expressions used to estimate gross photosynthesis and respiration. Results of simple empirical and mechanistic models under various simulation conditions indicate that values of 50-250 µg/L chlorophyll a appear to be reasonable approximations of the range of phytoplankton biomass over which net primary production is maximized. That range of values compares to values of 60-150 µg/L chlorophyll a cited by Boyd (1990) as typical of productive fertilized fish and shrimp ponds (Claude et al., 1998). Parker (2012) also confirms that unfertile ponds range up to 20 micrograms per liter (µg/l), and fertile ponds with rich phytoplankton blooms range from 20 to 150 µg/l.
Short-term changes in phytoplankton community organization in eutrophic ecosystems typically involve a fairly rapid (days to weeks) transition from a diverse community of moderate standing crop to a less diverse community of high standing crop. The resulting community, which is often dominated by only a few species, is, by nature, unstable because changes in the standing crop of those few dominant species dramatically affect overall phytoplankton community standing crop. Quite often the dominant phytoplankton in high-biomass communities are certain species of scum-forming blue-green algae (cyanobacteria) that are subject to sudden "die-offs" or "bloom collapses." In extreme instances, the entire phytoplankton population dies over a period of a day or two, and the combination of reduced photosynthesis and rapid decomposition of the dead algal cells may deplete the water of dissolved oxygen and cause fish kills. (Claude et al., 1998; Paerl et al., 1995).
Light, through its role in photosynthesis, is obviously an important factor affecting phytoplankton growth. The light energy needed for plant growth is commonly expressed as the intensity of light in the wavelengths that promote photosynthesis (generally considered to be in the range 400-700 nm). This is called photosynthetically active radiation, or PAR. The photosynthetic apparatus of phytoplankton is adapted to underwater conditions where light intensity is much lower than terrestrial conditions and, consequently, phytoplankton photosynthesis can be inhibited when light intensity is high. Phytoplankton photosynthesis may be partially inhibited when PAR exceeds 200-800 µE/m2/s and may become totally inhibited when PAR exceeds 1400 µE/m2/s (Claude et al.,
1998; Aguirre-von-Wobeser et al., 2000).
Biochemical oxygen demand (BOD) is a standard test for organic material. This test is
determined by measuring the dissolved oxygen in a freshly collected sample and comparing it to the dissolved oxygen level in a sample collected at the same time, but incubated at 20 °C for five days. The difference between the two oxygen levels is the BOD. On a per-hour basis, 0,5 mg/l would be
Dissolved ionic substances can be measured by electrical conductance. On laboratory reports, this may be shown as specific conductivity. Conductivities in natural surface water measure from 50 to 1500 microohms per cm (Parker, 2012).
Table 1 - Impact of hydrological parameters on aquaculture productivity.
Parameter Impact on Aquaculture Productivity
Temperature
• Certain processes occur in narrow ranges of temperature, such as reproduction and growth.
• Out of the optimum range fish are subjected to stressful conditions, which make them susceptible to diseases.
• The requirement in temperature depends on the species of fish and the stage of development in this one is (egg, larva, post-larva or juvenile). • There is an inverse relationship between the maximum amount of oxygen,
the higher the temperature, the lower the amount.
Salinity
• Outside the optimum range for reproduction and growth, performance is diminished and survival may be poor.
• As the salinity of water increases, the solubility of dissolved oxygen decreases and the percentage of total ammonia present as toxic un-ionized ammonia decreases.
pH
• Exposure of aquatic animals to extremes of pH can be stressful or lethal, but the indirect effects of pH and interactions of pH with other variables are usually more important in aquaculture than the direct toxic effects.
• Extreme values impair growth and reproduction and can lead to death. • The pH values may vary during the day depending on the photosynthetic
activity and the concentrations of carbon dioxide in the water.
Dissolved oxygen
• Limits the activities and growth of aquatic animals.
• If dissolved oxygen concentrations are consistently low, aquatic animals will not eat or grow well and will be susceptible to infectious diseases. • If concentrations fall to very low levels, can lead to death.
Ammonia • Accumulation of ammonia is undesirable because un-ionized ammonia is
toxic to aquatic animals.
Nitrite (NO2-)
• Occasionally accumulates in aquaculture systems and can be toxic to aquatic animals.
Parameter Impact on Aquaculture Productivity
Turbidity
• Caused by plankton generally is desirable in fish ponds.
• Caused by suspended soil particles will seldom have immediate direct effects on fish in ponds, in the long run it may harm fish populations. • Clay turbidity will restrict light penetration, adversely affecting plant growth. • Some of the particles will settle to the bottom and smother fish eggs and
destroy benthic communities.
Chlorophyll
• Chlorophyll allows photosynthesis, releasing oxygen into the water during day.
• At night consumes de oxygen leading to a drop level of oxygen in the tank.
Blue-green algae (cyanobacteria)
• Sudden "die-offs" or "bloom collapses." In extreme instances, the entire phytoplankton population dies over a period of a day or two.
• The combination of reduced photosynthesis and rapid decomposition of the dead algal cells may deplete the water of dissolved oxygen and cause fish kills.
Photosynthetically Active Radiation
(PAR)
• Is an important factor affecting phytoplankton growth.
• Phytoplankton photosynthesis can be inhibited when light intensity is high, because the photosynthetic apparatus of phytoplankton is adapted to underwater conditions where light intensity is much lower than terrestrial conditions.
Biochemical Oxygen Demand
(BOD)
• Used to assess the organic pollution in water systems.
Conductivity
• Low conductivity values may indicate high primary production, evidence of high food availability for fish or even when intense local eutrophication occurs.
• Is directly associated with salinization of the body of water in which low values of conductivity indicate low salinity.
1.6. Growth Rates
In the grow-out phase of an aquaculture, frequent sampling and calibration is performed to optimize fish growth (Diniz, 1998). Growth is directly related to environmental factors, such as temperature, salinity, dissolved oxygen, etc., and with food.
If the abiotic conditions are not suitable for the cultivated species, the animals will not grow as expected, there is a delay in their growth, as if it is fed incorrectly, with inadequate feed, their nutrition will not meet their needs changes in their normal growth. Thus, it is very important to evaluate the growth, since it indicates if the fish cultured is healthy or sick and if the food administered
A very important aspect in the production process is the adequate dosage of feed, which is calculated as a function of biomass and water temperature, in order to optimize growth rates.
Food Conversion Ratio (FCR) is defined as the ratio of body weight gain (g) per dry feed consumed (g), corresponds to the dry weight/wet weight produced, varying between 1.3 and 1.8 in optimal conditions for gilt-head seabream (Batista, 2008), and between 1.2 and 2.5 for sea bass (Ercan, et al., 2015).
The Specific Growth Ratio (SGR) is important in estimating and predicting the weight gain over a given period of time, under a defined temperature and conditions. This is the instantaneous growth rate calculated by logarithms of body weight (Houlihan, et al., 2001), corresponding to body weight variation over time (%).
The Daily Growth Index (DGI) is relatively similar to SGR, however, it assumes that the growth is proportional to the body mass in two thirds, allowing a better comparison between the growth rate of different groups, varying little independently of the weight (Guillaume, et al., 1999).
Fulton Condition Index (K) is based on the weight-length relationship, is an indicator of the fish's physiological condition and was determined by the ratio (Cunha, et al., 2016).
1.7. New technologies in aquaculture
For the last three decades, computer vision technology is now a common sophisticated inspection technology. Advances in hardware have resulted in cameras and peripheral equipment with higher sensitivity and faster capabilities that are less expensive, and simpler to use and incorporate into control systems. Advances in image processing and classification methods have enabled the rapid extraction of fine details from images and more accurate data interpretation for control decisions. As a result, computer vision technologies are being used by almost all industries for a variety of inspection tasks. However, these technologies are still not widely used in aquaculture (Zion, 2012).
Application of computer vision technologies in aquaculture is complicated, the inspected subjects are sensitive, susceptible to stress and free to move in an environment in which lighting, visibility and stability are not controllable in most cases. The equipment must operate underwater or in a wet environment and is expected to be inexpensive (Zion, 2012). But these technologies are also important for all production systems: counting, size measurement and mass estimation, gender detection and quality inspection, species and stock identification, and the monitoring of welfare and behaviour. A few publications of work conducted in the context of fisheries, ecology or the postharvest industry are also described, in cases in which the inspection task is similar in these fields or where an image-processing algorithm or method could also be useful in aquaculture (Zion, 2012). Other studies were conducted using all types of sensors, for example, DeCew et al. (2013) used acoustic sensors for field measurements of cage deformation, Simbeye et al. (2014) designed and implemented a wireless sensor network for tracking and control aquaculture based on virtual instruments and Zhuiykov (2011) did a solid-state sensors for on-line monitoring of such water quality
parameters as pH, dissolved oxygen (DO), conductivity, turbidity, dissolved organic carbon (DOC) and dissolved metal ions. Other use of technologies is for traceability where Parreño-Marchante et al. (2013) presents a novel traceability system architecture based on web services, which are used to integrate traceability data captured through Radio Frequency Identification (RFID) systems with environmental data collected with Wireless Sensor Networks (WSN) infrastructure. The solution, suitable to be deployed in Small to Medium Enterprises (SMEs), is provided by integrating information collected along the entire food supply chain, tracking the products from the farm to the consumer. On this project is going to be used a probe connected to sensors that will transmit to Fog computing which is a hybrid solution with local intelligence and cloud processing capability, applicable in inshore and offshore realities and locations with poor connectivity. So, the Fog Computing expands the Cloud Computing paradigm to the network frontier.
1.8. Aquatropolis project
This dissertation is part of the Aquatropolis project funding by COMPETE 2020, which is the new consortium that was created to promote the sustainable development of aquaculture. The consortium is formed by Compta, ALGAplus, Domatica, Polytechnic Institute of Tomar, Tagus Valley and the Polytechnic Institute of Leiria. The focus of the Aquatropolis project is to use of technology and industry 4.0 at the service of aquaculture. One of the main objectives of the project is to promote the democratization of state-of-the-art technologies in the sector, allowing most of the Iberian business community in aquaculture to have the technological resources to optimize operations, reduce risks and uncertainties affecting the productive process, and in that way ensuring more income for producers, quality and food safety for the final consumer.
Figure 11 –Aquatropolis logo and with the respective cofinanciers.
model and finally technological innovation applied to precision instrumentation, guaranteeing scales that allow the introduction of leading-edge technologies in entrepreneurial initiatives with low investment capacity or emerging sustainable production models, such as multi-trophic aquaculture. Besides the high market potential, “Aquatropolis” will contribute to promote the productive efficiency, food quality and safety, better information for the consumer and, above all, the control of aquaculture activities in the maritime space, assuring the balance between social, economic and environmental perspectives.
The Aquatropolis framework born to empower the aquacultures with technological advances and predictive capacities to allow the intelligent control of the whole productive cycle, increased the efficiency of the production process and the effective use of resources.
Objectives: This dissertation aims to compile the most important licensing and legislation
serving as a support tool to the fish farmer, the construction of production models to apply in electronic platforms designed to support producers in their daily activities and validation of growth protocols for Sparus aurata and Dicentrarchus labrax with intensive monitoring of water quality parameters using “fog” computing systems.
2. Material and Methods
The methodological approach of the present study was structured on 3 tasks: (1) systematization of the aquaculture licensing process and review of the Portuguese legislation; (2) description of the production models applied on the main species produced in Portugal and (3) experimental validation of growth protocols. All the data obtained on the present study will be used by the Aquatropolis consortium for the definition of the technological solution.
2.1. Licensing and legislation
For the accomplishment of this task it was necessary an intensive research of legislation and licensing about the sector.
From the research on the legislation and licensing of the sector a table with the important legislation and referring to the aquaculture sector was constructed, providing a greater facility of consultation by the producer.
2.2. Production Models
For the accomplishment of this work it was necessary an intensive bibliographical research. With this burden of information and with the aim of clarifying and understanding some issues, a questionnaire was applied to fish farming’s with semi-intensive regime.
This questionnaire (Annex I) was then applied in several aquacultures throughout the country, aiming to have a perspective of the sector under study at the national level.
With all the information collected it was then possible to build a production model to each species (gilt-head bream and seabass).
2.3. Validation of growth protocols
For the accomplishment of this work it was necessary an intensive bibliographical research about the hydrological parameters about the species under study.
2.3.1. Hydrological parameters
With the questionnaire (Annex I) complete and then made in some aquaculture companies, it was realized that only a few parameters were important to make their measurement, therefore only those were considered.
Table 2 - Hydrological parameters for adults of gilt-head bream and seabass.
Hydrological Parameter Sparus aurata & Dicentrarchus labrax (Adult) Minimum Optimum Maximum Dissolved oxygen
(saturation) 80% 90% 100%
Dissolved oxygen 5 mg/L 6 mg/L Saturation
pH 7.5 7.7 – 7.8 8.5
Temperature 10 °C 20 - 22 °C 32 °C
Salinity 30 35 - 37 40
2.3.2. Sampling
Three trials were carried out with a duration of one month each in August, September and October. At the beginning and end of each trial all the individuals were measured and weighed in a precision scale (Adam PGL 3002), these measurements were made with the objective of each measurement terms the calculation of the biomass of the tank. Prior to sampling the specimens were anesthetized with 2 – phenoxietanol (VWR) (0.5 ml/L).
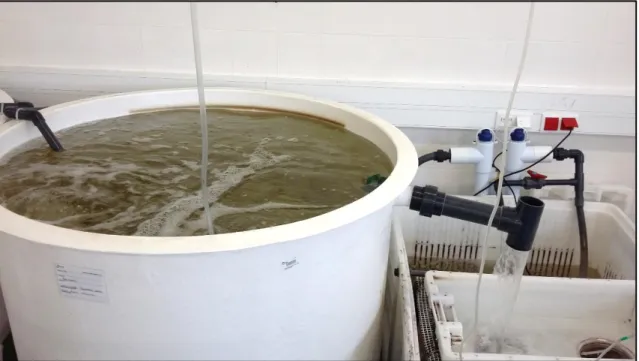
2.3.3. System and Feeding
The food given was Standard Orange 4 provided by the feed company Sorgal- Sociedade de Óleos e Rações S.A.
In a recirculating system with 1600 L (Figure 12), consisting of 1 tank (with a sump, UV, recirculation pump, bag filters (200 μm and bio-balls) with 32 individuals (7 Dicentrarchus labrax and 25 Sparus aurata), on the first two trails the parameters (Table 2) were measured with the assistance of a YSI Professional Series probe (Figure 13) half hour prior to feeding, during feeding and half an hour after feeding.
Figure 12 - Experimental tank.
Figure 13 - YSI Professional Series probe.
On the first trial, the food was given two times a day and following a feeding chart (Figure 14). The feeding chart allows us to calculate the daily feed dose, relating mean weight to water temperature.
Figure 14 - Feeding chart supplied by the company Sorgal- Sociedade de Óleos e Rações S.A. for Sparus
aurata.
On the second trial, the food was given three times a day and given until the fish were satiated.
On the third trial, the amount of food given in the first two trials was calculated and the cost of feed was calculated, also taking into account the growth indexes, the best feeding method (satiety or feeding chart) was chosen.
The method chosen was the feeding chart and in this test the parameters were measured with the Hydrolab DS5 Water Quality Multiprobe (Figure 15) that measured the parameters second to second for the "fog".


![Figure 5 - Aquaculture production by type of water and regime (2014). [Adapted from INE, 2016].](https://thumb-eu.123doks.com/thumbv2/123dok_br/18368985.891567/26.892.251.700.127.429/figure-aquaculture-production-type-water-regime-adapted-ine.webp)
![Figure 7 - Sparus aurata. [Source: Fishbase, 2017]](https://thumb-eu.123doks.com/thumbv2/123dok_br/18368985.891567/28.892.195.699.149.452/figure-sparus-aurata-source-fishbase.webp)
![Figure 9 - Dicentrarchus labrax. [Source: Fishbase, 2017]](https://thumb-eu.123doks.com/thumbv2/123dok_br/18368985.891567/30.892.230.663.237.559/figure-dicentrarchus-labrax-source-fishbase.webp)
![Figure 10 - Distribution of the European seabass. [Source: Fishbase, 2017]](https://thumb-eu.123doks.com/thumbv2/123dok_br/18368985.891567/31.892.169.724.121.373/figure-distribution-european-seabass-source-fishbase.webp)