Article
*e-mail: [email protected]
Phosphorus and Nitrogen in Waters of the Ocoí River Sub-basin, Itaipu Reservoir Tributary
Gilmar S. da Silva,*,a Gilberto S. da Silva,b Eliane R. de Sousa,c Cristiane Konrad,c
Carla C. Bem,c Janaína Paulic and Adilson Pereirac
a Instituto Federal de Educação, Ciência e Tecnologia do Maranhão, Departamento Acadêmico de Química,
65025-000 São Luís-MA, Brazil
bInstituto Federal de Educação, Ciência e Tecnologia Goiano, CP. 92, 75650-00 Morrinhos-GO, Brazil
cUniversidade Tecnológica Federal do Paraná, 85884-000 Medianeira-PR, Brazil
Através da distribuição espacial-temporal das espécies do nitrogênio e do fósforo total na Sub-bacia do Rio Ocoí, tributário do Reservatório de Itaipu, este trabalho avaliou o impacto ambiental nas águas supericiais. Após as chuvas, as fontes difusas predominam, onde o fósforo total e nitrogênio são mais altos. Para o fósforo, os estados tróicos variaram de ultraoligotróico a mesotróico. As concentrações atendem à legislação nacional, tanto para águas supericiais quanto potável. Todavia, o nitrogênio total apresenta-se acima dos valores basais, e o nitrito, 0.06 mg L-1 NO
2
--N, icou acima do recomendado para proteção da vida aquática, segundo a
Canadian Water Quality Guidelines. O controle das fontes difusas e pontuais é recomendado para minimizar o impacto dos poluentes, ampliando a capacidade de suporte das águas, reduzindo o seu aporte para o Reservatório de Itaipu.
Starting from spatial-temporal distribution of nitrogen and phosphorus species in Ocoí river Sub-basin, Itaipu’s tributary, this work evaluated the environmental impact in surface waters. After rain, non-point sources are predominant, presenting higher levels of total phosphorus and nitrogen. In the case of phosphorus, trophic states varied from ultraoligotrophic to mesotrophic. Even though Brazilian legislation is obeyed for surface and drinking water, total nitrogen showed values above background levels, and nitrite concentration, 0.06 mg L-1 NO
2
--N, lies above the recommended
value meant to protect aquatic life, according to the Canadian Water Quality Guidelines. Non-point and point sources control is advisable to minimize environmental phosphorus and nitrogen species impact, increasing the water support capacity and minimizing its discharge into Itaipu Reservoir.
Keyword: Ocoí River, Itaipu Reservoir, phosphorus and nitrogen, principal component
analysis, trophic index
Introduction
Nitrogen and phosphorus species in aquatic systems are known pollutants,1,2 but not less important since
they are strongly linked with the lifestyle of our society. The European Community, for instance, established a directive that limits phosphorus emission varying from 1 to 2 mg L-1 P and nitrogen emission from 10 to 15 mg L-1 N for
wastewater treatment located in risky areas.3 Recent studies
have discussed the ecotoxicological aspects of NH3 such as water quality index for aquatic life protection, developed by Silva and Jardim.4
Nitrogen and phosphorus come from urban-industrial and rural activities such as agriculture and livestock.5,6,7
Runoff is the principal transportation means responsible
for the discharge into rivers, lakes and reservoirs of great quantities of pollutants. Continuous and reversible reactions along terrestrial and aquatic compartments permit that nitrogen take different toxic forms that affect human and aquatic biota, as nitrite, toxic for aquatic life.1 Together with
phosphorus, both are responsible for nutrient enrichment of aquatic systems, and its negative consequences like eutrophication.8-11 Eutrophication is a process that leads
lakes, rivers and reservoirs to impairment, since excessive biomass production can result in alga bloom7 and other
negative effects, for instance, a cyanobacterium bloom12
being responsible for lethal toxins and proliferation of Piesteria piscicida, which is a dinolagellate organism that produces toxins capable of damaging ishes and human beings health.13
agricultural, pig and poultry farms and urban-industrial activities. The environmental water quality of the Ocoí River has its importance increased by the fact that the Ocoí River is tributary of the Itaipu Reservoir. In order to carry out this work, several ield campaigns took place during dry periods and after rainfalls, aiming at assessing nitrogen and phosphorus species and its environmental impact through their spatial-temporal distribution. In this direction, tools as multi variable analysis14,15 and the trophic
status16-18 were used.
Experimental
Study area
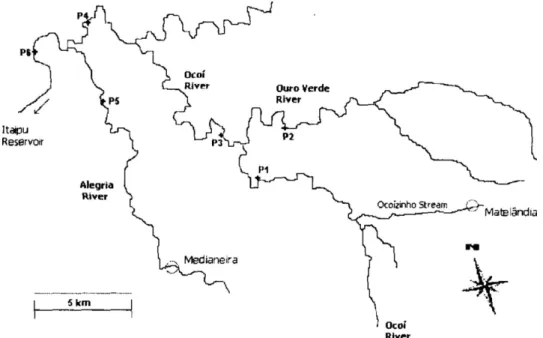
The study area is the Ocoí River Sub-basin (Figure 1), which discharges into the Itaipu Reservoir, and into two of its tributaries, the Alegria River and the Ouro Verde River. These rivers belong to class 2 according to the Conama Directive 357/0519 (Brazilian National Council for the
Environment). The Ocoí River Sub-basin is characterized by pig and chicken industrial processes; agriculture, especially soy bean and corn, in which a large quantity of synthetic fertilizer and manure from pig and poultry is applied, following that treated and non-treated municipal wastewater from the cities of Medianeira and Matelândia is discharged into the rivers. Most of the riparian forest area does not obey legal speciication,20 such as the 30 meters
of forest for rivers with less than 10 meters of width, fact that contributes to the pollutants transportation along the drainage area by runoff. The Ocoí River Sub-basin soils
are classiied as Red Latosol, where degradation of natural vegetation covering takes place, increasing the soil’s susceptibility to erosion and creating favorable conditions to carry large loads of sediment.5
The study area has subtropical climate with high humidity, hot summers characterized by rainfall accumulation and winter with an average temperature below 18 °C, without a deined dry period. The cities of Medianeira and Matelândia have about 40,000 and 14,000 inhabitants, respectively. In these municipalities, approximately 8% of the wastewater is treated, while the rest, more than 90%, is discharged into septic or rudimentary tanks21 or directly into the rivers.
Collecting samples
Water samples were collected in six different points, along the three different rivers (Figure 1). The P.1 point is placed in the Ocoí River (S 25° 14´ 24”; W 54° 05´ 21”), being the one nearest to its headwater. Upstream this point is located one of the Ocoí River’s tributaries, the Ocoizinho Stream that receives treated and non-treated wastewater from the city of Matelândia. The P.2 point is located in the Ouro Verde River (S 25° 12´ 47”; W 54° 06´ 28”), another Ocoí River’s tributary, which is characterized by typical activities described above, except, recently, for urban-industrial wastewater. The P.3 point is located in the Ocoí River (S 25° 13´ 10”; W 54° 06´ 28”), downstream the Ouro Verde River. The P.4 point is located in the Ocoí River (S 25° 11´ 08”; W 54° 10´ 42”), upstream the Alegria River mouth. The P.5 point is placed in the Alegria River
(S 25° 12´ 59”; W 54° 10´ 00”), whose waters cross the Medianeira city. At this point, industrial and treated and nontreated municipal wastewaters are discharged into the Alegria River. Finally, the P.6 point is the last point in the Ocoí River and is located close to its mouth that lows directly into the Itaipu Reservoir (S 25° 11´ 40”; W 54° 12´ 12”).Samples were collected on the water surface, conserved according to NBR 9898 Protocol22 and sent to
UTFPR laboratory for following analysis. In total, six ield campaigns were carried out between 2005 and 2006.
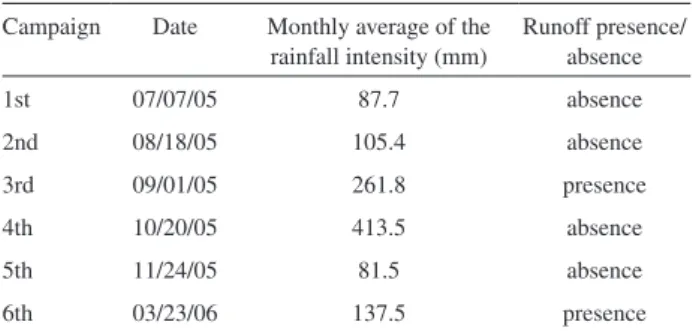
Table 1 presents dates and runoff conditions during water sampling. Samples with the largest monthly average of rainfall intensity are the 3rd and 4th Campaigns, but only along the 3rd and 6th Campaigns the water samples were collected immediately after the end of the rainfall event, still under inluence of surface runoff. Runoff presence is of paramount importance because is responsible for pollutants transportation from the drainage area, and is one kind of non-point source. The 2nd Campaign was carried out after one dry month and possibly was better to represent the Ocoí River Sub-basin behavior without non-point sources in dry period, without runoff.
Analysis
Water samples were analyzed according to APHA.23
Nitrate (NO3-), nitrite (NO 2
-), ammonium (NH 3)
and Total Phosphorus (TP) were measured using UV-Vis spectrophotometer (Fentom, Plus model). The concentrations of NO3- and NO
2
- were expressed as
nitrogen, mg L-1 NO 3
--N and mg L-1 NO 2
--N, respectively.
Ammonium (NH3) was expressed as nitrogen, mg L-1
NH3-N. The total Kjeldahl nitrogen is the combination of organically bound nitrogen and NH3. The combination of the organic nitrogen and the inorganic nitrogen (NH3, NO3-,
NO2-) corresponds to the total nitrogen. TP concentration
was expressed in mg L-1 P.
The following parameters were also determined: pH, turbidity, conductivity, ion sodium (Na+) and ion chloride
(Cl–). The sodium (Na+) concentration was measured by
spectrometry of atomic emission using a lame photometer (CELM, model FC-180). The chloride concentration was determined by Mohr method. Each water sample was measured in triplicate and the coeficients of variation are, on average, 8% for NO3- and NO
2
-, 12% for TP, 5% for NH 3
and 6% for Cl–.
Statistical analysis
Principal Component Analysis (PCA)14,24 was applied
to evaluate the similarity of water samples considering the value of the measured variable. PCA creates a graph of scores that permits to check the relationship using the Euclidean distance, where the new axes, that are orthogonal to each other, correspond to the principal component (PC). Besides a graph of scores, PCA provides a loading graph able to determine the extent of a variable that contributes to each PC axis. PCA was applied to the matrix composed of 6 sampling points (P.1 to P.6) in 5 different campaigns (2nd to 6th), and 6 variables (NH3, TP, conductivity, Na+,
Cl– and pH), which were previously centered on average
due to different orders of magnitude. The matrix submitted to PCA corresponds to 30 water samples (columns) and six variables (lines).
Trophic status index (TSI)
In order to evaluate the trophic status of the water body, an index created by Carlson,16,17 and recently adapted for the
rivers of the State of São Paulo by Lamparelli,18 was applied.
This index can be applied using TP and Chlorophyll a, but this work we used the former parameter, known as the trophic status index based on TP (TSIp),25 according to
equation 1. TSIp acts as the potential capacity of the aquatic systems to produce biomass in excess, while Chlorophyll a is an effective measure of that biomass.8
TSIp = 10(6 – (1.77 – 0.42 lnTP/ln2)) (1)
where TP = total phosphorus concentration, in μg L-1 P.
Results and Discussion
Total phosphorus (TP) behavior
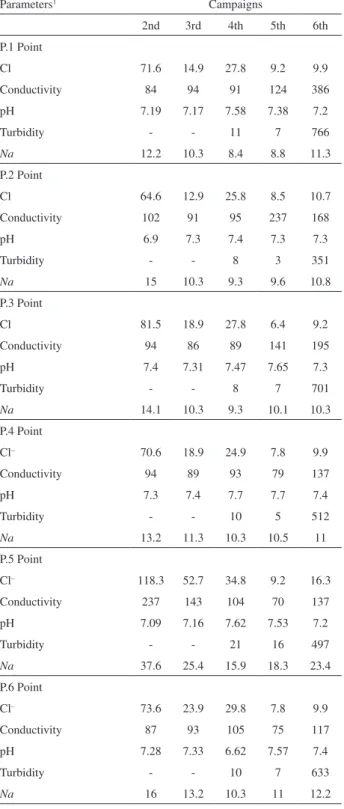
Table 2 shows Cl–, conductivity, pH, turbidity and Na+
values of water samples from the last 5 campaigns. In the 1st Campaign, only the TP concentration and NH3 were determined. TP and NH3 were shown separately from Table 5 in order to emphasize spatial temporal distribution Table 1. The weather conditions during the water sampling
Campaign Date Monthly average of the rainfall intensity (mm)
Runoff presence/ absence
1st 07/07/05 87.7 absence
2nd 08/18/05 105.4 absence
3rd 09/01/05 261.8 presence
4th 10/20/05 413.5 absence
5th 11/24/05 81.5 absence
6th 03/23/06 137.5 presence
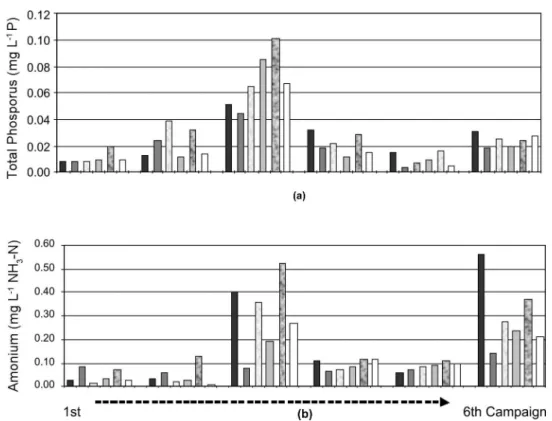
in the Ocoí River waters. In Figure 2 it is possible to observe the temporal-spatial distribution of TP in waters of the Ocoí River.
In Figure 2 results of the TP concentration for the P.1, P.3, P.4 and P.6 points, that belong to Ocoí River, show values below the limit-values established by the Conama Directive 357/05,19 0.05 mg L-1 P, except for the
3rd Campaign, when all points had its TP concentrations exceeding the limit-value. In addition, during the 3rd campaign, P.5 point, located in the Alegria River, showed the TP concentration of 0.11 mg L-1 P, close to the
limit-value required by legislation, 0.10 mg L-1 P. The reason for
the high TP values observed in the 3rd campaign can be attributed to rainfall few hours before water sampling, when runoff still was present, suggesting a signiicant presence of phosphorus input from non-point sources. One kind of non-point source is surface waters that drain the Ocoí River Sub-basin. They can load different phosphorus species, especially phosphorus adsorbed on mineral particles. The soil of the area is rich in clay minerals and oxides like gibbsite and goethite, known for their capacity of adsorbing phosphate.26, 27
The P.5 point shows high TP concentration compared with the other sampling points during rain or dry periods. During the dry period, urban-industrial wastewater from the Medianeira city predominates and, during the rainfall, there is likely the contribution of unidentiied non-point sources too. It is important to emphasize that all points in the Ocoí River, P.1, P.3, P.4 and P.6, independently of the season, show a relatively similar TP value. In addition, if the only source of phosphorus was runoff, in the dry period and under absence of point source, the TP concentration values should be very small compared with dry period with point source, for instance, Alegria River (P.5 point) in the 2nd campaign. This behavior did not occur. As it can be seen, the P.3 point during 2nd campaign shows 0.038 mg L-1 P,
higher than P.5 point, which was 0.031 mg L-1 P. The same
occurs between the points P.1 and P.5 in the 4th campaign. The results suggest that there should be a non-point source acting independently of runoff. In this direction, it is important to mention that the Ocoízinho Stream is a non-point source that provides TP during the entire year. Finally, in order to understand why the P.3 point, in the Ocoí River, showed TP concentration higher than the P.5 point, although it did not rain during the 2nd Campaign, it is necessary to consider non-point sources that act independently of rainfall and, therefore, runoff. Those non-point sources may be an animal waste discharge from farms, which exist in a large number along the banks.10
Trophic status index
In order to evaluate the trophic status of the Ocoí River and its tributaries, Alegria and Ouro Verde rivers, Table 2. Chemical and physical-chemical parameters measured in the
Ocoí River Sub-basin
Parameters1 Campaigns
2nd 3rd 4th 5th 6th
P.1 Point
Cl 71.6 14.9 27.8 9.2 9.9
Conductivity 84 94 91 124 386
pH 7.19 7.17 7.58 7.38 7.2
Turbidity - - 11 7 766
Na 12.2 10.3 8.4 8.8 11.3
P.2 Point
Cl 64.6 12.9 25.8 8.5 10.7
Conductivity 102 91 95 237 168
pH 6.9 7.3 7.4 7.3 7.3
Turbidity - - 8 3 351
Na 15 10.3 9.3 9.6 10.8
P.3 Point
Cl 81.5 18.9 27.8 6.4 9.2
Conductivity 94 86 89 141 195
pH 7.4 7.31 7.47 7.65 7.3
Turbidity - - 8 7 701
Na 14.1 10.3 9.3 10.1 10.3
P.4 Point
Cl– 70.6 18.9 24.9 7.8 9.9
Conductivity 94 89 93 79 137
pH 7.3 7.4 7.7 7.7 7.4
Turbidity - - 10 5 512
Na 13.2 11.3 10.3 10.5 11
P.5 Point
Cl– 118.3 52.7 34.8 9.2 16.3
Conductivity 237 143 104 70 137
pH 7.09 7.16 7.62 7.53 7.2
Turbidity - - 21 16 497
Na 37.6 25.4 15.9 18.3 23.4
P.6 Point
Cl– 73.6 23.9 29.8 7.8 9.9
Conductivity 87 93 105 75 117
pH 7.28 7.33 6.62 7.57 7.4
Turbidity - - 10 7 633
Na 16 13.2 10.3 11 12.2
1 Cl, and Na unities are mg L-1. Conductivity is mS cm-1 and turbidity
the trophic status index (TSIp) was applied based on the TP concentration.25 In Table 3, the TSIp results from
six sampling points during all campaigns are presented, which categories varied from ultraligotrophic (TSIp ≤ 47; P ≤ 13 μg L-1 P) to mesotrophic (52 < TSIp
≤ 59; 35 < P ≤ 137 μg L-1 P) classes. In the 3rd Campaign the
TSIp was the most critical, presenting mesotrophic waters, being the P.5 point, the Alegria River, responsible for the highest TSIp, 57.9. The mesotrophic status indicates a water body with intermediate biomass productivity, and still does not represent water impairment in most of situations. In the other campaigns, the trophic status remained between ultraoligotrophic and oligotrophic
(47 < TSIp ≤ 52; 13 < P ≤ 35 μg L-1 P), demonstrating
satisfactory water conditions. It is necessary to emphasize that, in general, the P.5 point in the Alegria River, shows the worst TSIp, and probably because is doubly affected by both non-point and point sources, being the latter from urban-industrial wastewater. Another important point is the P.3, in the 2nd Campaign, whose water was classiied as mesotrophic. The reason for this high TSIp was mentioned above. In general, it is worth to mention that point and non-point polluting sources, independent of the rainfall, which discharge into water bodies when low and water velocity are low, are more favorable for biomass production.9,28,29
Figure 2. The spatial-temporal distribution of the TP and NH3 from P1 to P6 point at Ocoí River Sub-basin. Water samples have inluence of runoff during the 3rd and 6th Campaigns. Legend: P1 (dark column) until P6 (white column).
Table 3. The Trophic Status Index (TSIp) values of the Ocoí River and its tributaries
Point 1st Campaign 2nd Campaign 3rd Campaign 4th Campaign 5th Campaign 6th Campaign
TSIp Class TSIp Class TSIp Class TSIp Class TSIp Class TSIp Class
P1 45.0 Ultra* 47.0 Ultra 54.4 Mesob 52.1 meso 47.7 Oligo 51.7 Oligo
P2 44.7 Ultra 50.5 Oligo 53.8 meso 49.2 Oligo 40.7 Ultra 49.0 Ultra
P3 44.9 Ultra 52.9 meso 55.6 meso 50.0 Oligo 44.6 Oligo 50.7 Ultra
P4 45.4 Ultra 46.3 Oligo 57.0 meso 46.7 Ultra 45.4 Oligo 49.5 Ultra
P5 49.5 Oligoa 51.9 Oligo 57.9 meso 51.4 Oligo 48.5 Oligo 50.5 Oligo
P6 45.5 Ultra 47.6 Oligo 55.8 meso 48.1 Oligo 41.7 Ultra 51.1 Ultra
NH3, NO3- and NO
2- behavior
Due to NH3 ecotoxicity, this substance plays an important role for the aquatic life protection.5 According to the Conama
Directive 375/05,19 the limited values of NH
3 in water bodies
class 2 are 3.7 mg L-1 NH
3-N to pH < 7.5 and 2 mg L -1 NH
3-N
to pH > 7.5. Figure 2 presents the NH3 concentration in the river water. The maximum values did not exceed 0.7 mg L-1 NH
3-N, below the limit-value. On the other hand,
the lowest NH3 concentration was observed in the water samples collected without rainfall, during the 1st, 2nd, 4th and 5th Campaigns, where runoff was no longer present in the Ocoí River Sub-basin. Among the high value observed in the presence of runoff, 3rd and 6th campaigns, the value of P.1 point, the nearest to the Ocoí River’s headwaters, was higher than the ones of other points, except the P.5 point. This result suggests signiicant non-point sources activated by runoff. The transport of NH3 in the soil where pig and poultry manure has been spread out depends on the interval between the application and the irst rains. In general, on the irst days NH3 prevailed. With time, a decrease in the initial NH3 concentration takes place, irstly because of the nitriication process,30 increasing
the NO3- production, and secondly because volatilization
of ammonia to atmosphere. The transport of the nitrogen species has different characteristics. As NO3- is very soluble
in the water and due to its negative charge it is not adsorbed by the mineral particles,31 on the other hand, NH
3 can be
converted into NH4+ in the soil, where positive charge
contribute to its adsorption by the particles.
The P.5 point stands out, presenting higher NH3 concentration than the other points practically in all campaigns, with observed for TP. This behavior agrees with the fact that Alegria River receives both non-point and point sources, what explains not only high NH3 concentration, but the high level of TP as well.
To give initial information about distribution of nitrogen species in these water bodies, in Table 4 are presented different concentrations of them for only the 6th Campaign: NH3, NO3-, NO
2
- and TN.32 The NO 2
- concentration values
varied from 0.024 to 0.240 mg L-1 NO 2
--N, and NO 3
- varied
from 0.099 to 0.167 mg L-1 NO 3
--N. At the P.5 point, the
NO2- concentration was 0.240 mg L-1 NO 2
--N, higher than
NO3-, 0.133 mg L-1 NO 3
--N, corroborating the inluence of
urban-industrial wastewater. Urban-industrial wastewater can discharge a large quantity of NH3 into the rivers, which can be rapidly converted into NO2- and, later, NO
3
-. In a broad aspect,
the NH3 concentration was higher than nitrogen oxidized forms for all points, suggesting recent pollutant discharge.
In order to evaluate nitrogen species impact in aquatic life, it is necessary to regard, besides NH3, the
oxidized nitrogen form, NO2-. High NO 2
- concentration
can cause harmful effects on aquatic life. The Canadian Water Quality Guidelines (CCME, 2001)33 establishes
0.06 mg L-1 NO 2
--N for protection of sensitive living
organism in the water bodies. According to Table 7, the points P.1, P.3 and P.5 showed NO2- concentration above
of the 0.06 mg L-1 NO 2
--N. Since NO 3
- can be reduced to
NO2-, the same guideline recommends maximum interim
value of 13 mg L-1 NO 3
--N.
In addition, the oxidized nitrogen, NO2- and NO 3
-, are
species that deserve rigorous control when the subject is human health. With this direction, NO2- and NO
3
- are limited
by the Conama Directive 357/0519 in 1 mg L-1 NO 2
--N and
10 mg L-1 NO 3
--N, respectively. Those values are the same
required for drink waters according to the Federal Law n°.518/2004 of the Brazilian Health Ministry.34 Therefore,
all water samples obeyed the legislation for drinkable water. The nitrogen species described above, NH3, NO2- and
NO3-, not only are toxic for living beings, but they contribute
to total nitrogen (TN) bulk in the body of water. TN can enrich aquatic ecosystem leading to excessive biomass production. In this case, the bulk of TN in the water body may function as trophic status index in aquatic systems, similar to TP, since both are essential macronutrients. Table 4 shows the TN concentration values, which varied from 2.63 mg L-1 N at the P.1 point (the nearest to Ocoí River’s
headwaters) to 7.5 mg L-1 N at the P.2 point, the Ouro
Verde River. Those values are considered high compared with other aquatic systems, where it is considered a basal level35 of 1 mg L-1 N. If the limited value of TN proposed
by Dodds et al.,36 are adopted for streams in temperate
environment, i.e. 0.7 mg L-1 N for oligotrophic water bodies,
and 1.5 mg L-1 N for eutrophic/mesotrophic limit, the results
showed in Table 4 indicate that the water can be classiied as eutrophic for P.1, P.2, P.4 and P.5 points.
Principal Component Analyses
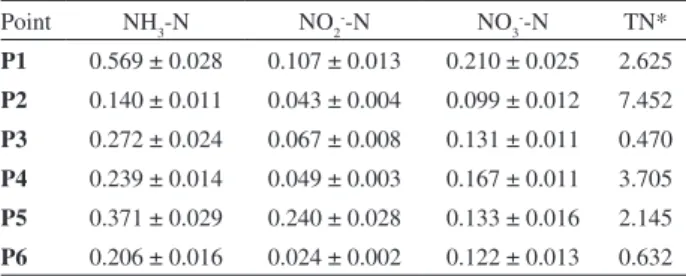
According to the eiginvalues showed in Table 5, PC1 and PC2 account for the total variance, 83.72% and 15.44%, Table 4. The Ocoí River’s nitrogen species. The 6th Campaign was carried out after runoff
Point NH3-N NO2--N NO
3
--N TN*
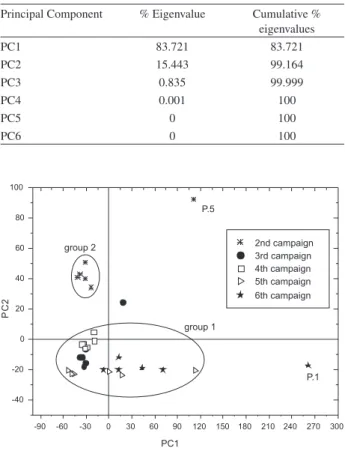
respectively, being 99.16% the cumulative eigenvalues for both components. The PC1 has great inluence on group 1 separation, while PC2 on group 2. In this latter group, the water samples correspond to the 2nd Campaign, which better represents sources independent of rainfall (Figure 3).32 In this group 2, only the P.5 point remained
separated, suggesting a different chemical behavior from the other points, probably because the Alegria River is a receiving water body of the urban-industrial wastewater from Medianeira city. In contrast, the P.5 point in the other campaigns is more similar to other points because urban-industrial wastewaters are no longer so predominant compared to non-point source activated by rainfall event.
As to identify which variable had the highest inluence on PC1 and PC2, loading values were used (Figure 4). According to loadings values, cond. is the almost exclusively variable that contributes to PC1, loading 1, as other parameters were much smaller: Cl– (–1.45 x 10⁻²),
pH (–7.73 x 10⁻⁴), Na+ (1.99 x 10⁻²), PT (–6.68 x 10⁻⁵) and
NH3 (1.32 x 10⁻³). These results can suggest that dissolved
electrolytes from runoff increase conductivity in water bodies. Rainfall and speciic features of each drain area
vary along the river (surface vegetation coverage, soil topography, riparian forest, etc.); therefore, it is expected that different electrolyte loads be discharged into the water bodies, which helps to explain dispersion of group 1. In this scenery, the P.1 point of the 2nd Campaign remained isolated (Figure 4), showing great susceptibility to non-point sources, what may help to explain TP and NH3 high concentrations in the same point.
To PC2, Cl– has a loading of 0.99 and it is almost responsible
by group 2 separation. Other parameters were: Cond. (1.16 × 10⁻²), pH (–2.83 × 10⁻³), Na+ (1.38 × 10⁻¹), PT (1.39 × 10⁻⁴)
and NH3 (–1.54 × 10⁻³). Cl– from non-point source was
not correlated with conductivity, as it can be seen in the loading graph, because they are orthogonal. The highest concentrations of this ion occur during low low, without water contribution from runoff, especially in the 2nd Campaign, where the P.5 point in the Alegria River reached 118.29 mg L-1 Cl–; probably due to the presence of
urban-industrial wastewater. It should be emphasized that all water samples from the 2nd Campaign presented the highest Cl–
concentration, suggesting that non-point and point sources independent of rainfall may act during the dry period, once the Cl– is typically a species from the animal and
urban-industrial wastewater.24 Loadings to Na+, pH, PT and NH 3
are so low, much close to the axis origin, and contribute little to components. However, the absence of signiicant loading implies that there are no predominant PT or NH3 sources in watershed, corroborating the idea that different pollutants’ transportation mechanisms are acting along the ecosystem.
Conclusions
The results point out the presence of phosphorus and nitrogen from non-point and point sources acting in the Ocoí River Sub-basin. Non-point sources are more Table 5. % Eigenvalue and Cumulative % eigenvalues to PCA analyses
of water sample form Ocoí River Sub-basin
Principal Component % Eigenvalue Cumulative % eigenvalues
PC1 83.721 83.721
PC2 15.443 99.164
PC3 0.835 99.999
PC4 0.001 100
PC5 0 100
PC6 0 100
Figure 3. The Score graph for the irst two principal components, PC1 x PC2.
predominant and identiiable after rainfall, due to runoff, and sometimes only the TP exceeds the Conama Directive 357/05 requirements, contrasting with NH3, which remained below the limit-value. In general, phosphorus and ammonium showed the highest concentration under runoff inluence. Phosphorus impact in the water quality, according to modiied Carlson Trophic Index, indicates trophic class varying from oligotrophic to mesotrophic. The latter class occurred in the presence of runoff. Nitrogen species are below the Brazilian law requirements for surface and drinkable water, as well as for aquatic protection life, although the bulk of total nitrogen can be considered high compared to basal level. However, nitrite concentration showed high values regarding the Canadian Water Quality Guidelines, above 0.06 mg L-1 NO
2 --N.
The Analysis of the Principal Component indicates two principal components, PC1 and PC2, which are able to separate two groups of water samples. Chloride (Cl–)
was mainly responsible for separating the water samples that corresponded to the dry period. High Chloride (Cl–)
concentration suggests also the presence of the non-point and point sources independent of runoff. Probably, non-point source independently of runoff can be the reason why during the dry period mesotrophic class was also observed in the Ouro Verde and the Ocoí rivers. The Alegria River is inluenced by both non-point and point sources, being more susceptible in the future due to load increase from growing industrial and domestic activities.
Acknowledgements
The authors thank Fundação Araucária, Fundação Parque Tecnológico de Itaipu (FPTI) and UTFPR/Campus Medianeira for inancial support.
References
1. Koo, B. K.; 0’Connell, P. E.; Sci. Total Environ. 2006, 359, 1. 2. Lewis JR, W. M.; Donald, P. M.; Transactions of the American
Fisheries Society1986, 115, 183.
3. E.E.C. (European Economic Community); Directive 91/271/ EEC, on Urban waste water treatment, 1991. http://eur-lex. europa.eu/pt/index.htm, accessed in July 2008.
4. Silva, G. S. ; Jardim, W. F.; Quim. Nova2006, 29, 689. 5. Hooda, P. S.; Moynagh, M.; Svoboda, L. F.; Thurlow, M.;
Stewart, M.; Thomson, M.; Anderson, H.A.; Sci. Total Environ. 1997, 201, 63.
6. Chapman, A S.; Foster, l. D.; Lees, J. A; Hodgkinson, R. A; Jackson, R. H.; Sci. Total Environ.2001, 66, 95.
7. Kyllmar, K.; Carisson, C.; Gustafson, A; Ulén, B.; Johnsson, H. Agr Ecosyst Environ.2006, 115, 15.
8. Spivakov, B. YA.; Maryutina T. A.; Muntau, H.; Pure Appl. Chem. 1999, 71, 2161.
9. United States Environmental Protection Agency, USEPA;
Nutrient Criteria-Technical Guidance Manual- Rivers and Streams -EPA 822-BOO-002, Washington, DC, 2000, http:// www.epa.gov/waterscience/criteria/nutrient/guidance/rivers/ index.html, accessed in July 2008.
10. United States Environmental Protection Agency (USEPA);
Protocol for Developing Nutrient TMDLs - EPA 841-B-99-007, Washington D.C., 1999, http://www.epa.gov/owow/tmdl/ nutrient/pdf/nutrient.pdf, accessed in July 2008.
11. Bowes, M.J; House, W. A; Hodgkinson, R. A.; Sci. Total Environ. 2003, 313, 199.
12. Falconeri, I. R.; Humpage, A . R.; Int. J. Environ. Res. Public Health2005, 2, 43
13. Burkholder, J. M.; GlasgowJr, H. B.; Limnol. Oceanogr. 1997,
42, 1052.
14. Beebe, K. R.; Pell, R. J.; Seasholtz, M. B.; Chemometrics: A Practical Guide, 1st Ed. Wiley-Interscience:NewYork, 1998. 15. Sousa, E. R.; PhD Thesis, Instituto de Química da Universidade
Estadual de Campinas, Brasil, 2005.
16. Carlson, R. E.; Limnol. Oceanogr. 1997, 22, 361.
17. Toledo Jr., A. P.; Agudo, E. G.; Talarico, M.; Chinez, S. J.; XIX Congresso Interamericano de Engenharia Sanitária Ambiental- AIDIS, Santiago do Chile, Chile, 1984.
18. Lamparelli, M. C.; PhD Thesis, Instituto de Biociências da Universidade de São Paulo, Brasil, 2004.
19. Portaria 365/05, http://www.mma.gov.br/port/conama, accessed in February de 2009.
20. Lei N° 7.803 de 18 de Julho de 1989. Diário Oicial da União. 20/07/1989. http://www.planalto.gov.br/ccivil_03/Leis/L7803. htm, acessed in July 2008
21. http://www.cnm.org.br/infra/, accessed in February 2009. 22. Associação Brasileira de Normas Técnicas, ABNT; NBR 9898:
Preservação e técnicas de amostragem de eluentes líquidos e corpos receptores, Rio de Janeiro, Brasil, 1987.
23. American Public Health Association, APHA; Standard Methods for the Examination of Water and Wastewater. 16. ed., American Water Works Association and Water Pollution Control Federation: Washington, DC, 1985.
24. Sodré, F. F.; Anjos, V. E.; Prestes, E. C.; Grassi, M. T.; J. Environ. Monit. 2005, 7, 581.
25. Companhia de Tecnologia de Saneamento Ambiental, CETESB;
Relatório de Qualidade das Águas Interiores do Estado de São Paulo, São Paulo, Brasil, 2004.
26. Bowes M. J.; House W. A.; Hodgkinson R. A.; Sci. Total Environ. 2003, 313, 199.
28. Mainstone, C. P.; Parr, W.; Sci. Total Environ. 2002, 25, 282. 29. Jarvie, H. P.; Neal, C.; Withers, P. J.; Sc. Total Environ. 2006,
360, 246.
30. Ceretta, C. A. ; Basso, C. J.; Vieira, F. C. B.; Herbes, M. G.; Moreira, l. C. L; Berwanger, A L.; Cienc. Rural 2005, 35, 1296. 31. Jarvie, H. P.; Whitton, B. A; Neal. C.; Sci.Total Environ. 1998,
210/211, 79.
32. Silva, G. S.; Konrad, C.; Pauli, J. ; Silva, G. S.; Sousa, E. R. Abstract of the do XI Seminário de Iniciação Cientíica e Tecnológica, Curitiba, Brasil, 2006.
33. http://www.ccme.ca/ accessed in February 2009.
34. Ministério da Saúde; Portaria n°. 518 de 25 de março de 2004, Brasília DF, 2004. http://portal.saude.gov.br/portal/arquivos/ pdf/portaria_518_2004.pdf, acessed in July 2008
35. United States Geological Survey, USGS; The Quality of Our Nation’s Waters - Nutrients and Pesticides: U.S Geological survey Circular 1999, 1225, 82.
36. Dodds, W. K.; Jones, J. R.; Weich, E. B.; Water Res. 1998, 32, 1455.