ECE Radiometry in the TCABR Tokamak
R. P. da Silva, A. M. M. Fonseca, J. H. Vuolo, E. R. Calderon, R. M. O. Galv˜ao,
Yu. K. Kuznetzov, J. C. Raffaelli
∗, and the TCABR Team
Instituto de F´ısica, Universidade de S˜ao Paulo, 05315-970, S˜ao Paulo, Brazil
Received on 04 February, 2004; revised version received on 10 May, 2004
A millimeter/microwave detection system, in operation in the TCABR Tokamak is described. The system is used for electron cyclotron measurements. The main part of the system is a heterodyne sweeping radiometer based on aBW Ooscillator that operates in the frequency range of 52 to 85GHz. The system operates in two modes : fixed frequency ( maximum resolution of 10µs) and sweeping mode ( 50µsper frequency step ). The radiometer is calibrated in frequency and in radiation intensity. The frequency calibration is made by means of a precision harmonic oscillator. The absolute calibration was done using a blackbody ( microwave absorber ) immersed in liquid nitrogen (77K) and also put in an oven with adjustable temperature up to1470K. Two others components are also used for periodic intensity calibration check and sensibility measurements : a Crio-genic Matched Load and a Noise Source. A Gaussian antenna is used for better space resolution measurements. Between the antenna and the radiometer, oversized waveguides are used to reduced the signal attenuation. The antenna axis is in the equatorial plane of the machine and perpendicular to the plasma column axis. The ac-cessibility and absorption conditions are discussed. Results showing time and radial profiles of the detected
ECE radiation for the TCABR are presented. For a magnetic field ofBT O = 1.14T it was verified that the
maximum permissible density to access the second harmonic in the Xmode is ne0 ∼= 2.3×10¹⁹m−3.
1
Electron Cyclotron Emission
The radiation resulting from the movement of the electrons around the magnetic field lines carries valuable information about the distribution function of the electrons in a plasma and its detection constitutes an important diagnostic method for magnetic confined plasmas [ 1 ]. In tokamak machines, the radial dependence of the magnetic field allows the de-termination, from the ECE radiation, of the electron tempe-rature and also, in some situations, of the electron density [ 2 ].
The first work on the use of the ECE radiation, as a di-agnostic tool, in tokamaks was published in 1974 [ 3 ]. To-day, besides being an obligatory diagnosis technique in to-kamaks for electron temperature measurements, it is in con-tinuous evolution and, more recently, it has been used expe-rimentally with more elaborated purposes, for instance, in the characterization of electron distribution of non-thermal electrons [ 4 ], in the transport studies involving tempera-ture fluctuations [ 5 ] and, in recent proposals, involving Bernstein waves for the determination of electron tempe-rature [ 6 ]. The use of the Bernstein waves seems to be particularly interesting in spherical tokamaks where the ac-cessibility and the absorption conditions are not satisfied for the radiation used in common machines.
For a tokamak of major radius R0 and toroidal field
BT0, the harmonicn of the ECE frequency fn emitted at
radius r, in the equatorial plane, is given by
fn =
n e BT0R0
2π meγ(R0 +r)
,
where eand me are respectively the electron charge and
mass. The relativistic factor γ, for the usual temperatures found in tokamaks like TCABR, can be considered as unity. The transport of the electron cyclotron radiation in a thermal plasma is given by
I(ω) = IB(ω) ( 1− e−τ(ω)),
where I(ω), the intensity of radiation, is the radiative power per unit area per unit solid angle per unit of angular fre-quency, τ(ω) is the optical depth given by
τ(ω) = −
0
L
α(ω)ds ,
α(ω) is the absorption coefficient and IB(ω) is the
Rayleigh-Jeans approximation for the blackbody radiation given byIB(ω) = ω2kTe/8π3c2. For an optically thick
plasma (τ(ω) > 1) substantial absorption occurs and re-sults
I(ω) = IB(ω) =
ω2k T
e
8π3c2 .
Therefore, for a given frequency, the detected radiative power is proportional to the electron temperature.
Rmin 43.5 1.70 47.4 94.9 142.3
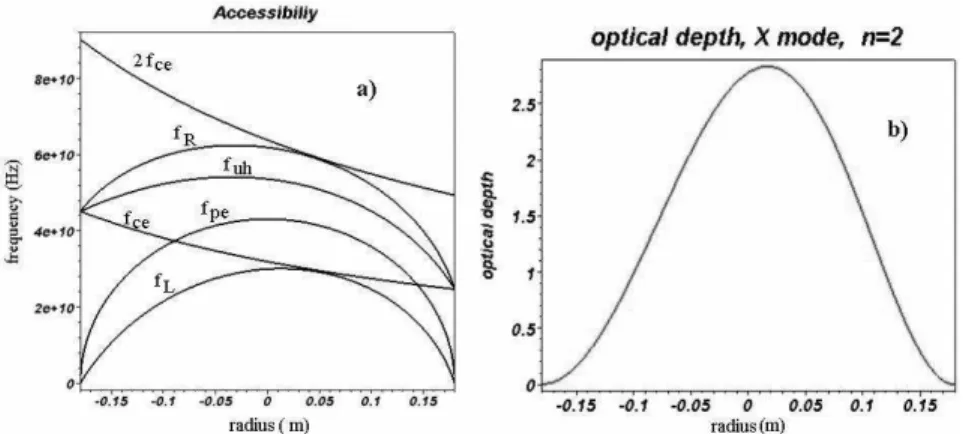
Figure 1. a. Radial profiles of : first (fce) and second (2fce) of the ECE radiation, fR- right-hand cutoff frequency, fuh- upper hybrid
resonance frequency, fL- left-hand cutoff frequency and fpe- electron plasma frequency. B0 = 1.14T,ne0 = 2.3×10 19
m−3
and
Te0 = 500eV. b. Radial profile of the optical depth for the second harmonic extraordinary mode forBT0 = 1.14T,ne0 = 2.3×
1019m−3
andTe0 = 500eV.
2
Electron Cyclotron Emission in the
TCABR
The main parameters of the TCABR [7] are : major ra-diusR0 = 61.5cm; plasma radiusa = 18cm; toroidal
magnetic field ( maximum value )BT0 = 1.2T; electron
densityne = 2.5×10¹⁹m−3 and peak electron
tempe-rature Te0 = 500eV. In the equatorial plane we have
rmin = 43.5cm and rmax = 79.5cm. For these
condi-tions, the frequencies of the first three harmonics of ECE are given in the Table 1.
As it will be discussed below, for the TCABR, the ECE radiation accessibility and absorption conditions indicate that the second harmonic extraordinary wave can be used as a diagnostic tool.
2.1
Accessibility and absorption conditions
The accessibility conditions can be discussed examining the Fig. 1.a. In this figure we see the radial profiles of the fol-lowing frequencies : the first and the second harmonics of
the electron cyclotron frequency
fce =
e R0BT0
2π me(R0 +r)
;
the right and left-hand cutoff frequencies
fR,L =
fce
2 [±1 + ( 1 + 4f2
pe
f2
ce
)12];
the upper-hybrid resonance frequency fuh = (fce2 +
f2
pe)
1
2 and the plasma frequency
fpe =
1 2π(
noe2
ǫome
)12.
To discuss absorption conditions of the plasma, the most important parameter is the optical depth τ(ω). In the Fig. 1.b the optical depth radial profile for the TCABR is shown. For the extraordinary mode (n≥2) and perpendi-cular propagation (θ=π/2) parallel to the equatorial plane of the torusτ(ω)is given by [ 8 ] :
⌋
τn(X) = τ( X)
n (θ=
π
2) =
π2n2(n−1) 2n−1(n−1)!(
fpe
fce
)2(νt
c)
2(n−1)µ(X)
n (θ=
π
2) (
R0
Figure 2. Block diagram of the TCABR heterodyne radiometer for the detection of X-mode second harmonic electrocyclotron radiation.
where
µ(X)
n (θ=
π
2) ∼= 1 − (
n −32 − n2
n2− 1 ) (
fpe
fce
)2,
νt =
k Te/me and λ0 = c/fc.
To construct the curves shown in Fig. 1.a and Fig. 1.b we assumed parabolic profiles for the electron density and tem-perature. Those profiles are simple and easy to use and re-present quite well most of observed experimental data. The profiles used to obtain Fig. 1 were :
ne(r) = ne0[ 1−(r
a)
ξ]β, T
e(r) = Te0[ 1−(r
a)
g]δ,
where ξ = 2, β = 1, g = 2 andδ = 1. In those profi-les,ais the plasma radius,ne0is the peak electron density
andTe0is the peak electron temperature. For those curves
BT0= 1.14T,ne0= 2.3×10¹⁹m−3andTe
0= 500eV.
The ECE radiation in the O-mode n=1 is inacessible since fpe > fce, as can be seen in Fig. 1.a. For the
O-mode n=2 the plasma is optically thin (τ ∼ 10−3). For
the X-mode n=1 , the radiation is inacessible since, if the antenna is in the low field side of the machine, the ECE ra-diation will be cutoff when it run into the fuh < f < fR
region. Forn >2the plasma is optically thin for both mo-des and, the use of ECE radiation for diagnostic purposes becomes difficult. For the TCABR, it is more suitable the use of the X-mode n=2 ECE radiation. Considering that the TCABR has low toroidal magnetic field (BT0≤1.2T), we
need to work in plasma scenarios with densities lower than
2.3×10¹⁹m−3to access all the ECE radiation. In spite of
the limitations relating the TCABR accessibility and absorp-tion condiabsorp-tions, that are typical in medium and small toka-mak machines, it is possible the measurement of the electron temperature in most relevant plasma scenarios.
3
The TCABR heterodyne sweeping
radiometer
For the detection of the ECE radiation in TCABR a hete-rodyne sweeping radiometer [9], operating in the frequency range 52GHz < f < 85GHz was developed. This range allows the detection of the ECE radiation of 3/4 of the plasma column. In the Fig. 2 the block diagram of the radiometer is shown.
The microwave signal coming from the antenna goes to the mixer and then to the IF filter/amplifier. After that, we have the difference between the signal fs and the local
os-cillatorfLO frequencies. The |fs−fLO|signal is
demo-dulated ( video detector ) and amplified ( video amplifier ). The video amplifier output signal goes to the data acqui-sition system where is digitalized and stored for later data analysis.
The local oscillator is a BWO ( Backward Wave Oscil-lator ) that is basically a voltage controlled oscilOscil-lator. The control voltage ( variable from 2.2 to 8.5V and generated by a Digital to Analog Converter ) determines the detected frequency. That frequency keeps a direct relationship with the plasma position ( for plasmas that are not very hot ).
The system can operate in measurement or calibration mode. In measurement mode, the plasma signal is cou-pled to the mixer by a mechanical switch. In the calibration mode, the mixer is coupled to a harmonic oscillator, opera-ting in 54, 60, 66, 72, 78 and 84GHzused for frequency calibration, or to a noise generator used for amplitude cali-bration check. A mechanical waveguide switch and a 20dB directional coupler are used to commute the radiometer from the measurement mode ( coupled to the plasma ) to the cali-bration mode.
The calibration in amplitude ( intensity ) can be made or checked in three ways : by direct calibration using a black-body emitter with a known temperature, by the use of a cryo-genic matched load immersed in liquid nitrogen or at the room temperature or, finally, we can use a noise source to check the calibration. The first way is the best one but is difficult and takes a longer time. The last way can be used as an easy way to check the calibration.
The TCABR radiometer main parameters are : Fre-quency range 52 - 85GHz; BWO output power 4 - 20mW; LO sweep time ( from 52 to 85GHz) 150µs; Mi-nimal time for one LO frequency step 50µs; Noise temperature < 13dB; IF ( amplifier/filter ) frequency band 0.1 − 1GHZ; Harmonic Oscillator frequencies: 54, 60, 66, 72, 78, 84GHz; Noise Source ENR ( Equivalent Noise Ratio ) 15dB; NS stability 0.01dB/oC; NS
Flat-ness±1.5dB. The radiometer is a double-sideband recei-ver ( DSB ) since it is sensitive to both sideband frequen-cies. In the calculation of the horizontal space resolution, a
Figure 3. Gaussian antenna used for the ECE detection in TCABR tokamak. a. Antenna dimensions inmm. b. Photo of the antenna.
A Gaussian antenna, used for better spatial resolution, makes the coupling of the radiometer with TCABR plasma. In Fig. 3 a diagram and a photo of the antenna are shown. The waist of the beam at the antenna focus (∼= 2cm) de-fines the vertical space resolution for the ECE detection. The total ECE spatial resolution ( vertical and horizontal ) is about 2cm. The radiometer is placed 5m away from the tokamak and an oversized waveguide is used to reduce the losses.
4
Experimental results
4.1
Sensibility and absolute calibration
The radiometer sensibility is related to the minimum level of the power that can be measured. This is related with the intrinsic thermal noise associated to the instrument. An im-portant parameter that defines the sensibility of the radiome-ter is its noise figure F = (input signal to noise ratio)/(output signal to noise ratio). In ECE detection, the signal in the an-tenna input is of the order ofnW. The thermal noise power in the input of the radiometer that have a frequency bandB, with the antenna coupled to a blackbody of temperature T is given by P = kT B. Here the Rayleigh-Jeans approxi-mation (hf ≪kT) was used. The radiometer noise figure is given by
F = Psi/kT B
APsi/(AkT B+PnA)
= 1 + PnA
AkT B,
It is also possible describe the noise properties of the ra-diometer using the noise temperature Tn. Taking PnA =
AkTnB,Tn is given by
Tn = (F − 1 )T0.
The measurement of the noise figure of the TCABR ra-diometer was made by the two temperatures method ( or Y factor method ). In this method, two emitters with two diffe-rent temperatures : hot Th(≈300K) and cold Tc(77K)
are used. We define Y factor as the ratio of the radiometer output power when the hot and the cold bodies are placed in front of the antenna :
Y = Ph
Pc
= k(Tn+Th)B
k(Tn+Tc)B
= Tn+Th
Tn+Tc
or
Tn =
Th −Y Tc
Y −1 .
Using the above expressions we obtain the noise figure FdB = 10 [log10( 1 +Tn/T0)].
Another useful parameter is the Equivalent Noise Ratio -ENR that keeps a direct relationship with the noise tempera-tureTn, and is defined byEN R= 10log[Tn/(T0−1) ].
To measure Tn and the noise figure we used a matched
load, shown in Fig. 4.a, that was used in liquid nitrogen and also at room temperature. The matched load ( microwave absorber ) was coupled to the radiometer input. In Fig. 4.b we show the noise temperature and the noise figure for all the radiometer frequency bandwidth.
Besides the Noise Temperature Tn and Noise Figure
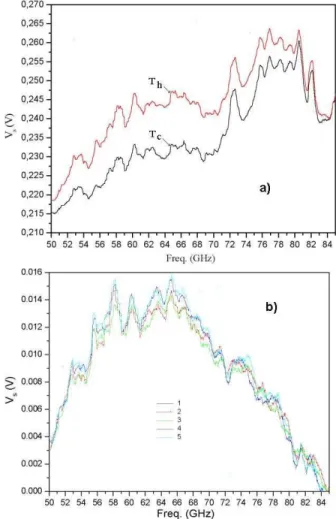
F, it is important to obtain experimentally a calibration curve relating the radiometer output signal ( in volts ) with the temperature ( ineV) [10]. In this calibration, we used the experimental arrangement shown in Fig. 5. For the ca-libration, we used two thermal sources with two different temperatures (ThandTc). In this measurement, the
distan-ces involving the emitter, antenna and the radiometer were the same as those when the radiometer was coupled to the TCABR machine. In the corresponding position where the center of the plasma column would be, we put two emitters one in high temperature and the other in low temperature.
In Fig. 6.a. we show the output signal ( in function of frequency ) of the radiometer for emitters in the high tem-perature Th (923K = 650oC) and low temperature Tc
Figure 4. a. Matched load used for noise temperature measurements. b. Noise temperature Tn and noise figure FdB for the TCABR
radiometer for six measurement.
Figure 5. Experimental apparatus used for the radiometer absolute calibration. Dimensions in meters.
To obtain the final absolute calibration curve, the ab-sorption and reflection characteristics of the diagnostic glass window were measured [11] in the frequency range of the radiometer. The radiation coming from the plasma is parti-ally reflected and also partiparti-ally absorbed by the glass. The measurement was done with two thermal sources ( hot and cold ) and applying, for each case, the radiation transport equation [12] :
Ih2 = Ih1e−τ(1−r)2 +ITamb(1−e
−τ) (1−r)
and
Ic2 = Ic1e−τ(1−r)2 +ITamb(1−e
−τ) (1−r)
From these equations, we obtain
e−τ( 1− r)2 = Ih2 −Ic2
Ih1 −Ic1
,
whereIh1 and Ic1 are the radiative intensities attaining the
glass window coming from the hot and cold sources,ITamb
is the radiative intensity emitted by the glass, Ih2 and Ic2
are the radiative intensities from the hot and cold sources af-ter passing through the glass window,τ is the optical depth of the glass and r = [(n−1)/(n+ 1)]2 is the glass
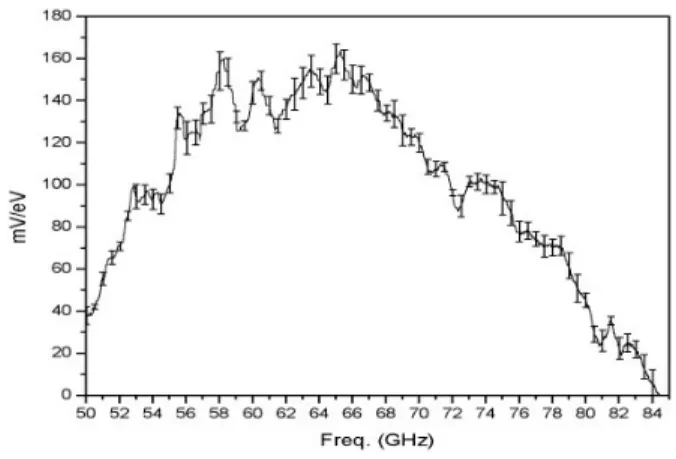
re-flection coefficient. In the Fig. 8 the final calibration curve is shown. This curve was obtained multiplying the curve of Fig. 7 by the factore−τ( 1− r)2. The error bars shown in
the figures were obtained from five different measurements of the calibration curve.
Figure 7. Absolute calibration curve (mV /eV) obtained from the curves of the Fig. 6.b.
Figure 8. Final calibration curve.
The absolute calibration of the radiometer takes a lot of work and time to be done. The calibration curve depends on the characteristics of the radiometer components, parti-cularly of the BWO, that may change with time. For this reason, the calibration curve should be checked routinely. This checking is easily done, at the begining of each toka-mak session, using the noise generator and the harmonic os-cillator.
4.2
Time and radial profiles of the plasma
temperatures
Finally, we show radial and temporal profiles of the elec-tron temperature obtained with the radiometer. These re-sults illustrate measurements made with the radiometer in the two modes of operation : sweeping ( several radial posi-tions ) and fixed frequency ( high time resolution ). Results of ECE radiation detection in a high-density plasma scenario ( above the cutoff frequency ) are also shown.
toroidal electric field present in the breakdown and heating phases of the discharge. After the initial stage of the dis-charge, there is a time interval (15 < t <95ms) where we have a thermal plasma and the detected ECE radiation has a lower time variation. In the Fig. 9.b a radial profile of Te, for t = 50ms, is shown, where the peak electron
temperature is≈ 500eV.
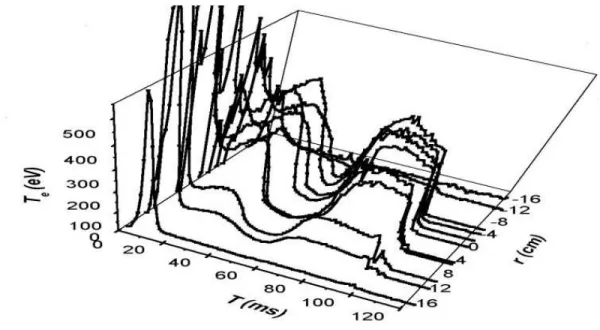
In Fig. 10, temporal and radial profiles of ECE emis-sion are shown in a 3D plot for a discharge where the elec-tron density is higher than the right-hand cutoff (ne >
2.3×10¹⁹m−3). This pulse has duration of about100ms.
We verify that, for the interval between 30 and 70ms, there is a decrease of the radiation intensity due to the increase of the plasma electron density that becomes higher than the cu-toff density. This behavior of the detected ECE radiation can be used to obtain information on the radial electron density profile [13].
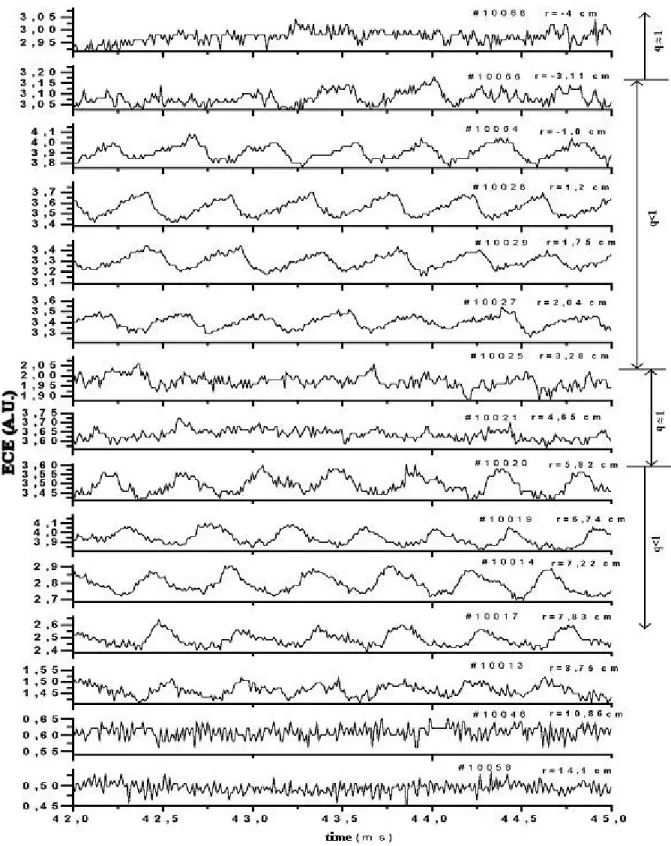
Finally we show results [14] obtained with the radiome-ter in the fixed frequency mode. In this mode, the radiomeradiome-ter time resolution is 10µs. In Fig. 11, 15 ECE time profiles of the electron temperature are shown. To obtain those pro-files, 15 tokamak shots were used. Care was taken to use only very reproducible shots and we used one shot for each profile. For each shot, the frequency of the local oscillator was changed allowing the measurement of the electron tem-perature for different radial position between r = −4cm and r = +14cm. In these profiles, it is possible to see clearly the occurrence of sawteeth oscillations. It is ob-served that, in the radial position r ∼= +4cm, we have the inversion of the sawtooth. In this radius the safety fac-tor is unitary (q = 1). Internally to the surface q = 1
(−4cm < r <+4cm) a slow growth of the electron tem-perature is followed by an abrupt fall, and externally to that surface we have an opposite behavior, an abrupt increase of the temperature is followed by a slow fall. The duration of the sawteeth is about 400µs.
5
Conclusions
It was coupled, with success, in the TCABR tokamak, a he-terodyne radiometer that operates in the 52 to 85GHz fre-quency range. The radiometer noise figure was measured and the value obtained was FdB ∼= 12dB. The noise
radial profiles of plasma temperature. For non-thermal plas-mas, particularly those with runway electrons, a large incre-ase in the ECE radiation is observed. For a magnetic field of
BT0 = 1.14T it was verified that we can access the ECE
radiation up to a density of ne = 2.3×10¹⁹m−3 where
the right-hand cutoff occurs.
Figure 9. a. Time profiles of the electron temperature obtained in TCABR. The radiometer was in sweeping mode. The calibration curve shown in Fig. 8 was used to obtain the temperature. Seven time profiles are shown for the following radial positions :+ 12.6cm,+ 8.5cm,
+ 3.5cm,+ 1.3cm,−4.5cm,−7.8cm,−12.1cm. For this discharge the toroidal field was BT0 = 1.07T. b. Radial profile for the
same pulse obtained fort= 50ms. The peak temperature is about500eV.
Figure 11. Time profiles obtained in the TCABR with the radiometer working in fixed frequency mode ( time resolution of10µs) for 15 different radial positions from r= +14.1cm ( internal ) tor=−4.0cm( external ). The toroidal field in the column center is 1.13T. The electron density is1.2×1019
m−3
Acknowledgements
This work was partially supported by the Fundac¸˜ao de Amparo `a Pesquisa do Estado de S˜ao Paulo ( FAPESP ).
References
[1] M. Bornatici, R. Cano, O. De Barbieri, and F. Engelman, Nu-clear Fusion, 23, 1153 (1983).
[2] D. A. Boyd, Intern. Journal of Infrared and Millimeter Waves, 1, 45 (1980).
[3] A. E. Costley, R. J. Hastie, J. W. M. Paul, and J. Chamberlain, Phys. Rev. Lett. 33, 758 (1974).
[4] M. Brusati, D. V. Bartlett, A. Ekedahl, P. Froissard, A. Ai-roldi, G. Ramponi, R. P. da Silva, and Y. Peysson, Nuclear Fusion 34, 23 (1994).
[5] J. W. Heard, C. Watts, R. F. Gandy, P. E. Phillips, G. Cima, R. Chatterjee, A. Blair, A. Hubbard, C. W. Domier, and N. C. Luhmann Jr, Rev. Sci. Instrum. 70, 1011 (1999).
[6] P. C. Efthimion, J. C. Hosea, R. Kaita, R. Majeski, and G. Taylor, Rev. Sci. Instrum. 70, 1018 (1999).
[7] I. C. Nascimento, R. M. O. Galv˜ao, E. K. Sanada, Yu. K. Kuznetsov, A. P. Reis, F. T. Degasperi, N. A. M. Cuevas, J. I. Elizondo, A. G. Tuszel, R. P. da Silva, D. Campos, W. P. S´a, J. H. Vuolo, A. Vanucci, A. M. M. Fonseca, L. Ru-chko, N. R. Nunes, V. S. W. Vuolo, and M. V. A. P. Heller, “Preliminary Results from the TCABR Tokamak”, IAEA Te-chnical Committee Meeting on Research Using Small Fusion
Devices, 18-20 October 1999, F1-TC-536.15, Southwestern Institute of Physics Chengdu, China.
[8] M. Bornatici, F. Engelman, S. Novak, and V. Petrillo, Plasma Physics 23, 1127 (1981).
[9] H. J. Hartfuss, T. Geist, and M. Hirsch, Plasma Phys. Control. Fusion 39, 1693 (1997).
[10] P. F. Goldsmith, R. A. Kot, and R. S. Iwasaki, Rev. Sci. Ins-trum. 50, 1120 (1979).
[11] A. M. M. Fonseca, R. P. da Silva, J. H. Vuolo, R. M. O. Galv˜ao, and J. Raffaelli, “An experimental method for the optical characterization of materials at millimeter range”, X
Latin American Workshop on Plasma Physics - 7th Brazilian Meeting on Plasma Physics, Nov. 30 - Dec. 5, 2003, S˜ao
Pe-dro, SP, Brazil.
[12] G. Bekefi, Radiation Process in Plasmas, Wiley, New York (1966).
[13] A. M. M. Fonseca, R. P. da Silva, R. M. O. Galv˜ao Yu. K. Kuznetsov, J. I. Elizondo, L. F. Ruchko, and J. H. Vuolo,
“Electron Density Measurements from Right-Hand Cutoff of ECE in the TCABR Tokamak”, to be published in Braz. J. of
Phys. (2004).
[14] A. M. M. Fonseca, R. P. da Silva, J. H. Vuolo, R. M. O. Galv˜ao, Yu. K. Kuznetsov, E. R. Calderon, and J. Raffa-elli, “Electron Cyclotron Emission from Thermal and
Non-Thermal Discharges in the TCABR tokamak”, 30th EPS