DWESD
5, 473–494, 2012Numerical and experimental investigation of leaks
S. Meniconi et al.
Title Page
Abstract Introduction
Conclusions References
Tables Figures
◭ ◮
◭ ◮
Back Close
Full Screen / Esc
Printer-friendly Version Interactive Discussion
Discussion
P
a
per
|
Dis
cussion
P
a
per
|
Discussion
P
a
per
|
Discussio
n
P
a
per
|
Drink. Water Eng. Sci. Discuss., 5, 473–494, 2012 www.drink-water-eng-sci-discuss.net/5/473/2012/ doi:10.5194/dwesd-5-473-2012
© Author(s) 2012. CC Attribution 3.0 License.
Drinking Water
Engineering and Science
Discussions
O
p
en
Acc
e
s
s
This discussion paper is/has been under review for the journal Drinking Water Engineering and Science (DWES). Please refer to the corresponding final paper in DWES if available.
Numerical and experimental investigation
of leaks in viscoelastic pressurized pipes
S. Meniconi, B. Brunone, M. Ferrante, and C. Massari
Dipartimento di Ingegneria Civile ed Ambientale, Universit `a degli Studi di Perugia, Italy Received: 27 July 2012 – Accepted: 31 July 2012 – Published: 3 September 2012 Correspondence to: S. Meniconi ([email protected]) and
B. Brunone ([email protected])
DWESD
5, 473–494, 2012Numerical and experimental investigation of leaks
S. Meniconi et al.
Title Page
Abstract Introduction
Conclusions References
Tables Figures
◭ ◮
◭ ◮
Back Close
Full Screen / Esc
Printer-friendly Version Interactive Discussion
Discussion
P
a
per
|
Dis
cussion
P
a
per
|
Discussion
P
a
per
|
Discussio
n
P
a
per
|
Abstract
This paper extends the analysis concerning the importance in numerical models of unsteady friction and viscoelasticity to transients in plastic pipes with an external flow due to a leak. In fact recently such a benchmarking analysis has been executed for the cases of a constant diameter pipe (Duan et al., 2010), a pipe with a partially closed
5
in-line valve (Meniconi et al., 2012a), and a pipe with cross-section changes in series (Meniconi et al., 2012b). The analysis is based on laboratory tests carried out at the Water Engineering Laboratory (WEL) of the University of Perugia, Italy, and numerical experiments by means of different 1-D numerical models. The results show that it is crucial to take into account the viscoelasticity to simulate the main characteristics of
10
the transients, also in the case of a damaged pipes.
1 Introduction
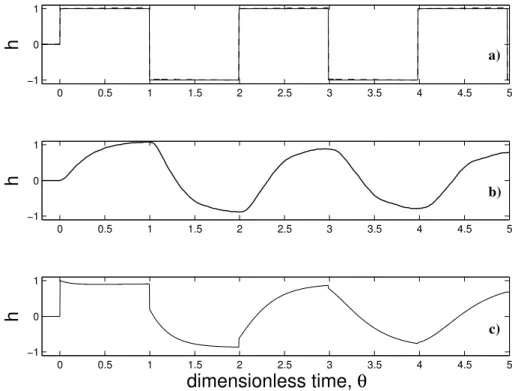
If the transients in a pressurized constant diameter pipe supplied by a constant head reservoir – hereafter referred to as single pipe – due to the instantaneous closure of a valve placed at the downstream end section, are simulated by means of the
15
Allievi-Joukowsky analytical model (Fig. 1a, continuous line), no decay of the pres-sure peaks takes place after the end of the manoeuvre. In fact, in this case friction effects are neglected and an elastic behaviour of the pipe material is assumed. In Fig. 1, the time-history of the dimensionless piezometric head – hereafter referred to as dimensionless pressure signal – at the end section of the pipe, h=(H–H0)/∆HAJ
20
is shown, where H=piezometric head, ∆HAJ=aiQ0/(Ag) is the Allievi-Joukowsky overpressure,ai=instantaneous elastic pressure wave speed,Q=discharge,A=pipe area, g=acceleration gravity, θ=t/τ is the dimensionless time with t=time evalu-ated from the beginning of manoeuvre,τ=2L/ais the characteristic time of the pipe,
L=pipe length, a=mean pressure wave speed, and the subscript 0 refers quantities
25
DWESD
5, 473–494, 2012Numerical and experimental investigation of leaks
S. Meniconi et al.
Title Page
Abstract Introduction
Conclusions References
Tables Figures
◭ ◮
◭ ◮
Back Close
Full Screen / Esc
Printer-friendly Version Interactive Discussion
Discussion
P
a
per
|
Dis
cussion
P
a
per
|
Discussion
P
a
per
|
Discussio
n
P
a
per
|
When friction forces in an elastic pipe are evaluated by means of the uniform flow formulas, i.e. within the so called steady-state approach (Fig. 1a, dashed line almost undistinguishable from the continuous line), no valuable difference occurs with respect to the Allievi-Joukowsky model in terms of decay and rounding of pressure peaks. Thus nor the Allievi-Joukowsky model nor the one based on the steady-state approach,
sim-5
ulate properly the strong decay and rounding of pressure peaks of experimental data both in elastic (Fig. 1b) and viscoelastic (Fig. 1c) pipes. This result has motivated the in-tense research activity in the field of unsteady friction (Adamkowski and Lewandowski, 2006; Bergant et al., 2001; Brunone et al., 1991, 1995; Brunone and Berni, 2010; Ghi-daoui et al., 2005; Pezzinga, 2000, 2009; Storli and Nielsen, 2011; Zielke, 1968) and
10
viscoelasticity (Covas et al., 2004, 2005; Ferrante et al., 2011; Franke and Seyler, 1983; Ghilardi and Paoletti, 1986; Meniconi et al., 2012a, b; Soares et al., 2008) modelling during transients in pressurized pipes in the last two decades. In fact the damping and rounding of pressure peaks in a single pipe are ascribed to the effect of unsteady fric-tion in elastic pipes and to both unsteady fricfric-tion and viscoelasticity in plastic ones.
15
Only recently, Duan et al. (2010) have shown quantitatively that in plastic pipes the role of unsteady friction is relevant only in the first phases of the transients. In other words, the viscoelastic effect becomes more and more dominant with respect to unsteady friction, as time progresses.
The interest in the simulation of transients in pressurized pipes is not due only to
20
the importance of evaluating the extreme values of the pressure properly. In fact in the last two decades, starting from the pioneering paper by Liggett and Chen (1994), tran-sient test-based techniques for leak detection and sizing have been more and more used because of their reliability and cheapness (Colombo et al., 2009). Within such techniques several distinctions can be made about the role played in the diagnosis
25
DWESD
5, 473–494, 2012Numerical and experimental investigation of leaks
S. Meniconi et al.
Title Page
Abstract Introduction
Conclusions References
Tables Figures
◭ ◮
◭ ◮
Back Close
Full Screen / Esc
Printer-friendly Version Interactive Discussion
Discussion
P
a
per
|
Dis
cussion
P
a
per
|
Discussion
P
a
per
|
Discussio
n
P
a
per
|
and Chen, 1994), the governing equations are integrated in the time domain (e.g. Co-vas and Ramos, 2010) or converted into the frequency domain after having linearized the friction term and the nonlinear boundary conditions (e.g. the ones at the manoeu-vre valve and at the leak) to reduce the needed amount of computer time (Covas et al., 2005; Ferrante and Brunone, 2003a; Lee et al., 2005a, b, 2006; Mpesha et al., 2001;
5
Wang et al., 2002). In the latter approach, the characteristics of the possible leaks are inferred directly from transient data – in most cases pressure traces – by measuring the arrival time and the entity of pressure waves at the measurement sections, particu-larly those reflected by the leaks (Brunone, 1999; Brunone and Ferrante, 2001; Covas and Ramos, 2010; Ferrante and Brunone, 2003b; Ferrante et al., 2009a, b; J ¨onsson,
10
2001; J ¨onsson and Larson, 1992). A detailed literature review is presented in Colombo et al. (2009).
In the present paper, attention is focused on the numerical simulation of transients in a viscoelastic single pipe with external flow, i.e. a leak – hereafter referred to as damaged pipe. Precisely, the interaction between a pressure wave and different leaks
15
in a plastic pipe is examined during the first phases of the transients. In the first part, laboratory experiments are discussed by pointing out the effect of a leak; in the second part the results of different 1-D numerical models are compared.
2 Experimental setup
Experimental tests have been carried out at the Water Engineering Laboratory (WEL)
20
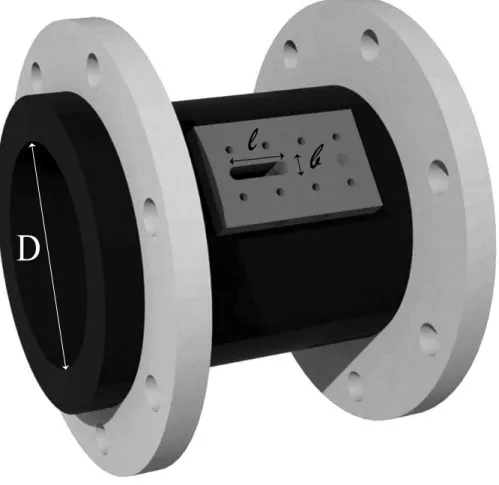
of the University of Perugia, Italy. The experimental setup (Fig. 2) comprises a high den-sity polyethylene (HDPE) pipe withL=166.28 m, internal diameterD=93.3 mm, nom-inal diameter DN110, and wall thicknesse=8.1 mm. This pipe connects the upstream reservoir to the downstream manoeuvre valve – ball valve DN50 – that discharges in the air.
25
DWESD
5, 473–494, 2012Numerical and experimental investigation of leaks
S. Meniconi et al.
Title Page
Abstract Introduction
Conclusions References
Tables Figures
◭ ◮
◭ ◮
Back Close
Full Screen / Esc
Printer-friendly Version Interactive Discussion
Discussion
P
a
per
|
Dis
cussion
P
a
per
|
Discussion
P
a
per
|
Discussio
n
P
a
per
|
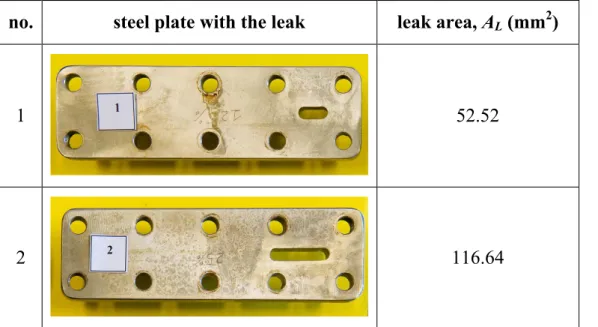
L′=105.44 m from the manoeuvre valve. With respect to the previous laboratory ar-rangement (Brunone and Ferrante, 2001; Ferrante and Brunone, 2003b; Ferrante et al., 2009a, b) the new device allows to simulate rectangular leaks of different size by changing the steel plate with the orifice (Table 1).
Pressure signal is measured with a frequency acquisition of 1024 Hz at four
sec-5
tions: section M, immediately upstream of the manoeuvre valve, sections D and U, placed downstream of the leak (at a distance sD=97.50 m from the end valve) and upstream of the leak (sU=138.50 m), respectively, and at the supply reservoir (Fig. 1). Piezoresistive transducers with a full scale of 3.5, 7 or 10 bar, depending on the pres-sure maximum value during the transient test, are used. The steady-state discharge at
10
the end valve,Q0, is measured by means of a magnetic flow meter.
3 Experimental pressure signals
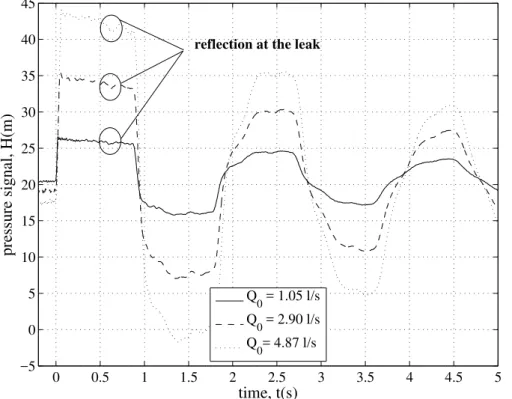
Figures 4 and 5 show pressure signals,H, measured at section M in the damaged pipe with the leak no. 1 and no. 2, respectively. During tests, different values ofQ0, and then of∆HAJ, have been considered.
15
According to literature (e.g. Brunone and Ferrante, 2001; Covas and Ramos, 2010), for a given leak, the larger∆HAJ, the larger the pressure wave reflected by the leak.
In Fig. 6 the pressure signals in the single and damaged pipes (with the leaks no. 1 and no. 2) for about the sameQ0 (∼3 l s−
1
), are compared. It can be noted the larger damping occurring in the damaged pipe with respect to the single pipe, as well as that
20
DWESD
5, 473–494, 2012Numerical and experimental investigation of leaks
S. Meniconi et al.
Title Page
Abstract Introduction
Conclusions References
Tables Figures
◭ ◮
◭ ◮
Back Close
Full Screen / Esc
Printer-friendly Version Interactive Discussion
Discussion
P
a
per
|
Dis
cussion
P
a
per
|
Discussion
P
a
per
|
Discussio
n
P
a
per
|
4 1-D numerical models
According to literature (Covas et al., 2004, 2005; Franke and Seyler, 1983; Ghilardi and Paoletti, 1986; Meniconi et al., 2012a, b; Soares et al., 2008), the complete 1-D numerical model to simulate transients in pressurized viscoelastic pipes is based on the continuity equation:
5
∂H ∂t +
(ai)2
gA ∂Q
∂s +
2(ai)2
g
dεr
dt =0, (1)
and the momentum equation:
∂H ∂s +
Q gA2
∂Q ∂s +
1
gA ∂Q
∂t +J=0, (2)
withs=axial co-ordinate,J=total friction term, and εr=retarded strain. More details on the model and the calibration procedure are reported in Meniconi et al. (2011,
10
2012a, b). It is worthy of noting that J is regarded as the sum of two components. That is,
J=Js+Ju, (3)
whereJs is the quasi steady-state value based on the instantaneous mean flow veloc-ity, andJu is the additional term due to unsteadiness (Vardy and Brown, 2003, 2004;
15
Ghidaoui et al., 2005). Within an instantaneous acceleration-based model,Ju can be evaluated by means of the following relationship (Brunone et al., 1991, 1995; Bergant et al., 2001; Pezzinga, 2000):
Ju=
kd
2gA ∂Q
∂t +a
isign(Q)|∂Q ∂s|
, (4)
in whichkd=decay coefficient and sign(Q)=(+1 forQ≥0 or−1 forQ <0).
20
DWESD
5, 473–494, 2012Numerical and experimental investigation of leaks
S. Meniconi et al.
Title Page
Abstract Introduction
Conclusions References
Tables Figures
◭ ◮
◭ ◮
Back Close
Full Screen / Esc
Printer-friendly Version Interactive Discussion
Discussion
P
a
per
|
Dis
cussion
P
a
per
|
Discussion
P
a
per
|
Discussio
n
P
a
per
|
1. the unsteady friction (Ju=0);
2. the unsteady friction and the viscoelasticity (Ju=0 andεr=0);
3. the friction term and the viscoelasticity (J=0 andεr=0).
The simplified model no. 1 takes into account the predominant effect of viscoelasticity (Duan et al, 2010; Meniconi et al., 2012a, b). The simplified model no. 2 coincides with
5
the steady-state approach for transients in elastic pipes; whereas the last one derives from the classical Allievi-Joukowski theory.
In all models the boundary condition at the leak is given by the Torricelli equation:
QL=CLAL
q
2g(HL−zL), (5)
whereC=discharge coefficient, andz=elevation, with the subscriptLreferring
quan-10
tities to the leak.
5 Numerical experiments for a damaged pipe
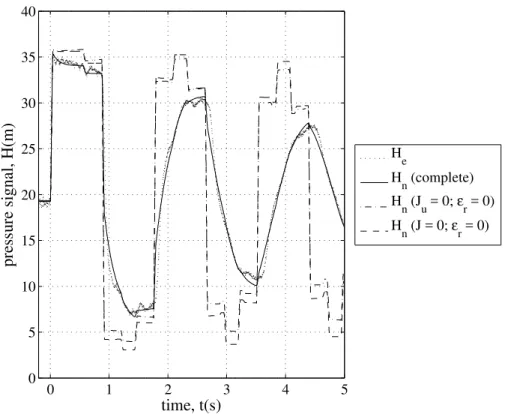
Figures 7 and 8 show the comparison between experimental pressure signal,He, and the numerical simulations, Hn, given by the models described in Sect. 4 within the
Method of Characteristics (Wylie and Streeter, 1993).
15
As for the single pipe (Fig. 1), when the simplified models in which the viscoelasticity is neglected are used – i.e. models no. 2 and no. 3 – the main characteristics of the ex-perimental traces are not captured: nor the damping, nor the rounding of the pressure peaks. With regard to the pressure waves reflected by the leak, only the one occurring during the first characteristic time of the pipe is quite well simulated. On the contrary,
20
DWESD
5, 473–494, 2012Numerical and experimental investigation of leaks
S. Meniconi et al.
Title Page
Abstract Introduction
Conclusions References
Tables Figures
◭ ◮
◭ ◮
Back Close
Full Screen / Esc
Printer-friendly Version Interactive Discussion
Discussion
P
a
per
|
Dis
cussion
P
a
per
|
Discussion
P
a
per
|
Discussio
n
P
a
per
|
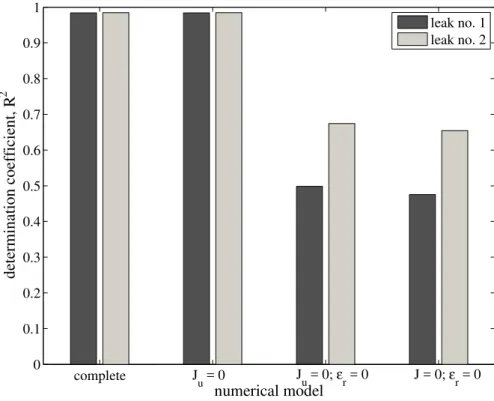
pipe. A quantitative measure of such behaviours is given in Fig. 9, where, with regard to the first 5 s of the transient, the determination coefficientR2 – denoting the strength of the association betweenHe and Hn – is reported. For leak no. 1,R
2
assumes the same maximum value (=0.984) for the complete and simplified model no. 1 (Ju=0). This means that the 98.84 % of the total variation inHecan be explained by the linear
5
relationship betweenHeand Hn. The other 1.17 % of the total variation inHeremains unexplained by the numerical models. The quality of the numerical simulation deterio-rates when simplified models no. 2 (Ju=0 andεr=0) and no. 3 (J=0 and εr=0) are used. Particularly, for the simplified model no. 2,R2breaks down to 0.498, whereas it becomes 0.475 for the simplified model no. 3.R2exhibits almost the same behaviour
10
for the damaged pipe with leak no. 2.
6 Conclusions
This paper can be included in the research activity focused on the analysis of the role that unsteady friction and viscoelasticity play in the numerical simulation of transients in plastic pipes. In fact, up to few years ago there was no clear delineation between
15
when and when not include such effects in transient flow numerical models not even for the simplest case of the constant diameter pipe (single pipe). In recent contributions (Duan et al., 2010; Meniconi et al., 2012a, b) such a benchmarking analysis has been executed for the cases of a single pipe, a pipe with a partially closed in-line valve, and a pipe with cross-section changes in series. The important case of a pipe with an
20
external flow due to a leak deserved less attention.
In the first part of this paper the results of tests executed at the Water Engineering Laboratory (WEL) of the University of Perugia, Italy, with a new device to simulate leaks, are discussed. Precisely, it is pointed out the effect of the leak on the pressure signal both in terms of the reflected pressure wave and the damping of the extreme values of
25
DWESD
5, 473–494, 2012Numerical and experimental investigation of leaks
S. Meniconi et al.
Title Page
Abstract Introduction
Conclusions References
Tables Figures
◭ ◮
◭ ◮
Back Close
Full Screen / Esc
Printer-friendly Version Interactive Discussion
Discussion
P
a
per
|
Dis
cussion
P
a
per
|
Discussion
P
a
per
|
Discussio
n
P
a
per
|
In the second part, different 1-D numerical models are presented: the complete model, that takes into account both unsteady friction and viscoelasticity, and three sim-plified models in which the unsteady friction (model no. 1), the unsteady friction and viscoelasticity (model no. 2), the friction term and the viscoelasticity (model no. 3) are neglected, respectively.
5
By comparing experimental and numerical results, it is demonstrated the crucial role played by the viscoelasticity with respect to unsteady friction also in the considered case of a plastic pipe with a leak. From a quantitative point of view, such a behaviour of numerical models is pointed out by considering the value of the determination co-efficientR2, which denotes the strength of the association between the numerical and
10
experimental pressure traces during a specified period of time.
Acknowledgements. This research has been supported by Fondazione Cassa Risparmio Pe-rugia under the Project “Leaks and blockages detection techniques for reducing energy and natural resources wastage”. The support of A. Cirimbilli, C. Del Principe and A. Adorisio in the laboratory activity is highly appreciated.
15
References
Adamkowski A. and Lewandowski, M.: Experimental examination of unsteady friction models for transient pipe flow simulation, J. Fluid. Eng.-T. ASME, 128, 1351–1363, 2006.
Bergant, A., Simpson, A., and Vitkovsky, J.: Developments in unsteady pipe flow friction mod-elling, J. Hydraul. Res., 39, 249–257, 2001.
20
Brunone, B.: A transient test-based technique for leak detection in outfall pipes, J. Water Res. Pl.-ASCE, 125, 302–306, 1999.
Brunone, B. and Ferrante, M.: Detecting leaks in pressurised pipes by means of transients, J. Hydraul. Res., 39, 539–547, 2001.
Brunone, B. and Berni, A.: Wall shear stress in transient turbulent pipe flow by local velocity
25
DWESD
5, 473–494, 2012Numerical and experimental investigation of leaks
S. Meniconi et al.
Title Page
Abstract Introduction
Conclusions References
Tables Figures
◭ ◮
◭ ◮
Back Close
Full Screen / Esc
Printer-friendly Version Interactive Discussion
Discussion
P
a
per
|
Dis
cussion
P
a
per
|
Discussion
P
a
per
|
Discussio
n
P
a
per
|
Brunone, B., Golia, U. M., and Greco, M.: Some remarks on the momentum equation for fast transients, Proc., Int. Meeting on “Hydraulic Transients and Water Column Separation”, edited by: Cabrera, E. and Fanelli, M., 201–209, 1991.
Brunone, B., Golia, U. M., and Greco, M.: Effects of two-dimensionality on pipe transients mod-eling, J. Hydraul. Eng.-ASCE, 121, 906–912, 1995.
5
Collins, R. P., Boxall, J. B., Karney, B. W., Brunone, B., and Meniconi, S.: How severe can transients be after a sudden depressurization?, J. Am. Water Works Ass., 104, E243–E251, 2012.
Colombo, A. F., Lee, P., and Karney, B. W.: A selective literature review of transient-based leak detection methods, J. Hydro-environ. Res., 2, 212–227, 2009.
10
Covas, D. and Ramos, H.: Case studies of leak detection and location in water pipe systems by inverse transient analysis, J. Water Res. Pl.-ASCE, 136, 248–257, 2010.
Covas, D., Stoianov, I., Mano, J., Ramos, H., Graham, N., and Maksimovic, C.: The dynamic effect of pipe-wall viscoelasticity in hydraulic transients, Part I – Experimental analysis and creep characterization, J. Hydraul. Res., 42, 516–530, 2004.
15
Covas, D., Stoianov, I., Mano, J., Ramos, H., Graham, N., and Maksimovic, C.: The dynamic effect of pipe-wall viscoelasticity in hydraulic transients, Part II – Model development, calibra-tion and verificacalibra-tion, J. Hydraul. Res., 43, 56–70, 2005.
Duan, H., Ghidaoui, M., Lee, P. J., and Tung, Y. K.: Unsteady friction and visco-elasticity in pipe fluid transients, J. Hydraul. Res., 48, 354–362, 2010.
20
Ferrante, M. and Brunone, B.: Pipe system diagnosis and leak detection by unsteady-state tests, 1 Harmonic analysis, Adv. Water Resour., 26, 95–105, 2003a.
Ferrante, M. and Brunone, B.: Pipe system diagnosis and leak detection by unsteady-state tests, 2 Wavelet analysis, Adv. Water Resour., 26, 107–116, 2003b.
Ferrante, M., Brunone, B., and Meniconi, S.: Leak detection in branched pipe systems coupling
25
wavelet analysis and a lagrangian model, J. Water Supply Res. T., 58, 95–106, 2009a. Ferrante, M., Brunone, B., and Meniconi, S.: Leak-edge detection, J. Hydraul. Res., 47, 233–
241, 2009b.
Ferrante, M., Massari, C., Brunone, B., and Meniconi, S.: Experimental evidence of hysteresis in the head-discharge relationship for a leak in a polyethylene pipe, J. Hydraul. Eng.-ASCE,
30
137, 775–781, 2011.
DWESD
5, 473–494, 2012Numerical and experimental investigation of leaks
S. Meniconi et al.
Title Page
Abstract Introduction
Conclusions References
Tables Figures
◭ ◮
◭ ◮
Back Close
Full Screen / Esc
Printer-friendly Version Interactive Discussion
Discussion
P
a
per
|
Dis
cussion
P
a
per
|
Discussion
P
a
per
|
Discussio
n
P
a
per
|
Ghidaoui, M. S., Zhao, M., McInnis, D. A., and Axworthy, D. H.: A review of water hammer theory and practice, Appl. Mech. Rev., 58, 49–76, 2005.
Ghilardi, P. and Paoletti, A.: Additional visco-elastic pipes as pressure surges suppressors, Proc., 5th Int. Conf. on “Pressure Surges”, 113–121, 1986.
J ¨onsson, L.: Experimental studies of leak detection using hydraulic transients, Proc., 29th IAHR
5
Congress, 2001.
J ¨onsson, L. and Larson, M.: Leak detection through hydraulic transient analysis, Proc., Int. Conf. on “Pipeline Systems”, edited by: Coulbeck, B. and Evans, E., Kluwer Academic Pub-lishers, 273–286, 1992.
Lee, P. J., Vitkovsky, J. P., Simpson, A. R., Lambert, M. F., and Liggett, J.: Frequency domain
10
analysis for detecting pipelines leaks, J. Hydraul. Eng.-ASCE, 131, 596–604, 2005a. Lee, P. J., Vitkovsky, J. P., Lambert, M. F., Simpson, A. R., and Liggett, J.: Leak location using
the pattern of the frequency response diagram in pipelines: a numerical study, J. Sound Vb., 284, 1051–1073, 2005b.
Lee, P. J., Lambert, M., Simpson, A., and Vitkovsky, J. P.: Experimental verification of the
fre-15
quency response method of leak detection, J. Hydraul. Res., 44, 451–468, 2006.
Liggett, J. A. and Chen, L.-C.: Inverse transient analysis in pipe networks, J. Hydraul. Eng.-ASCE, 120, 934–955, 1994.
Meniconi, S., Brunone, B., Ferrante, M., and Massari, C.: Long period analysis of transient pres-sure signals for in-line valve checkin, Proc., 11th Int. Conf. on “Computing and Control for the
20
Water Industry – CCWI2011 Urban Water in Management: Challanges and Opportunities”, edited by: Exeter, D., Savic, A., Kapelan, Z., and Butler, D., 3, 787–792, 2011.
Meniconi, S., Brunone, B., Ferrante, M., and Massari, C.: Transient hydrodynamics of in-line valves in viscoelastic pressurized pipes: long-period analysis, Exp. Fluids, 53, 265–275, 2012a.
25
Meniconi, S., Brunone, B., and Ferrante, M.: Water hammer pressure waves at cross-section changes in series in viscoelastic pipes, J. Fluid. Struct., 33, 44–58, doi:10.1016/j.jfluidstructs.2012.05.007, 2012b.
Mpesha, W., Gassman, S. L., and Chaudhry, M. H.: Leak detection in pipes by frequency re-sponse method, J. Hydraul. Eng.-ASCE, 127, 134–147, 2001.
30
DWESD
5, 473–494, 2012Numerical and experimental investigation of leaks
S. Meniconi et al.
Title Page
Abstract Introduction
Conclusions References
Tables Figures
◭ ◮
◭ ◮
Back Close
Full Screen / Esc
Printer-friendly Version Interactive Discussion
Discussion
P
a
per
|
Dis
cussion
P
a
per
|
Discussion
P
a
per
|
Discussio
n
P
a
per
|
Pezzinga, G.: Local balance unsteady friction model, J. Hydraul. Eng.-ASCE, 135, 45–56, 2009.
Soares, A. K., Covas, D., and Reis, L. F. R.: Analysis of PVC pipe-wall viscoelasticity during water hammer, J. Hydraul. Eng.-ASCE, 134, 1389–1395, 2008.
Storli, P. T. and Nielsen, T. K.: Transient friction in pressurized pipes. II: Two-coefficient
instan-5
taneous acceleration-based model, J. Hydraul. Eng.-ASCE, 137, 679–695, 2011.
Vardy, A. and Brown, J.: Transient turbulent friction in smooth pipe flows, J. Sound Vi., 259, 1011–1036, 2003.
Vardy, A. and Brown, J.: Transient turbulent friction in fully rough pipe flows, J. Sound Vi., 270, 233–257, 2004.
10
Wang, X. J., Lambert, M. F., Simpson, A. R., Ligett, J. A., and Vitkovsky, J. P.: Leak detection in pipelines using the damping of fluid transients, J. Hydraul. Eng.-ASCE, 128, 697–711, 2002. Wylie, E. B. and Streeter, V. L.: Fluid transients in systems. Prentice Hall, Englewood Cliffs, NJ,
1993.
Zielke, W.: Frequency dependent friction in transient pipe flow, J. Basic Eng-T ASME, 90, 109–
15
DWESD
5, 473–494, 2012Numerical and experimental investigation of leaks
S. Meniconi et al.
Title Page
Abstract Introduction
Conclusions References
Tables Figures
◭ ◮
◭ ◮
Back Close
Full Screen / Esc
Printer-friendly Version Interactive Discussion
Discussion
P
a
per
|
Dis
cussion
P
a
per
|
Discussion
P
a
per
|
Discussio
n
P
a
per
|
Table 1.Geometrical characteristics of leaks used in tests.
no.
steel plate with the leak
leak area,
A
L(mm
2)
1
52.52
DWESD
5, 473–494, 2012Numerical and experimental investigation of leaks
S. Meniconi et al.
Title Page
Abstract Introduction
Conclusions References
Tables Figures
◭ ◮
◭ ◮
Back Close
Full Screen / Esc
Printer-friendly Version Interactive Discussion
Discussion
P
a
per
|
Dis
cussion
P
a
per
|
Discussion
P
a
per
|
Discussio
n
P
a
per
|
0 0.5 1 1.5 2 2.5 3 3.5 4 4.5 5
−1 0 1
h
0 0.5 1 1.5 2 2.5 3 3.5 4 4.5 5
−1 0 1
h
0 0.5 1 1.5 2 2.5 3 3.5 4 4.5 5
−1 0 1
h
dimensionless time,
θ
b) a)
c)
DWESD
5, 473–494, 2012Numerical and experimental investigation of leaks
S. Meniconi et al.
Title Page
Abstract Introduction
Conclusions References
Tables Figures
◭ ◮
◭ ◮
Back Close
Full Screen / Esc
Printer-friendly Version Interactive Discussion
Discussion
P
a
per
|
Dis
cussion
P
a
per
|
Discussion
P
a
per
|
Discussio
n
P
a
per
|
0 0.5 1 1.5 2 2.5 3 3.5 4 4.5 5
−5 0 5 10 15 20 25 30 35 40 45
time, t(s)
pressure signal, H(m)
Q
0 = 1.05 l/s
Q
0 = 2.90 l/s
Q
0= 4.87 l/s reflection at the leak
DWESD
5, 473–494, 2012Numerical and experimental investigation of leaks
S. Meniconi et al.
Title Page
Abstract Introduction
Conclusions References
Tables Figures
◭ ◮
◭ ◮
Back Close
Full Screen / Esc
Printer-friendly Version Interactive Discussion
Discussion
P
a
per
|
Dis
cussion
P
a
per
|
Discussion
P
a
per
|
Discussio
n
P
a
per
|
0 0.5 1 1.5 2 2.5 3 3.5 4 4.5 5
−5 0 5 10 15 20 25 30 35 40 45
time, t(s)
pressure signal, H(m)
Q
0 = 0.93 l/s
Q
0= 3.15 l/s
Q
0= 4.90 l/s reflection at the leak
DWESD
5, 473–494, 2012Numerical and experimental investigation of leaks
S. Meniconi et al.
Title Page
Abstract Introduction
Conclusions References
Tables Figures
◭ ◮
◭ ◮
Back Close
Full Screen / Esc
Printer-friendly Version Interactive Discussion
Discussion
P
a
per
|
Dis
cussion
P
a
per
|
Discussion
P
a
per
|
Discussio
n
P
a
per
|
0 0.5 1 1.5 2 2.5 3 3.5 4 4.5 5
5 10 15 20 25 30 35 40
time, t(s)
pressure signal, H(m)
single pipe
damaged pipe (leak no. 1) damaged pipe (leak no. 2)
DWESD
5, 473–494, 2012Numerical and experimental investigation of leaks
S. Meniconi et al.
Title Page
Abstract Introduction
Conclusions References
Tables Figures
◭ ◮
◭ ◮
Back Close
Full Screen / Esc
Printer-friendly Version Interactive Discussion
Discussion
P
a
per
|
Dis
cussion
P
a
per
|
Discussion
P
a
per
|
Discussio
n
P
a
per
|
0 1 2 3 4 5
0 5 10 15 20 25 30 35 40
time, t(s)
pressure signal, H(m)
H
e
H
n (complete)
H
n (Ju = 0; εr = 0)
H
n (J = 0; εr = 0)
DWESD
5, 473–494, 2012Numerical and experimental investigation of leaks
S. Meniconi et al.
Title Page
Abstract Introduction
Conclusions References
Tables Figures
◭ ◮
◭ ◮
Back Close
Full Screen / Esc
Printer-friendly Version Interactive Discussion
Discussion
P
a
per
|
Dis
cussion
P
a
per
|
Discussion
P
a
per
|
Discussio
n
P
a
per
|
complete 0
0.1 0.2 0.3 0.4 0.5 0.6 0.7 0.8 0.9 1
numerical model
determination coefficient, R
2
leak no. 1 leak no. 2
J
u = 0 Ju = 0; εr = 0 J = 0; εr = 0