A R C H I V E S
o f
F O U N D R Y E N G I N E E R I N G
Published quarterly as the organ of the Foundry Commission of the Polish Academy of Sciences
ISSN (1897-3310)
Volume 7
Issue 4/2007
159 – 164
32/4
Evaluating the influence of selected
parameters on sensitivity of a numerical
model of solidification
N. Sczygiol, R. Dyja*
Institute of Computer and Information Sciences, Cz
ę
stochowa University of Technology,
D
ą
browskiego St 73, 42-200 Cz
ę
stochowa, Poland
*Corresponding author. E-mail address: robert.dyja@icis.pcz.pl
Received 04.07.2007; accepted in revised form 16.07.2007
Abstract
Presented paper contains evaluation of influence of selected parameters on sensitivity of a numerical model of solidification. The investigated model is based on the heat conduction equation with a heat source and solved using the finite element method (FEM). The model is built with the use of enthalpy formulation for solidification and using an intermediate solid fraction growth model. The model sensitivity is studied with the use of Morris method, which is one of global sensitivity methods. Characteristic feature of the global methods is necessity to conduct a series of simulations applying the investigated model with appropriately chosen model parameters. The advantage of Morris method is possibility to reduce the number of necessary simulations. Results of the presented work allow to answer the question how generic sensitivity analysis results are, particularly if sensitivity analysis results depend only on model characteristics and not on things such as density of the finite element mesh or shape of the region. Results of this research allow to conclude that sensitivity analysis with use of Morris method depends only on characteristic of the investigated model.
Key words: Computer-aided foundry; Sensitivity analysis; Morris method; Modeling of solidification; Intermediate model
1. Introduction
Numerical models currently used in practice to simulate phenomena of solidification are characterized by significant degree of complication. This complication is a result of, among other things, the number of parameters involved in the given model. It turns out that not all parameters have the same influence on the results which can be obtained doing computations with application of the the given model.
The problem of estimation of influence of the given parameter on the model is the main aim of sensitivity analysis. Many methods were conceived that permit to estimate influence of the
given parameter on the model. Existing methods may be divided into two groups of sensitivity analysis: local and global.
At present many methods of sensitivity analysis are used in practice, the most popular are: direct sensitivity analysis, Morris method [2], methods based on Monte Carlo method [3, 4], and FAST (Fourier Analysis Sensitivity Test) [5, 6].
It should be emphasized that, although results of local sensitivity analysis for the models applied in foundry were presented in numerous papers, global sensitivity analysis is used very rarely.
2. Description of the method
The method used in this work for estimation of sensitivity of a model due to change of given parameters is based mainly on Morris method. This method will be presented shortly. In order to get better understanding of the method the reader should consult references in which it was presented in details [7, 8].
Supposing that a model y=y(x) is given, where xis the vector of model parameters, one can define the matrix B*, whose every row corresponds to an individual set of model parameters. This matrix is evaluated according to the formula (1), whose individual components are presented later in the text.
(
)
[
2 * *2 *
* J ,1x B J , D J , P
B ⎟⎟ ⎠ ⎞ ⎜⎜ ⎝ ⎛ + − ⎟ ⎠ ⎞ ⎜ ⎝ ⎛ Δ +
= m mk mk
]
(1)
The process of formulating of the matrix B* starts with establishing basic parameters such as the quantity k, which is the number of examined model parameters. The next important quantity is the number
p, which corresponds to the number of points into which the range of variability of the considered parameter is divided. Assuming that model parameters vary in the range from 0 to 1, the following formula can be used: 1 1 − = Δ
p (2)
Vector x* of size k is formulated at random. Its every element is drawn from the set {0,1/(p-1)2/(p-1)...,1-Δ} with equal probability of selecting every element of the range.
The matrix Jm,k is entirely filled with ones. Its sizes are m rows and
k columns, where m=k+1. Similarly, the vector Jm,1 is filled with the value 1 and its size is m.
In the matrix B, having m rows and k columns, ones occur only under the main diagonal, whereas the rest of its elements are equal zero.
Elements of the square matrix D* of size m that are located on its main diagonal are drawn at random from the set {-1, 1} (the two elements have equal probability of occurrence). The other elements equal 0.
The square matrix P* of size k is the matrix of random permutations. In this matrix each column has exactly one element of value 1 and neither two columns have elements equal to 1 in the same row. Elements of the matrix which are not equal 1 have the value of 0.
The matrix B* formulated in this way is characterized by the following properties: each row corresponds to a set of model parameters, all its elements have values from the range from 0 to 1, only one element in two adjacent rows differs by Δ (either increase or decrease by this value may occur). Because elements of the matrix B*
vary in the range from 0 to 1, rescaling should be done in order to relate their values to the values of used parameters. This remark also concerns the value of Δ.
After the matrix B* is evaluated quotients are computed using formula (3) [9]. Depending on whether a parameter was increased or decreased by Δ , plus or minus sign appears in denominator:
( ) (
) ( )
( )
x x y x y x x x x x y xdi i i i k ⋅ i
Δ ±
− Δ
±
= 1,K, −1, , +1,K,
(3)
The quantity d is an indicator which says how big the influence of the i-th parameter is on the results. Of course, the bigger absolute value of this quotient, the bigger influence the given parameter has on the results of the model.
Full sensitivity analysis by the Morris method requires multiple repetition of the steps described in previous paragraphs. Then, supposing that the process of formulating the matrix B* was repeated r
times, the influence of the i-th parameter is computed by calculating an average from all r repetitions:
∑
= = r j ij i d r 0 1μ (4)
Additionally, it is possible to compute standard deviation for the i -th parameter:
(
)
∑
= − = r j i ij i d r 1 2 1 μσ (5)
Non-zero value of standard deviation indicates nonlinear influence of the i-th parameter. It is also evidence of interaction among individual parameters.
Since parameters of the examined model vary in arbitrary ranges, coefficients of the matrix B* must be rescaled to these ranges. In this work rescaling was done using the following formulae:
(
r)
i r i i r i r
i x x x x
x = min+ ⋅ max− min (6)
(
r)
i r i
i=Δ⋅ xmax−x min
Δ (7)
3. Description of the model under study
The examined model is a computational solver from the NuscaS system [10], which is used for simulating thermomechanical phenomena in solidifying castings. It is based upon the heat conduction equation with a source term, solved using enthalpy formulation of solidification [11]. The finite element method is applied for spatial discretization, which allows to obtain a system of matrix equations with the derivative with respect to time. Integration is performed using the two-step Dupont II scheme [12].
Table 1.
Examined physical parameters of the model Parameter
index
Name of the parameter Minimal value Middle value Maximum value Unit
1 density of casting material 2080 2600 3120 kg/m3 2 specific heat of casting
material 800 1000 1200 J/(kg·K)
3 heat conductivity of
casting material 80 100 120 W/(m·K)
4 latent heat of solidification 312000 360000 468000 J/kg
5 Brody-Flemmings
coefficient 2.4·10
-9
3.0·10-9 3.6 10-9 m2
6
heat exchange coefficient between environment and mould
800 1000 1200 W/(m2 ·K)
7
heat exchange coefficient through the layer separating casting and mould
800 1000 1200 W/(m2·K)
4. Examined parameters
In this work evaluation of influence of certain parameters on sensitivity analysis done by Morris method is presented. Effects of the number of elements in the finite element mesh, of the number of repetitions of building the B* matrix and of the various casting shapes were also studied.
Motivation of investigating the influence of the number of finite elements on the results of sensitivity analysis was finding out whether the selected method depends of the mesh element size in additional way, independent of accuracy of the results obtained from the model.
Another question studied in this paper was how repetitive the results are for various shapes of the domain. In order for sensitivity analysis to have practical significance, it is desirable that their results are repetitive for castings of different shapes.
The last examined quantity was the number of repetitions of formulating the matrix B* and its influence on precision of the results.
Sensitivity analysis was conducted each time for the model described in Section 3, for which it was assumed that the parameters vary in ranges given in Table 1. Table 2 lists parameters influence of which was not taken into consideration in sensitivity analysis. According to the fact that these parameters are connected with the phase change diagram, they cannot be changed freely and independently from one another. Additionally, in Table 2 physical parameters of the mould are included.
Table 2.
Physical model parameters not considered in sensitivity analysis Value Unit Name of the parameter
853 K solidus temperature 923 K liquidus temperature
933 K solidification temperature of pure base metal 821 K eutectic temperature
0.125 K equilibrium partition ratio 300 K temperature of the ambient air 7200 kg/m3 density of mould material
738 J/(kg·K) specific heat of mould material 30 W/(m·K) conductivity of mould material
5. Computer simulations and results of
sensitivity analysis
To conduct the analysis of influence of particular parameters it is necessary to choose suitable output quantity of the model. In the presented paper the examined quantity was the time of solidification, measured from the beginning of the simulation to the moment when the last portion of material solidifies. This time was evaluated with accuracy of +/- 0.2 s. Computer simulations were run for domains presented in Figures 1 and 2.
For every analyzed case it was assumed that in the range of variability of each parameter there are 4 points (p=4). The number of simulation needed to be conducted depends on the number of the studied physical model parameters k, as well as on how many times the matrix B* was created, and it is equal to r (k+1). Hence the number of computer simulations ranged between 80 for cases shown in Figures 3, 7, 8 and 9 through 128 and 320 for Figures 4 and 5 respectively, up to 640 for the case from Figure 6.
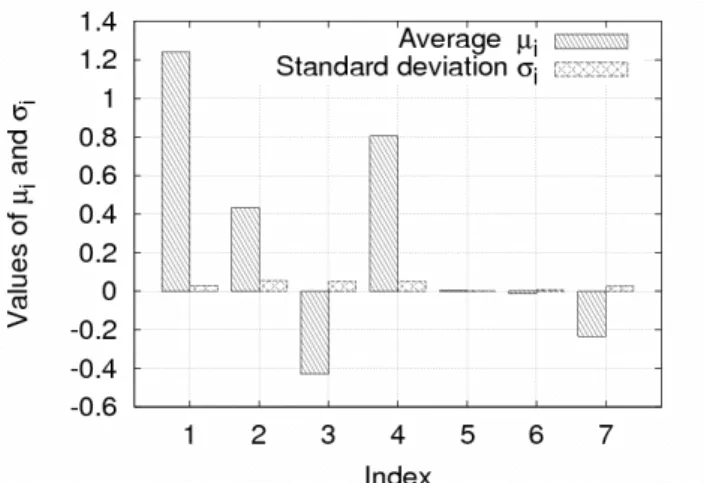
Results of the analyses are presented in Figures 3-9. In all these graphs the numbers under the bars care consistent with identical numbers from Table 1. These results correspond to increasing the number of creation of the B* matrix (Figures 3-6), to changing casting geometry (Figures 3 and 7), as well as to change of the mesh density (Figures 7-9).
In all cases remarkably greater influence of the casting density (parameter 1) and of the latent heat (parameter 2) on the solidification time is evident. On the contrary, influence of the Brody- Flemmings coefficient and of the heat exchange coefficient between the mould and the environment is small.
Fig. 1. Shape of domain 1
Fig. 2. Shape of domain 2
Fig. 3. Results of sensitivity analysis for the domain 1 divided into 2304 elements, the matrix B* created 10 times (r=10)
Fig. 4. Results of sensitivity analysis for the domain 1 divided into 2304 elements, the matrix B* created 16 times (r=16)
Fig. 6. Results of sensitivity analysis for the domain 1 divided into 2304 elements, the matrix B* created 80 times (r=80)
Fig. 7. Results of sensitivity analysis for the domain 2 divided into 2304 elements, the matrix B* created 10 times (r=10)
Fig. 8. Results of sensitivity analysis for the domain 2 divided into 5184 elements, the matrix B* created 10 times (r=10)
Fig. 9. Results of sensitivity analysis for the domain 2 divided into 9216 elements, the matrix B* created 10 times (r=10)
6. Conclusions
The presented results from a series of analyses indicate lack of dependence of certain sensitivity analysis parameters. In case of increasing the parameter r (the number the matrix B* is generated) obtaining identical results despite increasing r, may be explained as converging of the results to a certain fixed value. It should be noticed that increase of the number r causes increase of the number of required computer simulations. Therefore it is significant to obtain credible results for the smallest r number possible.
Independence of the results of sensitivity analysis from the domain shape is its valuable feature that makes it possible to utilize the results of sensitivity analysis multiple times.
The results did not change also in case of using a greater number of elements in the mesh. It should be noticed that change in this number influences accuracy of the results. Beside this fact, as it was shown on the presented graphs, results of sensitivity analysis by the Morris method are independent of mesh density.
References
[1] B. Cheng, L. Tong, Thermomechanically coupled sensitivity analysis and design optimization of functionally graded materials, Computer methods in applied mechanics and engineering 194 (2005), 1891-1911.
[2] M. D. Morris, Input screening: Finding the important model inputs on a budget, Reliability Engineering and System Safety 91 (2006), 1252-1256.
[3] F. Campologno, A. Saltelli, Sensitivity analysis of an envinronmental model: an application of different analysis methods, Reliability Engineering and System Safety, 57 (1997), 49-69.
[5] Saltelli, R. Bolado, An alternative way to compute Fourier amplitude sensitivity test (FAST), Computational Statistics and Data Analysis 26 (1998), 445-460.
[6] Y. Lu, S. Mohanty, Sensitivity analysis of a complex, proposed geologic waste disposal system using the Fourier Amplitude Sensitivity Test method, Reliability Engineering and System Safety 72 (2001), 275-291.
[7] M. D. Morris, Factorial Sampling Plans for Preliminary Computational Experiments, Technometrics, 33 (1991), 161-174. [8] Saltelli, S. Tarantola, F. Campologno, M. Ratto, Sensitivity
analysis in practice: a guide to assessing scientific models, John Wiley & Sons, Chichester, 2004.
[9] N. Sczygiol, R. Dyja, The use of Morris method in sensitivity analysis of the numeric model of solidification, Computer Methods in Material Science 7 (2007), 250-254.
[10] N. Sczygiol, Numerical modelling of thermo-mechanical phenomena in a solidifying casting and a mould, Wyd. Politechniki Częstochowskiej, Częstochowa (in Polish), 2000. [11] N. Sczygiol, G. Szwarc, Application of enthalpy formulation for
numerical simulation of castings solidification, Computer Assisted Mechanics and Engineering Sciences 8 (2001) 99-120.