THE RELATIONSHIP BETWEEN HUMAN RESOURCE, MANAGERIAL
PERFORMANCE AND THE ECONOMIC COMPETITIVENESS OF THE ENTERPRISE
DEMYEN SUZANA
PHD CANDIDATE, WEST UNIVERSITY OF TIMI
Ș
OARA,
FACULTY OF ECONOMICS AND BUSINESS ADMINISTRATION
suzana_demyen@yahoo.com
Abstract
Performance has become a topic increasingly discussed by experts in the field, therefore it becomes necessary for the company to have a number of competitive advantages that offers the opportunity to evolve in a positive way in the work developed. Both economical and contextual problems manifest themselves differently from one SME to another. The present paper tries to outline the general problems faced by SMEs in recent years, as well as the main relationship established between managerial performance of an enterprise, human resource and competitiveness.
Keywords: human resource management, performance, competitiveness, enterprise
JEL Classification : M54, J24
Acknowledgement
This work was cofinanced from the European Social Fund through Sectoral Operational
Programme
Human
Resources
Development
2007-2013,
project
number
POSDRU/159/1.5/S/142115 „Performance and excellence in doctoral and postdoctoral research in
Romanian economics science domain”
1. INTRODUCTION
In recent years, performance has become a topic increasingly discussed by experts in the field, especially by managers [2]. Be it the microenvironment we talk about, whether macroenvironment the one whose components put obstacles for the organization to achieve the desired results, it becomes necessary for the company to have a number of competitive advantages that offers the opportunity to evolve in a positive way in the work developed. Performance becomes a multilevel criterion on which exercises a number of factors with general or specific influence, depending on the main characteristics of the resources [2]. According to Niculescu and Lavalette [7], performance represents also a level of unstable potentiality, which determines the company to be competitive in its strategic segments [7]. Mainly, the relationship between performance and results is represented in the following figure, which states the mutual conditioning between the two concepts.
Professor Verboncu [10] lists the following aspects as factors that represent a condition for achieving a high level of performance in the organization:
- Competence of managers and contractors; - Organizational culture;
- The influence of macroenvironment - consisting of economic, political, technological, socio-cultural, demographic, legal factors.
Regarding the competence of employees and of the manager of an organization, literature reminds the forms under which it can be shown, namely: the given competences, ie the personal ones [10].
Fig. 1 - The relationship between performance and environment Source: Verboncu et al [10]
2 DIAGNOSIS OF BUSINESS ENVIRONMENT – A VIEW FROM THE TOP
These results are primarily the consequence of general management and of the activity of business administration. And the period of 2009-2011 also faced a number of challenges for economic, financial, and contextual nature [14], being identified by a number of difficulties that economic entities have had to face, with more success or on the contrary. Studies conducted by the National Council of Private Small and Medium Sized Enterprises in Romania have concluded, after analyzing a representative sample of companies, that the most important challenges that are not only of financial nature, but especially as related to the human resource sector [13].
These problems manifest themselves differently from one SME to another, taking into account a number of criteria, including size, length of the activity, regional affiliation [14] or business activity of the company. Official data from the study prepared by specialized bodies reveals that the main challenges HR domain are both providing necessary training and consulting firm and the nature of the employment and maintenance personnel in the organization.
In an increasingly competitive business environment, it is necessary to ensure that employees actually achieves maximum results and a high performance [11], professional training and therefore cannot be limited to a specific level, requiring ensure a continuity to support further development. However, getting advice is not seen as a task light [13], but rather as a challenge for Romanian companies, whether for the newly emerging, whether we are referring to those who already have a known tradition and experience in the work. However, this aspect increased in intensity and when referring specifically to the Western Region, given that the results of economic entities in this region settles it on a not very favorable position in the list of regions of development at national [13].
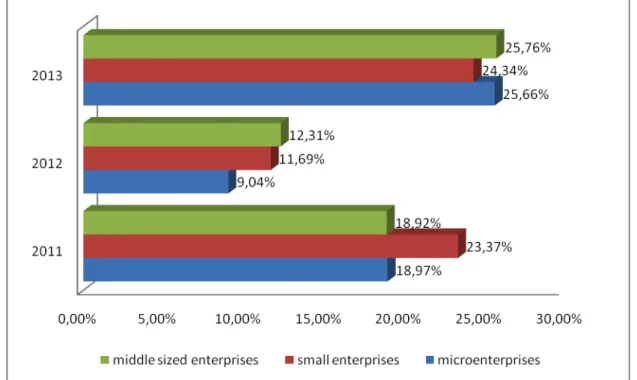
A level of performance is achieved only by providing a proper framework of motivation, which in often times can be achieved by providing an appropriate salary according to the level of training, assigned tasks or difficulty of the activities performed. While taking into account the time periods dominated by economic recession, wage increases have been very popular among employers, quite a few business units resorting to this type of staff motivation. Therefore, increasing employee remuneration is mentioned by a notable percentage of managers as a challenge, according to the schedule below.
Table 1 Difficulties encountered by SMEs by size
Microenterprises Small enterprises Middle size enterprises
2011 2012 2013 2011 2012 2013 2011 2012 2013
Obtaining the necessary training and consulting
3,89% 5,13% 5,31% 2,45% 5,85% 7,49% 9,01% 3,08% 12,12%
Hiring, training and retaining staff
22,54% 25,04% 28,81% 23,37% 24,62% 26,97% 28,83% 27,69% 28,79%
Increasing wage costs
18,97% 9,04% 25,66% 23,37% 11,69% 24,34% 18,92% 12,31% 25,76%
Source: data processing made by the author, using the information offered by the White Chart of SME’s editions - 2011, 2012, 2013 [13]
PERFORMANCE
ENVIRONMENT
ORGANIZATIONAL
CULTURE
COMPETENCES
OF MANAGERS
CHANGES IN THE MANAGEMENT
Fig.2 Increasing wage costs by category of SMEs
Source: data processing made by the author, using the information offered by the White Chart of SME’s editions - 2011, 2012, 2013 [13]
If we look at the difficulties faced by SMEs according to their field of work (the following table), we conclude the following:
- The most important of the three challenges listed previously is unanimously recognized to be hiring and training the right people. Whatever the field of activity would be that question, it seems to be the most serious problem facing an economic entity. On the other hand, obtaining advice and training, although it is mentioned as itself a challenge, it is seen as a challenge, only a small percentage of enterprises perceive it, and although varying from year to year, it does not exceed than in rare occasions 8% of organizations.
- For enterprises of industrial specialization, we observe a stagnation of the percentage of SMEs that consider getting training as a challenge, but a reduction in the percentage of those who consider human resources training or increased salary expenses as a challenge. Also we identified that in construction are much larger concerns regarding obtaining advice while emerging challenges increase as adequate training and they, in turn, important.
- Trade or services are dominated by difficulties in terms of increasing wage costs, this is widely seen as a significant challenge, while training staff and maintaining it becomes a major issue for tourism businesses. The latter, however, indicates, by a rate of 0% that training employees is a challenge not so high, the percentage of firms concerned with this aspect down from 4.55% in 2011 to 0% in 2013.
Focusing on the quality of our employees, the competitive advantage of SMEs, we find that at the beginning of the period, firms of 10 to 15 years old appreciate more the human factor as an advantage for the company. This changed over the years, all kinds of businesses coming to appreciate this. However, if considering discussing SME categories, each of the three size classes vary an appreciation of human resource advantage [13]. Their importance increases while still being considered a vital factor especially in services, transport and construction.
Table 2 Quality of employees appreciated as competitive advantage of SMEs
2011 2012 2013
According to the age of the SME
0 – 5 years 15,89% 26,51% 20,56%
5 – 10 years 16,53% 29,44% 29,87%
10 – 15 years 19,26% 29,19% 30,77%
over 15 years 12,83% 29,15% 24,95%
According to the size of the enterprise
Microenterprises 14,75% 28,64% 25,13%
Small enterprises 18,70% 27,08% 31,09%
Middle sized enterprises 12,73% 30,77% 30,30%
According to the field of activity
Constructions 17,35% 29,41% 28,40%
Commerce 13,95% 25,62% 21,75%
Transportation 10,97% 29,01% 28,00%
Tourism 13,64% 28,89% 19,40%
Services 21,45% 33,13% 32,30%
According to performance
Much better Better Identical Weaker Much weaker
2010 2009 2011/ 2010 2012/ 2011 2010/ 2009 2011 / 2010 2012/ 2011 2010 / 2009 2011 / 2010 2012/ 2011 2010 / 2009 2011 / 2010 2012/ 2011 2010 / 2009 2011 / 2010 2012/ 2011 10,00 % 43,33 % 25,81 % 19,11 % 33,9 1% 33,33 % 18,4 8% 27,48 % 25,94 % 15,8 6% 26,8 3% 22,91 % 12,09 % 28,0 7% 18,29 %
Source: data processing made by the author, using the information offered by the White Chart of SME’s editions - 2011, 2012, 2013 [13]
Performances gained by companies considering the human factor indicator were predominantly the same in 2010 compared to 2009, but much better in 2011 compared to those obtained in the previous year. This trend continued to be in 2012, when 33.33% of the company stood by better results than the previous year, ie 25.81% reported a much better purpose.
A high level of performance cannot still be achieved by accident. For it has been taken a number of measures, both positive and negative, among which were:
- Reduction of costs - in about 31% of businesses
- Focus on providing qualified personnel and necessary business - about 7%
- Ensure proper preparation and training of employees in the company, if 5% of SMEs
- Negative measures taken aimed among other things the decrease of the number of employees, if the 0.7 to 1.8% of businesses.
The Western Region does not totally ally for these trends, the percentages recorded in some cases exceeding the overall average. Cost reduction is therefore a measure adopted in about 40% of the organizations, more attention than national - in 9.65% of SMEs, training is given to employees, while a similar percentage of the general - 7% businesses, ensuring appropriate human herd.
Cost reduction is an activity commonly addressed in all SMEs, regardless of their age market. The percentages in this measure is addressed varies from one category to another, and from one year to another, ranging around 30%. We note that during the years 2011 and 2012, medium-sized enterprises are often implementing this measure, and micro-enterprises, since 2013 is a measure applied especially in industrial and commercial, in the year 2013.
Staff training acquired while growing importance, however, in the current economic climate, very few companies can afford to be self-consistent in this regard. According to Jardon and Gonzales [4], “human capital is not sufficient to improve significantly the SMEs’ performance“ [4] but “high skilled people are able to perform more efficiently their job and consequently they can reduce their unitary cost. Capabilities and, particularly, creativity of workers is a consequence of HC and yields more valuable products or services” [4].
From this point of view, we examine the evolution of how this activity is implemented in enterprises according to the following charts:
!"!!#$ %"!!#$ &"!!#$ '"!!#$ ("!!#$ )"!!#$ *"!!#$ +"!!#$ ,"!!#$ -"!!#$ %!"!!#$
&!%%$ &!%&$ &!%'$
./012345$ %"&'#$ '"*!#$ '"!%#$
67/2341687/2$ ("&%#$ '"-&#$ %"&'#$
6799:46:$ &")'#$ '"(-#$ %"((#$
34;/2<743;87/$ '"+!#$ *"%%#$ %"'&#$
3714.29$ %"!&#$ *"*+#$ %"(-#$
2:4=.6:2$ ,"*)#$ -",&#$ '"(!#$
Source: data processing made by the author, using the information offered by the White Chart of SME’s editions - 2011, 2012, 2013
Thus, we conclude that a higher level of performance will generate better results in practice, as long as better results become a motivational tool for determining a higher level of performance. Individual performance analysis is a core activity of human resource management, "assessing the degree to which the employee fulfills responsibilities incumbent in relation to posts" [6]. It is necessary to perform a "high impact activity and importance," positive or negative results on the performance of human resources in a company showing their effects on the whole mechanism managed. Be it the processes of recruitment, selection, whether we refer to professional, planning, motivation and reward system, performance can be identified by analyzing the weaknesses of human resources department, but also to determine the deficit or excess personal estimate the expected performance levels, the need for professional training, incentive pay or productivity increase.
In the vision of managers, based on their perception upon the business environment, the major difficulties listed in the official surveys were the following: excessive taxation, bureaucracy, high borrowing costs and instability of the national currency [13].
According to various authors [1], [5], aligning human resources with business gains a high importance in order to obtain competitve advantages [9], [11].
The overall performance of SMEs, compared to the previous year, varied over and this can be at best highlighted by the comparisons that can be made between current levels of indicators and those obtained in previous years. When discussing about the Western region as a whole, it is necessary to define at least three different time periods:
1 A comparison between the years 2010/2009 2 A comparison between the years 2011/2010 3 A comparison between the years 2012/2011
The information provided by the White Chart of SME’s and other official surveys developed with the purpose of finding the perception of top management regarding the overall evolution of the enterprise [13], show that in 2010 no company has obtained much better results than in the previous year, but the situation improved in the next period, reaching a rate of 2.73% in 2011 compared to 2010 and 3.60% in 2012, compared with an average result of 2011. A medium percent of companies reported better results since 2010, ie 17.81%, this sample gradually increasing to 27.03% in 2012. In contrast to the outcome lies the situations of the companies that have been weaker or much weaker in comparison to previous years. The reports show us much poorer results for the 16.44% of organizations in 2010, a percentage that drops to 0% two years later. Also, poorer results than the previous year are obtained for a large number of companies; representing 35.62% of the total in 2010, compared with 2009, 34.55% in 2011 and 28.83% in 2012. Most businesses have stagnated, however, as reflected in the 30.14% (2010), 37.27% (2011) or 40.54% (2012) of the small and medium sized companies.
A comparison made according to the criterion representing the activity age of SMEs indicates that there is a specific pattern that the companies get better or less good, based on this criterion [13]. Whether an organization is present in business for 5 years or over 15, this is not a guarantee that the results obtained in the future will be better, nor a threat that the levels achieved will be weaker.
Also making an analysis by company size, we can list the following conclusions:
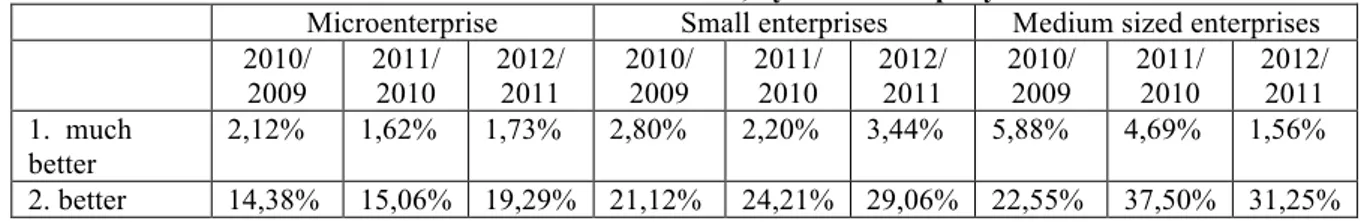
- The overall performance of the microenterprises has evolved both positively and negatively. Thus, the time interval 2009 - 2012 we can identify identical performance for a growing number of organizations. Companies that generate better results over time are becoming less numerous than those which identify much weaker results at the end of the period of analysis. The year 2010, compared to 2009, represents the maximum in terms of very good performance, as well as much weaker ones. The year 2012, however, identifies with the highest percentages corresponding to the identical or better performance criteria.
- Small businesses have experienced a better evolution than the microenterprises. We can thus say that the end of the range marks a significant step forward, much better results being found for the 3.44% of businesses compared to the previous year, while 29.06% of organizations scored a better result than in 2011 and the same result was found in 42.50% of cases.
- Medium-sized enterprises, on the other hand, do not share the same progress, most stagnating, compared with the previous year. The percentage of those who obtain better results is decreasing from 5.88% in 2010 to 1.56% in 2012, but this trend is shared also by those with poor outcomes, reducing their number considerably.
Table 3 Performance in SMEs, by size of company:
Microenterprise Small enterprises Medium sized enterprises 2010/
2009
2011/ 2010
2012/ 2011
2010/ 2009
2011/ 2010
2012/ 2011
2010/ 2009
2011/ 2010
2012/ 2011 1. much
better
2,12% 1,62% 1,73% 2,80% 2,20% 3,44% 5,88% 4,69% 1,56%
3. identical 26,64% 44,53% 50,71% 25,16% 35,85% 42,50% 25,49% 34,38% 43,75% 4. weaker 34,94% 28,43% 20,08% 37,58% 26,42% 14,06% 26,47% 15,63% 14,06% 5. much
weaker
21,91% 10,36% 8,19% 13,35% 11,32% 10,94% 19,61% 7,81% 9,38%
Source: data processing made by the author, using the information offered by the White Chart of SME’s editions - 2011, 2012, 2013 [13]
We note that the results of industrial enterprises have improved over the period considered, as well as those of companies in the construction sector, which however cannot be expressed in the field of services, where the trend is the decline of good performances stagnation in more than half of the cases.
Human resource management, according to authors in literature [8], “which deals with recruiting, developing, and keeping the best people, now has the opportunity to move out of the background into the mainstream of organizational strategy and management. In a world in which all work is knowledge work and intellectual capital is crucial for economic success, it is logical that the ability to attract, retain, and use the talents of people provides a competitive edge [O’Reilly & Pfeffer, in Poloski [8].
Company performances are often defined by the results generated by the effective use of the number of employees. The analysis of economic indicators also assumes the analysis of using human resource in the firm. Data provided by CNPIMMR splits the evolution of dynamics of human resources in an enterprise in five categories, namely:
- Significant growing - Easy growing - Stagnation - A slight decrease - Significant decrease.
The data in the table below indicates that, over the period considered, most businesses, regardless of their age on the market, have stagnated in terms of number of employees. Very few of them have proceeded to a significant increase of staff, such as being found in less than 0.5% of case in 2012. On the other hand, analyzing this information, we note a significant decrease in 2012 among firms with an experience of over 10 years. Stagnation prevails in the analysis based on size criteria, in which case we conclude that hiring new staff or the old redundancies were not part of the initial strategy of the firms, reducing staff following the sharp decline particularly pronounced for medium enterprises, rising from 9.28% in 2010 compared to 2009, to 1.35% in 2012 compared to 2011. During 2012, the fewest rate of new employment occurred in the industry, and most staff reductions - in the field of trade.
The Western Region had evolved not much different from the national average, comparison chart is illustrated as follows:
Fig. Number. 4 - Evolution of the number of employees in SMEs in the West Region between 2009-2012 Source: data processing made by the author, using the information offered by the White Chart of SME’s editions -
Beyond analyzing the evolution of the number of employees, we analyze the economic performance based on another indicator, namely the profitability of the enterprise and we refer to the values shown in the table below. Therefore we conclude that the size of the recorded overall profitability of the company marked stagnation in most of the cases. The period 2009 - 2012 is therefore dominated for about 50% of the businesses, by a maintaining level of profitability. Increases or decreases are also present in the case of about 25 to 30% of firms. For microenterprises, all years of analysis prevails the maintaining profitability for the 35-45% of the companies. However, over 35% of them show a downward trend, the increase in profit being found in the case of only 19% of enterprises.
Small enterprises follow about the same prototype, the difference being noticed in the case of medium-sized enterprises, where take place significant fluctuations from one year to another, without following a particular pattern.
The economic results in the Western Region varied from year to year, without following a typical development model. Thus, between 26 and 34% of companies fall into stagnation constantly while the percentage of firms that increase their level of profitability is decreasing. Only 14.06% of businesses managed in 2012 to benefit from a slight increase, while a significant increase is gained only by 1.56% of SMEs.
To demonstrate competitiveness, companies need to identify a number of advantages, among which we can mention the following aspects:
- The ratio between price and quality identified as the lead advantage in half of total number of the small and medium enterprises. This issue was considered in 2011 by 47.98% of SMEs, their number increasing over time, the percentage of firms reaching 58.22% in 2012.
- The price of products or services is mentioned as competitive advantage a smaller percentage of firms - 36%.
- Quality of employees is considered to be a competitive advantage only a rather small percentage of enterprises - 28.26% in 2012, while the quality of management practices is considered by a smaller number of companies - up to 7, 58%.
CONCLUSIONS
Speaking of human resources in general, it is considered in most cases as a key success factor, but whose recovery needs to take into account the following criteria:
- Qualified and well-trained employees
- Ensure of optimum level of satisfaction of employees, in order to generate a high level of loyalty - Providing support services for workload management employees
Taking part each of these criteria, we find the following:
1 Having qualified employees trained, skilled and able to perform multiple tasks is a feature appreciated by about half of SMEs, whether we refer to the "young" or those with "experience" in the business.
2 The issues referred to in paragraph 1 shall be assessed in a high all groups of enterprises, but the medium show an increased interest in this, 52.31% of SMEs concerned this ruling
3 Although the presence in the enterprise of employees with higher education is valued by businesses in all areas of activity, the tourism that pays special attention given to this aspect
4 Generating a high level of loyalty of employees becomes a target especially for businesses with more than 15 years old
5 companies in the transport sector pays more attention to their employees' loyalty
REFERENCES
[1] Bontis, N., Keow, W. C. C., & Richardson, S. (2000). Intellectual capital and business performance in Malaysian industries. Journal of Intellectual Capital, 1(1), 85–100.
[2] Currie Donald, Introducere în managementul resurselor umane, Editura Codecs, București 2005
[3] Demyen Suzana, Lala Popa Ion, Gender disparities regarding wage as a motivation tool in the current economic context, Annals of the “Constantin Brancusi” University of Targu Jiu, Economic Series, Issue 1/2014
[4] Jardon Carlos, Gonzales Loureiro Miguel, Human Capital as Source for Sustained Competitive Advantages in SMEs: A Core Competencies Approach, Economia. Seria Management Volume 16, Issue 2, 2013
[5] Lopez-Cabrales, A., Valle, R., & Herrero, I. (2006). The Contribution of Core Employees to Organizational Capabilities and Efficiency. Human Resource Management, 45(1), 81–109.
[6] Mathis RI, Nica PC, Rusu C, Managementul resurselor umane, Editura Economica, București, 1997
[7] Niculescu Maria, Lavalette Georges, Strategii de crestere, Editura Economica, București, 1999
[8] Pološki Nina Vokić Maja Vidović, HRM as a significant factor for achieving competitiveness through people – The case of Croatia FEB WORKING PAPER SERIES Paper No. 07-01
[9] Unger, J. M., Rauch, A., Frese, M., Rosenbusch, N. Human capital and entrepreneurial success: A meta-analytical review. Journal of Business Venturing, 26(3), 341–358, 2011
[10] Verboncu Ion, Apostu Mihai Caius, Gogirnoiu Denis Mugurel, Management: eficiență, eficacitate, performanțe, Editura Universitară, București, 2014
[12] Zula, K. J., & Chermack, T. J. Development and initial validation of an instrument for human capital planning. Human Resource Development Quarterly, 19(1), 7–33. 2008
[13] ***The White Chart of SMEs, National Council of Private Small and Medium Sized Enterprises, editions 2011, 2012, 2013
![Fig. 1 - The relationship between performance and environment Source: Verboncu et al [10]](https://thumb-eu.123doks.com/thumbv2/123dok_br/18242909.341395/2.892.101.811.84.349/fig-relationship-performance-environment-source-verboncu-et-al.webp)