Vol. 11, No. 2, May/Aug., 2014 pp. 379-396
ISSN online: 1807-1775
DOI: 10.4301/S1807-17752014000200009
_____________________________________________________________________________________________ Manuscript first received/Recebido em: 17/07/2012 Manuscript accepted/Aprovado em: 21/03/2014
Address for correspondence / Endereço para correspondência
Marcos de Moraes Sousa, Professor in Administration, Federal Institute of Goiás; Ph.D. candidate, University of
Brasília. Works on projects related to public administration, quantitative methods, and analysis of organizational performance. E-Mail: [email protected]
Reginaldo Santana Figueiredo, Post-doctoral fellow in Modeling and Simulation, Department of Industrial and
Systems Engineering, Texas A&M University, IE-TAMU, USA (2002), Ph.D., Industry Economics, Federal University of Rio de Janeiro (UFRJ); Associate Professor, Federal University of Goiás—UFG. He was also a consultant for the Brazilian government on the analysis of production chains and for the Department of Recreation, Park and Tourism Science of Texas A&M University, in the analysis of tourism's socioeconomic impact, using modeling and simulation techniques. E-mail: [email protected]
CREDIT ANALYSIS USING DATA MINING: APPLICATION IN
THE CASE OF A CREDIT UNION
Marcos de Moraes Sousa
Instituto Federal Goiano Campus Ceres, Goiás, Brasil
Reginaldo Santana Figueiredo
Universidade Federal de Goiás, Goiás, Brasil
_____________________________________________________________________
ABSTRACT
The search for efficiency in the cooperative credit sector has led cooperatives to adopt new technology and managerial knowhow. Among the tools that facilitate efficiency, data mining has stood out in recent years as a sophisticated methodology to search for knowledge that is “hidden” in organizations' databases. The process of granting credit is one of the central functions of a credit union; therefore, the use of instruments that support that process is desirable and may become a key factor in credit management. The steps undertaken by the present case study to perform the knowledge discovery process were data selection, data pre-processing and cleanup, data transformation, data mining, and the interpretation and evaluation of results. The results were evaluated through cross-validation of ten sets, repeated in ten simulations. The goal of this study is to develop models to analyze the capacity of a credit union's members to settle their commitments, using a decision tree—C4.5 algorithm and an artificial neural network—multilayer perceptron algorithm. It is concluded that for the problem at hand, the models have statistically similar results and may aid in a cooperative's decision-making process.
1. INTRODUCTION
This article describes the development of models to analyze the capacity of a credit union's associates to settle their commitments. Data mining techniques were used to develop the models.
To construct the models, the actual database of cooperative borrowers from a SICOOB (Sistema Cooperativo Brasileiro—Brazilian Cooperative System) credit union was used. It must be stressed that such data are difficult to access and collect.
A credit cooperative or union is a society and must be guided by a social purpose. However, it is also a financial institution and is regulated by norms imposed by the National Monetary Council of Brazil and the Brazilian Central Bank. Moreover, a credit union must aim to remain in the market permanently, which requires that resources be managed efficiently.
Cooperative Movement may be classified according to two concepts: the Rochdale principle, which aims to transform society and reform man; and the theoretical principle, developed at the University of Münster (Germany), which uses the tools of business administration science and views the cooperative as a modern enterprise (Pinho, 2004).
From the theoretical perspective, the Münster theory is the best developed. It is also known as the economic theory of cooperative cooperation, and its origins lie in the Institute for Cooperative Research at the University of Münster in Germany. In
opposition to the Rochdale principle’s doctrinal assumptions, professors at the University of Münster, together with Latin American scholars, developed a “school” with methodological foundations that trace back to critical rationalism (Pinho, 2004).
Pinho (1982, p. 75), following Bettcher, exposes the following concept of the cooperative, based on the axioms and assumptions of the Münster theory:
“Cooperatives are groups of individuals that defend their individual economic interests by means of a company that they jointly maintain”1. In this context, Frantz (1985:56)
adds that the cooperative may also be understood as embodying a “[...] competition strategy aimed to maximize the results of each producer's individual economic action
[...]”.
This study looks at credit unions from the perspective of the theoretical cooperative movement and, based on its assumptions and axioms, it finds that analyzing information for decision-making is a central condition. Tools and methodologies aimed at analyzing managerial information have greatly evolved in recent decades.
Credit-union management is very complex because it must balance cooperative
members' yearnings and needs while competing in the market. A credit union’s
characteristics of being an association of members, while also being a company in the market, must remain balanced.
The number of cooperative members and unions has been slowly increasing. According to data from the Organization of Brazilian Cooperatives (Organização das Cooperativas Brasileiras—OCB) (2014), there are currently more than 1,047 single credit cooperatives and 4,529 points of service in Brazil. The SICOOB is the largest cooperative credit system in Brazil, with 529 single cooperatives and 1,949 cooperative service points (Portal do Cooperativismo de Crédito, 2014).
The dynamic and competitive environment of Brazil's financial market, together with recent changes in credit offerings, demands a professional posture, which leads credit unions to adopt the use of new technologies and management knowhow.
Oliveira (2001) indicates that the professionalization of cooperative members and unions is a relevant trend. The sector has developed quickly, adopting an integration strategy using central cooperatives; thus, it must be tuned in to the most efficient management tools.
Credit analysis is one of the most important issues for financial institutions. Chaia (2003) stresses the importance of defining the type of analysis to be conducted and its coverage, and further warns of the dangers of copying and using other institutions' models, thus arriving at inadequate assessments.
One of the foremost methods of credit assessment used by financial institutions is credit scoring. Chaia (2003, p. 23) defines this model as the use of statistical tools to identify the factors that determine the probability of a client going into default and notes that their main advantage is that “[...] grant-related decisions are made based on
impersonal and standardized procedures, generating a higher degree of reliability”.
Given the previously discussed concept of cooperative, the use of such objective methodologies—such as credit scoring—in granting credit is highly relevant. Decisions made solely by evaluating subjective assessments are avoided. Koh, Tan, and Goh (2006) tie the progress of credit scoring to increased competitiveness, advances in computational technology, and the exponential growth of large databases.
Mester (1997) notes that model exactness, current data, and model evaluation and readjustment are some critical factors in credit scoring and that flaws in these factors limit the use of the model. Given that lending is one of credit unions' central functions, the analysis of that function is fundamental to protecting the cooperative's collective assets.
Obtaining tools that classify and help predict the behavior of future loans is fundamental to credit management, helping to reduce process subjectivity, allowing more efficient resource allocation, and resulting in quicker responses to proposals.
Oreski & Oreski, 2014; Saberi et al., 2013; Wang, Ma, Huang, & Xu, 2012; Xiong, Wang, Mayers, & Monga, 2013; Yap, Ong, & Husain, 2011; Zhong, Miao, Shen, & Feng, 2014; Zhou, Jiang, Shi, & Tian, 2011; Zhu, Li, Wu, Wang, & Liang, 2013).
Despite growing interest, there is still little application of this tool in cooperatives. Khatchatourian and Treter (2010) apply fuzzy logic to their analysis of the financial performance of production cooperatives in the Brazilian state of Rio Grande do Sul. Zhu, Li, Wu, Wang, and Liang (2013) use a support vector machine in their credit analysis of a credit union in Barbados.
Currently, there are several data mining techniques available. Therefore, the intention here is to examine which data mining methodology provides the best
credit-analysis results for credit unions. To this end, this study’s objective is to determine
whether a data mining model can perform well for classifying and predicting credit unions' credit management.
2. THEORETICAL FRAMEWORK
The term knowledge discovery in databases (KDD) was first used in 1989 to stress that knowledge is the final product of the discovery process in databases (Fayyad, Piatetsky-Shapiro, & Smyth, 1996).
Until 1995, the terms KDD and data mining were understood by many authors as synonymous (Lemos et al., 2005). Fayyad et al. (1996) defines and distinguishes KDD and data mining as follows: the former refers to the general process of discovering useful knowledge from data, whereas the latter refers to the specific application of algorithms to extract patterns and models from data. In the view of these authors, data mining thus is a step in the KDD process that consists of applying algorithms in the production of a particular set of patterns and models.
Fayyad et al. (1996) refer to patterns as model components. This study used the concept of model defined by Pidd (1998, p. 23): “A model is an external and explicit
representation of part of a reality, observed by a person who wishes to use that model to understand, alter, manage, and control part of that reality”.
Goldschmidt and Passos (2003, p. 6) split KDD activities into three groups: (i)
technological development, a group that incorporates “[...] the initiatives for
conception, betterment and development of algorithms, support tools and technologies
[...]” into the KDDprocess; (ii) KDDexecution, a group composed of activities related to using algorithms, tools, and technologies developed in the search of knowledge; (iii) application of results, as a group that consists of the models developed in the KDD execution, in a such way that “[...] the activities turn toward the application of results in the context in which the KDDprocess was conducted”.
2013; Lemos et al., 2005; Nie et al., 2011; Wang et al., 2012; Yap et al., 2011); (c) neural networks (Akkoç, 2012; Chen & Huang, 2011; Koh et al., 2006; Lai et al., 2006; Nie et al., 2011; Oreski & Oreski, 2014; Saberi et al., 2013; Wang et al., 2012); (d) support vector machines (Bhattacharyya et al., 2011; Nie et al., 2011; Xiong et al., 2013; Zhong et al., 2014; Zhu et al., 2013); and (e) ensemble methods (Abellán & Mantas, 2014; García et al., 2012; Marqués et al., 2012; Nie et al., 2011; Wang et al., 2012).
The studies' real application contexts were obtained from organizations in Canada (Xiong et al., 2013), Germany (Han et al., 2013; Koh et al., 2006), Croatia (Oreski & Oreski, 2014), Peru (Cubiles-De-La-Vega et al., 2013), China (Nie et al., 2011), Turkey (Akkoç, 2012), and Barbados (Zhu et al., 2013). Credit analysis using data mining is still rare in Brazil: Lemos et al. (2005) find the same methodology being employed for bank credit analysis, using a branch office of Banco do Brasil as their locus.
Decision trees are one of the most prominent and popular data mining methods (Wang et al., 2012). According to Lemos et al. (2005, p. 229), a decision tree is the only method that provides results in a hierarchical manner; i.e., “[...] the most relevant
attribute is placed in the first node of the tree, and less relevant attributes are placed in
subsequent nodes”. A decision tree is therefore a structure that is used to split a large amount of data into successive, smaller sets by applying a sequence of decision rules (Berry & Linoff, 2004).
The construction of decision trees is especially attractive in the KDD context, which according to Gehrke (2003) is attributable to the following reasons: intuitive and easy-to-understand results; non-parametric properties that are therefore applicable to exploratory treatments; relatively fast construction when compared to other methods; and accuracy that can be compared to the accuracy of other models.
Decision trees are commonly converted into decision rules. A decision tree may be observed as:
[...] a graph in which each non-leaf node represents a predicate (condition) involving an attribute and a set of values. The leaf nodes correspond to the attribution of a value or set of values to a problem attribute (Goldschmidt & Passos, 2005, p. 57).
In light of this observation, paths in the tree correspond to rules of the type, “IF
<conditions> THEN <conclusion>”. Several algorithms have been developed based on
the induction of decision trees, among which the following stand out: C4.5, CART (classification and regression trees), QUEST (quick, unbiased, efficient statistical trees) and CHAID (chi-square automatic interaction detectors).
fostered mainly by advances in information technology (Braga, Carvalho, & Ludermir, 2000).
In Goldschmidt and Passos's (2005, p. 175) view, ANNs can be observed as
“[...] mathematical models inspired by the working principles of biological neurons and
the brain's structure”. Such models, according to those authors, allow the simulation of
human abilities such as learning, generalizing, associating, and abstracting.
Braga et al. (2000, p. 1) define ANNs as “distributed parallel systems composed
of simple processing units (nodes) that compute some given (usually non-linear) mathematical function, [...] arranged into one or more layer and interconnected by a large number of connections [...]”
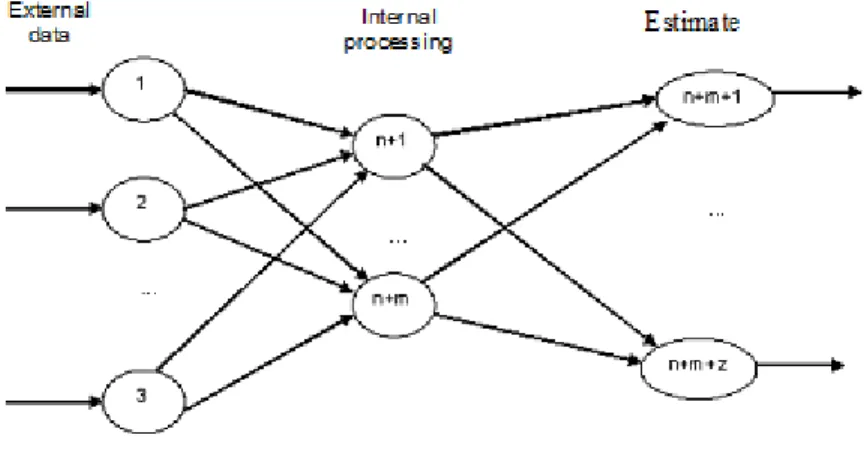
An ANN's structure therefore consists of neuron layers and weighted connections. As shown in Figure 1, neurons are represented by nodes and weighted connections are represented by arrows.
Figure 1 – ANN architecture
Source: Goldschmidt & Passos (2005).
Typically, there are three stages of ANN processing: the input layer, in which the data are received; the internal layer, usually called the hidden layer, which is responsible for processing the data and may consist of more than one actual layer; and the output layer, which provides the result (Larose, 2005).
The first step when applying ANNs is the network's learning phase, in which parameters are adjusted. This learning may be of two types: supervised or unsupervised. The first type occurs when output (or target) variables' values are provided, the second type occurs in the absence of those values.
multivariable functions, self-organization, the process of time-series, the possibility of using a large number of input variables, and the possibility of using samples. Because the model is considered non-parametric, these authors further stress, “[...] there is no
great need to understand the process itself”. However, these authors also consider this
last aspect to constitute the primary criticism of the model; i.e., the model's inability to clarify how its results are generated. Due to this peculiarity, ANNs are also called
“black boxes”.
3. METHODOLOGY
In this research, we opted to use case studies, which according to Yin (2010), are adequate to study contemporary events in a real-life context when controlling variables becomes more difficult for the researcher. This case study is unique and contemplates one unit of analysis, which involves one Credit Union of the SICOOB system—structured to contemplate investigation into the union from the perspective of theoretical cooperative movement.
The cooperative's database was used to evaluate the credit analysis system's performance. This database comprises the historical data of natural persons' analyses from 2003 to 2007. Due to a change in the information system, it was not possible to gather data from before this period.
Data referring to credit analysis is highly confidential and strategic, due to banking secrecy and the risk of competitors acquiring the data. This makes such data very difficult for third parties to obtain. The choice to study a cooperative was therefore due to its willingness to provide the data.
The cooperative currently uses the SisBr application of the SICOOB system as a credit analysis tool. This application contains the information used by management and the board of directors to make decisions about whether to grant credit.
The study followed the steps suggested by Fayyad, Piatetsky-Shapiro, and Smyth (1996) for the knowledge discovery process: data selection, data pre-processing and cleanup, data transformation, data mining, data interpretation, and the evaluation of results.
To reach its goals, this study was based on the activities involved in conducting KDD, as discussed by Goldschmidt and Passos (2005). Among the available data mining techniques, neural networks and decision trees were used, both of which are common in empirical studies.
3. RESULTS
This section describes the simulation results of the techniques investigated in this article—namely, the decision tree and ANN techniques—along with the statistical tests comparing them.
No missing values are found in the database. Chart 01 shows the structure of the constructed database, together with its variables and their possible values.
Chart 01 - Database structure
CODE VARIABLE VALUE
01 Member code Numerical key, unique for each member
02 Gender 1= male 2= female
03 Age Numerical value
04 Level of education
1= graduate 2= complete tertiary 3= incomplete tertiary 4= complete secondary 5= incomplete secondary 6= complete primary 7= incomplete primary
05 City Name of city of residence
06 Birthplace Name of city of birth
07 Place of residence 1= urban area 2= rural area
08 Primary work/activity Name of work/activity
09 Marital status
1= Married 2= Single 3= Widowed 4= Legally divorced 5= Other
10 Capital Numerical value
11 Relationship 1= with the cooperative for more than 3 years 2= with the cooperative for 1 to 3 years 3= with the cooperative for less than 1 year
12 Transaction conduct 1= normal 2= occasional delays
3= constant delays/renegotiations
13 Years of experience in activity/work 1= more than 5 years 2= from 3 to 5 years 3= less than 3 years
14 Records check 1= no restrictions 2= justified, irrelevant restrictions
3= relevant or unjustified, irrelevant restrictions
15 Record information at the cooperative 1= up-to-date and reliable record 2= up-to-date and unreliable record
3= information is not up-to-date or is missing
16 Purpose of the operation
1= support and investment 2= financing of assets
Chart 01 - Database structure (Cont.)
CODE VARIABLE VALUE
17 Operation guarantees
1= mortgage—social capital 2= chattel mortgage/warrants 3= pledge/collateral
4= personal
18 Liquidity guarantee
1= high liquidity guarantee (sale in less than 6 months) 2= moderate liquidity guarantee (sale in 6 to 12 months) 3= personal or low liquidity guarantee (sale in more than 12 months)
19 Frequency with which the member performs (active) transactions 1= never 2= frequently 3= permanently
20 Operation value
1= up to 1% of adjusted net worth (ANW) 2= from 1.01% to 2% of ANW
3= from 2.01% to 3% of ANW 4= more than 3% of ANW
21 Level of commitmenton member's net income —installments 1= up to 20% of average net income 2= from 20%-30% of average net income 3= more than 30% of net income
22 Personal net assets minus total liability 1= more than 4 times 2= from 2 to 4 times
3= no personal equity or less than 2 times
23 Total liability in relation to annual net income 1= less than 2 times 2= from 2 to 4 times 3= more than 4 times
24 Total liability in relation to paid-in capital
1= less than 4 times 2= from 4 to 8 times 3= from 8 to 12 times 4= more than 12 times
25 Profile of member's economical activity
1= excellent 2= good 3= regular 4= poor
26 Risk attributed by the cooperative
1= AA 2= A 3= B 4= C 5= D 6= E 7= F 8= G 9= H
27 Result—July 2007 1= good standing 2= default
28 Result—August 2007 1= good standing 2= default 29 Result—September 2007 1= good standing
2= default 30 Result—October 2007 1= good standing
2= default 31 Result—November 2007 1= good standing
2= default 32 Result—December 2007 1= good standing
Chart 01 - Database structure (Cont.)
CODE VARIABLE VALUE
33 Result—January 2008 1= good standing 2= default 34 Result—February 2008 1= good standing
2= default 35 Result—March 2008 1= good standing
2= default 36 Result—April 2008 1= good standing
2= default
37 Result—May 2008 1= good standing
2= default 38 Result—June 2008 1= good standing
2= default
39 Aggregate result 1= good standing
2= default Source: Study data, 2010
The output vector is given by variables 27 to 39, corresponding to the period from July 2007 through June 2008. Variables 02 and 10 are not part of the credit analysis conducted by the cooperative and were added to broaden the analysis. These variables were gathered from cooperative members' records and represent the data made available by the cooperative.
Variables 11 through 26 are currently used for credit analysis and represent the cooperative member's borrowing history. Codes 27 through 39 represent the output variable adopted in the study and depict the period from July 2007 through June 2008. These are the data that the cooperative provided. Older data were not available.
The number of variables used in the analysis was consistent with other studies. For example, Koh et al. (2006) used 20 variables, and Lemos et al. (2005) used 24.
The variable “cooperative member code” was discarded because it was useful only to identify individuals while collecting data. The variable “attributed risk” was
used only in the data pre-processing and cleanup stages; it was not used in the transformation and modeling stages because it refers to the output of the model used by the cooperative, and therefore it represents the result of the model currently being used.
The variable “aggregate results” represents the result of the period of analysis (July
2007 through June 2008) and according to the cooperative's business rules and the study's goals, is the model's target output variable.
Data transformation aims to help carry out the data mining techniques. As recommended by Goldschmidt and Passos (2005), data were grouped into a single two-dimensional table.
The data were collected from two sources in the cooperative: first, from credit assessment; and second, from records gathered manually, record by record. In this survey, historical data from 211 individual members were used, out of which 22 were
in default and 189 were in good standing. This data represents all of the cooperative’s
standing, there may be bias and overfitting problems (Chawla, 2005; Horta, Borges, Carvalho, & Alves, 2011). To solve this problem, a technique called SMOTE (synthetic minority oversampling technique) (Chawla, 2005) was used to insert observations of cooperative members in default. This algorithm is one of the most used in the literature (Horta et al., 2011). Thus, 110 observations of the minority class—i.e., members in default—were created, and the sample totaled 321 observations, out of which 132 were in default and 189 were in good standing. Next, the database was randomized to avoid a concentration of the same values into a given data set while cross-validating, which would have led to overfitting.
For the computational implementation of the decision tree and neural network techniques, the database described in this study was used, taking into consideration, for each cooperative member, the previously described variables. For example, a model generated by the decision tree technique was selected for transformation into decision rules during the post-processing phase. The public domain computational tool WEKA (Waikato environment for knowledge analysis) was chosen to perform this task.
Goldschmidt and Passos (2005, p. 50) argue that for a more reliable evaluation
of the knowledge model, “[...] the data used in constructing the model should not be the
same as used in this model's evaluation”. Those authors further state that there should
be at least two divisions: training and testing. The first division comprises the data used in constructing the model; the second division comprises the data for evaluation.
Splitting the data set served to simplify, summarize and reduce the database's size and variability, resulting in the selection of more sophisticated and accurate models (Dasu & Johnson, 2003).
In this study, to increase assessment neutrality, K-fold cross-validation was used for both the decision tree and the ANN. According to Goldschmidt and Passos (2005, p. 51), in this method, the database is randomly split with N elements into K separate subsets: “each of the K subsets is used as a testing set, and the remaining (K-1) subsets are combined into a training set. The process is repeated K times, so that K models are
generated and evaluated [...]”. The data were split into ten sets and repeated across ten simulations as proposed by Witten and Frank (2005). Cross-validation has been found in several studies on credit analysis (Akkoç, 2012; Chang & Yeh, 2012; Han et al., 2013).
For this study, multi-layer ANNs, i.e., multilayer perceptron (MLP), were used with the back propagation learning algorithm. The number of neurons in the input layer was 66, plus two in the intermediate and two in the output layers. For all tests, a learning rate of 0.01 was used, given that this rate improved classification as observed in the simulations and was also used by Lemos et al., (2005). The momentum rate was not used as in Lemos et al. (2005); moreover, adding this rate did not improve classification performance.
Supervised learning was used in this ANN. Ferreira (2005, p. 37) describes this
type of learning as follows: “[...] the network is trained by supplying it with input
For a comparative analysis of the models, the total percentage of correctly predicted values was used as the parameter in the two-tailed corrected resample t-test, at a significance level of 0.05 (or 5%), with nine degrees of freedom, as proposed by Witten and Frank (2005) in equation 1, presented below:
(1) where
difference between mean numbers of correctly predicted values between the models.
number of sets times number of repetitions. number of samples for testing.
number of samples for training.
variance of the difference between means.
3.1 Decision Tree
In this study, the J4.8 tool was chosen for use. It is the WEKA implementation of the C4.5 decision tree algorithm. According to Goldschmidt and Passos (2005), this tree is broadly used and accepted.
A model generated by the decision tree technique was taken to exemplify the rules and confusion matrix. The model below generated 41 leaves, i.e., sets of decision rules of the if-thentype. Some rules of the first set are shown below:
If liquidity guarantee = high guarantee liquidity (sale in less than
6 months), then default;
If liquidity guarantee = moderate guarantee liquidity (sale in 6 to
12 months) and level of commitment = up to 20% of the average net income,
then good standing;
If liquidity guarantee = moderate guarantee liquidity (sale in 6 to
12 months) and level of commitment = from 20% to 30% of the average net
Chart 02 shows the confusion matrix generated by the testing set of the tree being evaluated. This matrix shows the instances classified as predicted and actual to assess the models' hit and miss types. The main diagonal contains the correctly classified values. The values are given as absolute numbers.
Chart 02 - Confusion matrix of a model developed using the decision tree method
Predicted
Actual
Default Good standing
Default 121 11
Good standing 8 181
Source: Study data, 2010.
In this example, the model based on the C4.5 decision tree algorithm correctly classified 302 records, which corresponds to accuracy rate of 94.08%, and incorrectly classified 19 observations, or 5.92%.
3. 2. Neural Network
The ANN in this study, as previously discussed in the theoretical framework, contained three layers: input, intermediate, and output. The network used supervised learning because the model's output values were supplied.
As in the case of the decision tree, a model was used to exemplify the results generated by the WEKA package. Chart 03 shows the confusion matrix for the model obtained.
Chart 03 - Confusion matrix for a model developed using the ANN method
Predicted
Actual
Default Good standing
Default 118 14
Good standing 13 176
Source: Study data, 2010.
3. 3. Model Evaluation
This section comparatively evaluates the two models developed in this study: ANN (MLP algorithm) and decision tree (C4.5 algorithm). To conduct this evaluation, the total percentage of correctly predicted values was used.
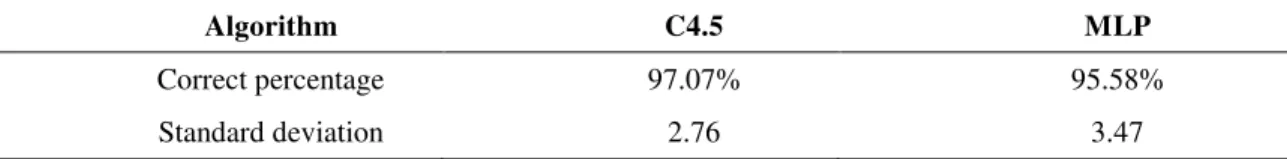
Table 01 shows the percentage result of correctly predicted values and the respective standard deviation of the simulations carried out using the studied models.
Table 01—Comparative evaluation
Algorithm C4.5 MLP
Correct percentage 97.07% 95.58%
Standard deviation 2.76 3.47
Source: Study data, 2010.
The simulations performed using WEKA's experimenter tool indicate that the decision tree technique implementing the C4.5 algorithm is statistically similar, according to a two-tailed test, to the ANN with the MLP algorithm at the 0.05 significance level. Figure 02 shows WEKA's output for the simulations of the previously described problem.
Figure 02: Output for the simulations run using WEKA's experimenter tool Source: Study data, 2010.
The decision tree's performance for the current problem is better than the one obtained by Yap et al. (2011), in which the error rate is 28.1%. The study by Lemos et al. (2005), despite not performing statistical tests, obtains a higher hit rate with the neural network than with the decision tree. Although statistically similar, decision trees are considered to be easy to use (Lemos et al., 2005).
performance, as previously found in the analysis of a microcredit organization (Cubiles-De-La-Vega et al., 2013) and a credit union (Zhu et al., 2013).
4. CONCLUSIONS
The goal of this study is to develop and evaluate data mining models to classify and predict the behavior of cooperative members' behavior in honoring their obligations. The decision tree and ANN, both data mining techniques, were used to develop the model.
The process of data preparation and modeling followed the steps suggested in the literature: data selection, data pre-processing and cleanup, data transformation, data mining, interpretation, and validation of the results. The data were divided into training and testing sets.
Although the decision tree's accuracy in the simulations is 97.07%, compared to 95.58% with the ANN, the decision-tree-based C4.5 algorithm obtains a result that is statistically similar to that of the model that was based on the MLP artificial neural network.
The knowledge discovery process and the use of models based on data mining developed here may provide the cooperative with practical advantages. Understanding the variables and their relationships may help in better classifying and predicting cooperative members' behavior. In-depth assessment of the variables may further help in including variables that might be important and excluding others that turn out not to be relevant, with the advantage of providing more succinct and precise credit management models, reducing execution time and improving decision accuracy. The analysis of discrepant or outlier cases may be relevant to creating a new classification or, conversely, finding undesirable patterns.
This study is limited by the following issues: a lack of other cooperatives' databases for comparison, evaluation, and validation of the model; limitations of the information system used by the cooperative, which precluded collecting input variable data from before 2003 and provided data referring to the output value only for the past six months; and the lack of integration between some database modules and electronic spreadsheets.
REFERENCES
Abellán, J., & Mantas, C. J. (2014). Improving experimental studies about ensembles of classifiers for bankruptcy prediction and credit scoring. Expert Systems with Applications, 41(8), 3825–3830.
Akkoç, S. (2012). An empirical comparison of conventional techniques, neural networks and the three stage hybrid Adaptive Neuro Fuzzy Inference System (ANFIS) model for credit scoring analysis: The case of Turkish credit card data. European Journal of Operational Research, 222(1), 168–178.
Berry, M. J. A., & Linoff, G. (2004). Data mining techniques: For marketing, sales and customer relationship management (2nd ed.). Indianapolis: wiley Publishing.
Bhattacharyya, S., Jha, S., Tharakunnel, K., & Christopher, J. (2011). Data mining for credit card fraud: A comparative study. Decision Support Systems, 50(3), 602–613. Braga, A. de P., Carvalho, A. P. de L. F., & Ludermir, T. B. (2000). Redes neurais artificiais: Teoria e aplicações. Rio de Janeiro: LTC.
Chaia, A. J. (2003). Modelos de gestão de risco de crédito e sua aplicabilidade ao mercado brasileiro. Dissertação de Mestrado. FEA/USP.
Chang, S.-Y., & Yeh, T.-Y. (2012). An artificial immune classifier for credit scoring analysis. Applied Soft Computing, 12(2), 611–618.
Chawla, N. V. (2005). Data mining for imbalanced datasets: An overview. In Data mining and knowledge discovery handbook (pp. 853–867). New Jersey: Springer. Chen, S. C., & Huang, M. Y. (2011). Constructing credit auditing and control & management model with data mining technique. Expert Systems with Applications, 38(5359-5365).
Crone, S. F., & Finlay, S. (2012). Instance sampling in credit scoring: An empirical study of sample size and balancing. International Journal of Forecasting, 28(1), 224– 238.
Cubiles-De-La-Vega, M.-D., Blanco-Oliver, A., Pino-Mejías, R., & Lara-Rubio, J. (2013). Improving the management of microfinance institutions by using credit scoring models based on Statistical Learning techniques. Expert Systems with Applications, 40(17), 6910–6917.
Dasu, T., & Johnson, T. (2003). Exploratory data mining and data cleaning. New Jersey: John Wiley & Sons.
Fayyad, U., Piatetsky-Shapiro, G., & Smyth, P. (1996). From data mining to knowledge discovery in databases. A I Magazine, 17(3), 37–54.
Ferreira, J. B. (2005). Mineração de dados na retenção de clientes em telefonia celular. Dissertação de Mestrado. PUC-RIO.
Gehrke, J. (2003). Decision tree. In The handbook of data mining (pp. 3–23). New Jersey: Lawrence Erlbaum Associates.
Goldschmidt, R., & Passos, E. (2005). Data mining: Um guia prático. Rio de Janeiro: Elsevier.
Han, L., Han, L., & Zhao, H. (2013). Orthogonal support vector machine for credit scoring. Engineering Applications of Artificial Intelligence, 26(2), 848–862.
Horta, R. A. M., Borges, C. C. H., Carvalho, F. A. A., & Alves, F. J. S. (2011). Previsão de insolvência: Uma estratégia para balanceamento da base de dados utilizando variáveis contábeis de empresas brasileiras. Sociedade, Contabilidade E Gestão, 6(2), 21–36.
Ju, Y. H., & Sohn, S. Y. (2014). Updating a credit-scoring model based on new attributes without realization of actual data. European Journal of Operational Research, 234(1), 119–126.
Khatchatourian, O., & Treter, J. (2010). APLICAÇÃO DA LÓGICA FUZZY PARA
AVALIAÇÃO ECONÔMICO-FINANCEIRA DE COOPERATIVAS DE
PRODUÇÃO. Revista de Gestão Da Tecnologia E Sistemas de Informação, 7(1), 141– 162.
Koh, H. C., Tan, W. C., & Goh, C. P. (2006). A two-step method to construct credit scoring models with data mining techniques. International Journal of Business and Information, 1(1), 96–118.
Kruppa, J., Schwarz, A., Arminger, G., & Ziegler, A. (2013). Consumer credit risk: Individual probability estimates using machine learning. Expert Systems with Applications, 40(13), 5125–5131.
Lai, K. K., Yu, L., Wang, S., & Zhou, L. (2006). Credit risk analysis using a reliability-based neural network ensemble model. In Artificial Neural Networks-ICANN 2006 (pp. 682–690). Springer Berlin Heidelberg.
Larose, T. D. (2005). Discovering knowledge in data: An introduction to data mining. New Jersey: John Wiley & Sons.
Lemos, E. P., Steiner, M. T. A., & Nievola, J. C. (2005). Análise de crédito bancário por meio de redes neurais e árvore de decisao: Uma aplicação simples de data mining. Revista de Administração Da Universidade de São Paulo, 40(3), 225–234.
Majeske, K. D., & Lauer, T. W. (2013). The bank loan approval decision from multiple perspectives. Expert Systems with Applications, 40(5), 1591–1598.
Marqués, A. I., García, V., & Sánchez, J. S. (2012). Two-level classifier ensembles for credit risk assessment. Expert Systems with Applications, 39(12), 10916–10922.
OCB. (2014). Organização das Cooperativas Brasileiras. Números. Retrieved February 20, 2014, from http://www.ocb.org.br/site/ramos/credito_numeros.asp
Oliveira, D. P. R. (2001). Manual de gestão de cooperativas: Uma abordagem prática. São Paulo: Atlas.
Oreski, S., & Oreski, G. (2014). Genetic algorithm-based heuristic for feature selection in credit risk assessment. Expert Systems with Applications, 41(4), 2052–2064.
Pidd, M. (1998). Modelagem empresarial: Ferramentas para tomada de decisão. São Paulo: Atlas.
Pinho, D. B. (1982). O pensamento cooperativo e o cooperativismo brasileiro. CNPq/BNCC.
Pinho, D. B. (2004). O cooperativismo no Brasil: Da vertente pioneira à vertente solidaria. São Paulo: Saraiva.
Portal do Cooperativismo de Crédito. (2014). Dados consolidados dos sistemas
cooperativos. Retrieved February 20, 2014, from
http://cooperativismodecredito.coop.br/cenario-brasileiro/dados-consolidados-dos-sistemas-cooperativos/
Saberi, M., Mirtalaie, M. S., Hussain, F. K., Azadeh, A., Hussain, O. K., & Ashjari, B. (2013). A granular computing-based approach to credit scoring modeling. Neurocomputing, 122(25), 100–115.
Wang, G., Ma, J., Huang, L., & Xu, K. (2012). Two credit scoring models based on dual strategy ensemble trees. Knowledge-Based Systems, 26, 61–68.
Witten, I. H., & Frank, E. (2005). Data mining: Practical machine learning tools and techniques (2nd ed.). San Francisco: Elsevier.
Xiong, T., Wang, S., Mayers, A., & Monga, E. (2013). Personal bankruptcy prediction by mining credit card data. Expert Systems with Applications, 40(2), 665–676.
Yap, B. W., Ong, S. H., & Husain, N. H. M. (2011). Using data mining to improve assessment of credit worthiness. Expert Systems with Applications, 38(10), 13274– 13283.
Yin, Robert, K. (2010). Estudo de caso: planejamento e métodos (4th ed.). Porto Alegre: Bookman.
Zhong, H., Miao, C., Shen, Z., & Feng, Y. (2014). Comparing the learning effectiveness of BP, ELM, I-ELM, and SVM for corporate credit ratings. Neurocomputing, 128(27), 285–295.
Zhou, X., Jiang, W., Shi, Y., & Tian, Y. (2011). Credit risk evaluation with kernel-based affine subspace nearest points learning method. Expert Systems with Applications, 38(4), 4272–4279.