Gabriela Arantes WagnerI
Lúcio Garcia de OliveiraI
Lucia Pereira BarrosoII
Raphael NishimuraIII
Luciana Morita IshiharaII
Vladimir de Andrade StempliukIV
Paulina do Carmo Arruda Vieira DuarteIV
Arthur Guerra de AndradeI
I Departamento de Psiquiatria. Faculdade de
Medicina. Universidade de São Paulo (USP). São Paulo, SP, Brasil
II Departamento de Estatística. Instituto de
Matemática e Estatística. USP. São Paulo, Brasil
III Institute for Social Research. Ann Arbor, MI,
USA
IV Secretaria Nacional de Políticas sobre
Drogas. Ministério da Justiça. Brasília, DF, Brasil
Correspondence: Gabriela Arantes Wagner R. Costa Aguiar, 1375 – Apto. 54 Ipiranga
04204-001 São Paulo, SP, Brasil E-mail: [email protected] Received: 7/15/2011 Approved: 12/1/2011
Article available from: www.scielo.br/rsp
Drug use in college students: a
13-year trend
Uso de drogas entre alunos
universitários: tendências em 13 anos
ABSTRACT
OBJECTIVE: To analyze drug use trends among college students in 1996,
2001 and 2009.
METHODS: A cross-sectional epidemiological study with a multistage
stratifi ed cluster sample with 9,974 college students was conducted in the city of São Paulo, southeastern Brazil. An anonymous self-administered questionnaire was used to collect information on drug use assessed in lifetime, the preceding 12 months and the preceding 30 days. The Bonferroni correction was used for multiple comparisons of drug use rates between surveys.
RESULTS: There were changes in the lifetime use of tobacco and some other
drugs (hallucinogens [6.1% to 8.8%], amphetamines [4.6% to 8.7%], and tranquilizers [5.7% to 8.2%]) from 1996 to 2009. Differences in the use of other drugs over the 12 months preceding the survey were also seen: reduced use of inhalants [9.0% to 4.8%] and increased use of amphetamines [2.4% to 4.8%]. There was a reduction in alcohol [72.9% to 62.1%], tobacco [21.3% to 17.2%] and marijuana [15.0% to 11.5%] use and an increase in amphetamine use [1.9% to 3.3%] in the preceeding 30 days.
CONCLUSIONS: Over the 13-year study period, there was an increase in
lifetime use of tobacco, hallucinogens, amphetamines, and tranquilizers. There was an increase in amphetamine use and a reduction in alcohol use during the preceding 12 months. There was an increase in amphetamine use during the preceding 30 days.
DESCRIPTORS: Students. Substance Abuse, epidemiology.
Drug use in young people has heralded social and political changes that have taken place in other social spheres in European countries and the United States. It is a challenge for public policymakers as new uses of old drugs must be identifi ed for planning effective actions. Drug use among the young is greater in developing than developed countries.a,b,c A Brazilian study including a
sample of the general population aged 12 to 65 years in the 108 largest Brazilian cities showed that 22.8% of 7,939 respondents reported use of at least one drug (other than tobacco and alcohol) once in their lifetime.d
Considering drug use by age groups, 78.6% of those aged 18 to 24 years had tried alcohol, 39.5% tobacco and 10.8% inhalants. Inhalants seem to be mostly abused by Brazilian young people. College students have deserved attention because they suffer serious consequences resulting from illicit drug use or the use
INTRODUCTION
a United Nations Offi ce for Drug Control and Crime Prevention.World Drug Report.Vienna; 2008. b United Nations Offi ce for Drug Control and Crime Prevention.World Drug Report.Vienna; 2009. c United Nations Offi ce for Drug Control and Crime Prevention.World Drug Report.Vienna; 2010.
d Carlini EA, Carlini-Contrim B, Silva-Filho AR. II Levantamento Nacional Sobre o Uso de Psicotrópicos em Estudantes de 1º e 2º graus. São
Paulo: Centro Brasileiro de Informações sobre Drogas Psicotrópicas. Universidade Federal de São Paulo; 2007.
e Andrade AG, Duarte PCAV, Oliveira LG. I Levantamento nacional sobre o uso de álcool, tabaco e outras drogas entre universitários das 27
capitais brasileiras. Brasília: Secretaria Nacional de políticas sobre Drogas; 2010.
of a combination of drugs such as alcohol use with tobacco, marijuana and cocaine.1,6,10,13-15
According to epidemiological studies conducted in the United States, about 30% of college students reported tobacco use in the preceding 30 days —a high rate considering the information available on the risks of smoking—, about 20% or less reported using mari-juana, and less than 2% reported using cocaine.6 The
First Nationwide Survey on the use of alcohol, tobacco and other drugs among college students carried out in 27 Brazilian state capitalse showed that 48.7% of
students reported using illicit drugs in their lifetime. Marijuana was the substance most frequently used, followed by amphetamines, tranquilizers, inhalants and hallucinogens, especially regarding recent use (use in the preceding 12 months and in the preceding 30 days). Illicit drug use was greater among students from the Southern and Southeastern regions.
RESUMO
OBJETIVO: Analisar a tendência do uso de drogas entre universitários entre
1996, 2001 e 2009.
MÉTODOS:Estudo epidemiológico transversal com 9.974 universitários do
município de São Paulo, SP, cuja amostra foi selecionada por estratifi cação e conglomerados. Adotou-se instrumento de pesquisa de autopreenchimento, anônimo, que caracterizou o uso de drogas por três medidas: uso na vida, nos últimos 12 meses e nos últimos 30 dias. Para comparação de frequências de uso de drogas entre as pesquisas, utilizou-se a metodologia de comparações múltiplas com correção de Bonferroni.
RESULTADOS: Houve redução da frequência de estudantes que relataram
consumo de drogas entre 1996 e 2009. Houve diminuição do uso de inalantes e aumento do uso de anfetamínicos em todas as medidas avaliadas [4,6% para 8,7% na vida, de 2,4% para 4,5% nos últimos 12 meses e de 1,9% a 3,3% nos últimos 30 dias]. Os alunos das Ciências Humanas relataram uso de drogas com maior frequência [48,6% na vida, 29,0% nos últimos 12 meses e 20,9% nos últimos 30 dias].
CONCLUSÕES: Entre os 13 anos de estudo, houve aumento de uso na vida
de tabaco, alucinógenos, anfetaminas e tranquilizantes; além do aumento do uso de anfetaminas nos últimos 12 meses e diminuição do uso de álcool. Em relação aos últimos 30 dias, houve aumento do uso de anfetaminas.
DESCRITORES: Estudantes. Abuso de Substâncias, epidemiologia.
f Wagner GA, Barroso LP, Stempliuk VA, Andrade AG. Álcool e drogas: terceira pesquisa sobre atitudes e uso entre alunos da Universidade
de São Paulo – campi Cidade Universitária, Faculdade de Direito e Complexo da Saúde. In: Andrade AG, Duarte PCAV, Oliveira LG. I Levantamento nacional sobre o uso de álcool, tabaco e outras drogas entre universitários das 27 capitais brasileiras. Brasília: Secretaria Nacional de políticas sobre Drogas; 2010. p.129-47.
Similarly to the University of Michigan Monitoring the Future Study,6 the Universidade de São Paulo (USP)
carried out a study on drug use among its students aiming to identify trends and developing prevention actions and intervention strategies targeted to this population.e Three cross-sectional surveys were carried
out at the USP in 1996, 2001 and 20091,13,e by the
Interdisciplinary Group for Alcohol and Drug Studies. The fi rst study (1996) pointed out that alcohol and tobacco were the most widely-consumed drugs, with prevalences of use of 82.5% and 25.6% in the preceding 12 months.13 Drug use was greater among males and
students not living with their families.
The study conducted in 2001 revealed some changes. There was an increase in the rate of experimentation with alcohol, tobacco, marijuana and hallucinogens,1,13
as well as increased use of tobacco, marijuana, amphet-amines and inhalants over the preceding 30 days14
among males. No specifi c increases were observed among females.
A third study was conducted in 2009 to follow up drug use changes at the USP from 1996. The present study aimed to analyze drug use trend in college students between 1996 and 2009.
METHODS
Cross-sectional epidemiological study with 9,974 undergraduate college students from a public university conducted in the state of São Paulo, Southeastern Brazil. In the fi rst two studies (1996 and 2001), the sampling unit was the student selected by means of systematic random sampling stratifi ed according to study area (Arts & Humanities, Biological Sciences, and Mathematical and Physical Sciences). The sample was selected from students enrolled in any undergraduate course through the statistical yearbook. In 2009 college students were selected by means of stratifi ed sampling including clusters of unequal size.3,f The primary sampling unit
was the student classroom (set of students attending a given class). The sample was stratifi ed according to the study area and student classrooms were defi ned as clusters. Since a class may include students from several different colleges, the number of students per study area was totaled and the percentage corresponding to each area was calculated. The area with the highest propor-tion of students was defi ned as a study area.
It was assumed that the absolute difference between a given proportion obtained for the sample and the corresponding proportion for the entire population should lie within a 95% confi dence interval, with a 5%
margin of error. The sample size would be equivalent to 40%, i.e., the prevalence of use of at least one illicit drug in lifetime, according to the outcomes of the fi rst wave of this series of studies (38.1% [95% CI 35.3; 41.0]). Another 20% of the sample was randomly selected to compensate for potential losses of colleges or questionnaires.
Based on a reference list of undergraduate students, 228 classrooms were selected to participate in the study (76 for each study area). This estimate was based on the planning effect which is dependent on the average cluster size and intraclass correlation coeffi cient.13 All
students in each classroom selected were contacted. The total number of students was determined by the classroom selected. The sample comprised 4,759 respondents, 81.1% of the students selected in 2009 (92.6% in 1996 and 79.1% in 2001). The total sample comprised 9,974 students (2,374 participants in 1996 and 2,841 participants in 2001) (Table 1). The distribu-tion of students in 2009 according to study area was 39.6%, 30.7%, and 29.7% from Arts & Humanities, Mathematical and Physical Sciences and Biological Sciences, respectively (Table 2).
The study questionnaire was adapted from a research instrument developed by the World Health Organization.1,13 Drug use was assessed in lifetime
(experimental use “at least once in their lifetime”), in the preceding 12 months (i.e., “at least once in the 12 months preceding the survey”) and in the preceding month (i.e., “at least once in the 30 days preceding the survey”). It was an anonymous self-administered questionnaire comprising 58 closed-ended questions. Students took on average 30 minutes to complete the questionnaire. The adapted instrument assessed the profi le of the students: a) sociodemographic information (gender, age, marital status, socioeconomic status, ethnic group and others); b) undergraduate course attended
Table 1. Sample design and total number of college student
respondents in the three waves of the study. São Paulo, Southeastern Brazil, 1996, 2001 and 2009.
Sample
Design 1996 2001 2009
Type of sample
Systematic random
sample stratifi ed by
study area
Systematic random
sample stratifi ed by
study area
Cluster sampling stratifi ed by study
area Number of
respondents 2,374 2,841 4,759
(study area, academic year and term); c) academic life events (involvement with college activities and places of socialization); and d) academic performance and satisfaction about the undergraduate course chosen, among other factors.
The focus of the study was to investigate undergraduate college student use of alcohol and other drugs (tobacco, marijuana, cocaine hydrochloride, crack cocaine, meth-amphetamines, anticholinergics, tranquillizers, opiates, barbiturates, anabolic androgenic steroids, inhalants,
Table 2. Sociodemographic characteristics of students by area of study. São Paulo, Southeastern Brazil, 2009.
Variable
Arts &
Humanities Mathematical and Physical Sciences Biological Sciences Total
% n % n % n % n
Gender
Male 44.0 830 73.9 1,078 34.5 487 50.3 2,395
Female 55.5 1,048 25.8 377 65.2 922 49.4 2,347
Missing information 0.5 9 0.3 4 0.3 4 0.3 17
Age group (years)
15 to 19 20.6 388 23.7 346 20.5 290 21.5 1,024
20 to 24 53.6 1,012 61.3 895 68.2 964 60.3 2,871
25 to 29 14.5 273 9.5 138 8.7 123 11.2 534
30 or over 11.0 208 5.2 76 2.3 32 6.7 316
Missing information 0.3 6 0.3 4 0.3 4 0.3 14
Marital status
Single 86.4 1,630 89.3 1,303 96.0 1,356 88.8 4,226
Married / Living together 12.1 228 9.1 133 3.6 51 9.9 471
Separated 0.9 17 1.0 15 0.2 3 0.8 38
Widowed 0.3 6 0.2 3 0.0 0 0.2 10
Missing information 0.3 6 0.4 6 0.2 3 0.3 14
Children
Yes 7.1 134 6.4 93 2.1 30 6.1 290
No 92.6 1,747 93.1 1,358 97.6 1,379 93.6 4,454
Missing information 0.3 6 0.5 7 0.3 4 0.3 14
Religion
Yes 56.3 1062 59.7 871 66.8 944 59.0 2,808
No 43.5 821 40.0 584 33.0 466 40.8 1,942
Missing information 0.2 4 0.3 4 0.2 3 0.2 10
Paid job for one month in the last six months
Yes 68.0 1,283 57.2 835 50.7 716 62.2 2,960
No 30.8 581 42.4 619 49.2 695 37.0 1,761
Missing information 1.2 23 0.4 6 0.1 1 0.8 38
Academic performance
Passed 70.2 1,325 52.6 767 75.1 1,061 66.5 3,165
Needed to take an examination, but passed 4.9 92 6.6 96 9.5 134 6.1 290
Needed to repeat courses but did not fail to
progress in the academic year 12.1 228 22.2 324 8.3 117 14.1 671
Failed 1.5 28 3.4 50 0.5 7 1.8 86
Other 9.3 175 12.4 181 4.6 65 9.3 443
Missing information 2.0 38 2.8 41 2.0 28 2.2 105
Period of study
Daytime 44,8 846 85,7 1.250 75,0 1.060 3.156 66,3
Evening 54,3 1.024 13,9 203 24,6 347 1.574 33,1
Missing information 0,9 17 0,4 6 0,4 6 29 0,6
hallucinogens and ecstasy) through the description of the frequency of use in their lifetime and in the preceding 12 months and preceding 30 days. A fi ctitious drug called Relevin was included in the questionnaire to test the reliability of the responses.g A positive answer on
the use of this drug invalidated the entire questionnaire, thus preventing the use of this data in the analysis. Six questionnaires were excluded from the analysis. The data were collected between March and November 2009. Valid questionnaires were single-entered using SPSS. Quality control was performed by retyping 70% of the questionnaires. When the database was complete, consistency analyses and general checks were performed.
All statistical analyses were performed using SPSS for Windows version 13.1 and SAS version 9.2. A descrip-tive analysis was conducted with the 2009 data. Data was weighted as they were based on complex sampling plans. A trend analysis could not be performed due to the small number of surveys (three) and a comparison between drug use prevalence was performed using the Bonferroni method,2,8,12 which consisted in dividing
the global signifi cance level (5%) by the number of tests. Comparisons were also made using simultaneous confi dence intervals.
This study was approved by the Research Ethics Committee of Clínicas Hospital of the Universidade de
São Paulo Medical School (protocol number 0378/08). All respondents who agreed to participate in the study signed a free informed consent form.
RESULTS
The sample consisted mostly of male (50.3%) young students aged 20 to 24 years (60.3%), unmarried (88.8%), childless (93.6%) and attending daytime undergraduate courses (66.3%).
In the preceding year, 66.5% of the respondents passed all their subjects while 15.4% failed in one subject but not in the entire academic year.
Almost 60% of the students (59.0%) reported having a religion. However, 54.8% reported actively observing their faith, and Evangelicals (83.2%) and Spiritists (63.1%) were the most devout. Although Catholicism was the most commonly reported religion (59.2%), 43.7% reported religious observance and practice (Table 2).
Most students (75.1%) reported they had not experi-mented with illicit drugs before college. Among those who had, marijuana was the most reported (83.7%), followed by solvents (40.5%), hallucinogens (13.7%), cocaine (13.1%) and ecstasy (10.0%).
Among sampled students, 81.5% reported the use of drugs in 2009. Among these, 92.5% used alcohol,
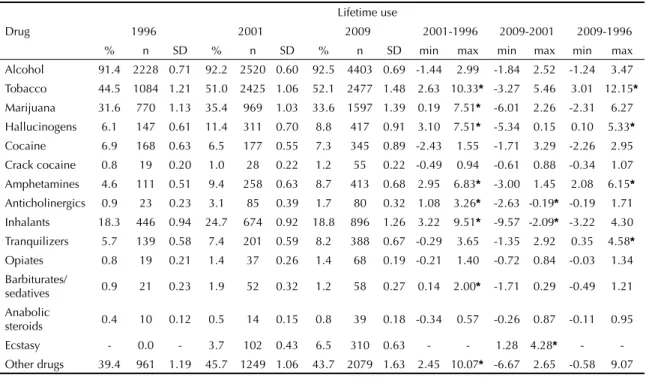
Table 3. Proportion of lifetime drug use in three surveys and differences between them. São Paulo, Southeastern Brazil, 1996, 2001 and 2009.
Drug
Lifetime use
1996 2001 2009 2001-1996 2009-2001 2009-1996 % n SD % n SD % n SD min max min max min max Alcohol 91.4 2228 0.71 92.2 2520 0.60 92.5 4403 0.69 -1.44 2.99 -1.84 2.52 -1.24 3.47 Tobacco 44.5 1084 1.21 51.0 2425 1.06 52.1 2477 1.48 2.63 10.33* -3.27 5.46 3.01 12.15*
Marijuana 31.6 770 1.13 35.4 969 1.03 33.6 1597 1.39 0.19 7.51* -6.01 2.26 -2.31 6.27 Hallucinogens 6.1 147 0.61 11.4 311 0.70 8.8 417 0.91 3.10 7.51* -5.34 0.15 0.10 5.33*
Cocaine 6.9 168 0.63 6.5 177 0.55 7.3 345 0.89 -2.43 1.55 -1.71 3.29 -2.26 2.95 Crack cocaine 0.8 19 0.20 1.0 28 0.22 1.2 55 0.22 -0.49 0.94 -0.61 0.88 -0.34 1.07 Amphetamines 4.6 111 0.51 9.4 258 0.63 8.7 413 0.68 2.95 6.83* -3.00 1.45 2.08 6.15*
Anticholinergics 0.9 23 0.23 3.1 85 0.39 1.7 80 0.32 1.08 3.26* -2.63 -0.19* -0.19 1.71 Inhalants 18.3 446 0.94 24.7 674 0.92 18.8 896 1.26 3.22 9.51* -9.57 -2.09* -3.22 4.30 Tranquilizers 5.7 139 0.58 7.4 201 0.59 8.2 388 0.67 -0.29 3.65 -1.35 2.92 0.35 4.58*
Opiates 0.8 19 0.21 1.4 37 0.26 1.4 68 0.19 -0.21 1.40 -0.72 0.84 -0.03 1.34 Barbiturates/
sedatives 0.9 21 0.23 1.9 52 0.32 1.2 58 0.27 0.14 2.00* -1.71 0.29 -0.49 1.21 Anabolic
steroids 0.4 10 0.12 0.5 14 0.15 0.8 39 0.18 -0.34 0.57 -0.26 0.87 -0.11 0.95 Ecstasy - 0.0 - 3.7 102 0.43 6.5 310 0.63 - - 1.28 4.28* - -Other drugs 39.4 961 1.19 45.7 1249 1.06 43.7 2079 1.63 2.45 10.07* -6.67 2.65 -0.58 9.07 α = 0.05, * statistically signifi cant
g Hibell B, Guttormsson U, Ahlström S, Balakireva O, Bjarnason T, Kokkevi A, et al. The 2007 ESPAD Report: Substance Use Among Students
52.1% tobacco and 43.7% other drugs. In the 12 months preceding the survey, 80.0% of the students used alcohol, 23.6% tobacco and 25.5% other drugs. As for the preceding month, 62.1% of the students used alcohol, 17.2% tobacco and 17.4% other drugs.
There were changes in the lifetime use of tobacco and some other drugs (hallucinogens, amphetamines, and tranquilizers) from 1996 to 2009 (Table 3). Differences in the use of other drugs over the 12 months preceding the survey were also seen: reduced use of inhalants and
Table 4. Proportion of drug use in the 12 months preceding the survey in three surveys and differences between them. São Paulo, Southeastern Brazil, 1996, 2001 and 2009.
Drug
Use in the preceding 12 months
1996 2001 2009 2001–1996 2009–2001 2009–1996 % n SD % n SD % n SD min max min max min max Alcohol 82.5 2011 0.93 80.5 2200 0.86 80.0 3806 1.01 -5.03 1.02 -3.67 2.68 -5.78 0.78 Tobacco 25.4 619 1.05 26.7 731 0.96 23.6 1122 0.98 -2.03 4.77 -6.45 0.11 -5.24 1.64 Marijuana 20.3 496 0.98 22.8 623 0.91 18.5 879 1.18 -0.76 5.65 -7.87 -0.75* -5.53 1.80 Hallucinogens 3.4 82 0.45 5.0 137 0.47 4.0 188 0.48 0.08 3.22* -2.65 0.57 -0.96 2.19 Cocaine 3.5 85 0.45 2.9 80 0.39 2.4 115 0.36 -1.96 0.89 -1.79 0.74 -2.45 0.33 Crack cocaine 0.4 9 0.14 0.2 4 0.09 0.2 11 0.08 -0.59 0.20 -0.20 0.36 -0.49 0.26 Amphetamines 2.4 59 0.37 5.4 148 0.49 4.5 212 0.51 1.52 4.46* -2.66 0.70 0.51 3.52*
Anticholinergics 0.3 8 0.13 0.7 20 0.20 0.3 12 0.10 -0.15 1.00 -1.02 0.06 -0.45 0.34 Inhalants 9.0 220 0.67 13.5 369 0.73 4.8 227 0.54 2.07 6.81* -10.87 -6.53* -6.32 -2.19*
Tranquilizers 3.2 78 0.43 4.0 109 0.44 4.4 208 0.48 -0.71 2.24 -1.14 1.96 -0.37 2.72 Opiates 0.3 7 0.13 0.6 15 0.16 0.6 28 0.14 -0.26 0.75 -0.47 0.54 -0.18 0.73 Barbiturates/
sedatives 0.3 8 0.14 0.9 24 0.22 0.4 20 0.14 -0.05 1.19 -1.08 0.17 -0.35 0.57 Anabolic
steroids 0.1 3 0.06 0.4 10 0.12 0.2 8 0.06 -0.12 0.53 -0.51 0.15 -0.17 0.23 Ecstasy - 0.0 - 2.0 53 0.32 1.6 76 0.21 - - -1.10 0.39 - -Other drugs 26.6 648 1.07 31.8 869 1.00 25.5 1211 1.36 1.71 8.71* -10.38 -2.31* -5.26 3.00 α = 0.05, * statistically signifi cant
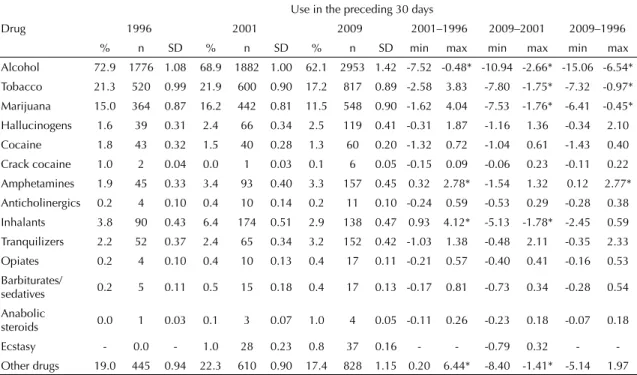
Table 5. Proportion of drug use in the 30 days preceding the survey in three surveys and differences between them. São Paulo, Southeastern. Brazil, 1996, 2001 and 2009.
Drug
Use in the preceding 30 days
1996 2001 2009 2001–1996 2009–2001 2009–1996 % n SD % n SD % n SD min max min max min max Alcohol 72.9 1776 1.08 68.9 1882 1.00 62.1 2953 1.42 -7.52 -0.48* -10.94 -2.66* -15.06 -6.54* Tobacco 21.3 520 0.99 21.9 600 0.90 17.2 817 0.89 -2.58 3.83 -7.80 -1.75* -7.32 -0.97* Marijuana 15.0 364 0.87 16.2 442 0.81 11.5 548 0.90 -1.62 4.04 -7.53 -1.76* -6.41 -0.45* Hallucinogens 1.6 39 0.31 2.4 66 0.34 2.5 119 0.41 -0.31 1.87 -1.16 1.36 -0.34 2.10 Cocaine 1.8 43 0.32 1.5 40 0.28 1.3 60 0.20 -1.32 0.72 -1.04 0.61 -1.43 0.40 Crack cocaine 1.0 2 0.04 0.0 1 0.03 0.1 6 0.05 -0.15 0.09 -0.06 0.23 -0.11 0.22 Amphetamines 1.9 45 0.33 3.4 93 0.40 3.3 157 0.45 0.32 2.78* -1.54 1.32 0.12 2.77* Anticholinergics 0.2 4 0.10 0.4 10 0.14 0.2 11 0.10 -0.24 0.59 -0.53 0.29 -0.28 0.38 Inhalants 3.8 90 0.43 6.4 174 0.51 2.9 138 0.47 0.93 4.12* -5.13 -1.78* -2.45 0.59 Tranquilizers 2.2 52 0.37 2.4 65 0.34 3.2 152 0.42 -1.03 1.38 -0.48 2.11 -0.35 2.33 Opiates 0.2 4 0.10 0.4 10 0.13 0.4 17 0.11 -0.21 0.57 -0.40 0.41 -0.16 0.53 Barbiturates/
sedatives 0.2 5 0.11 0.5 15 0.18 0.4 17 0.13 -0.17 0.81 -0.73 0.34 -0.28 0.54 Anabolic
increased use of amphetamines. There was a reduction in alcohol, tobacco and marijuana use and an increase in amphetamine use in the preceding 30 days (Table 4).
DISCUSSION
Over the 13-year study period, an increase in the lifetime use of tobacco, hallucinogens, amphetamines and tranquilizers was seen. There was an increase in amphetamine use and a reduction in alcohol use in the 12 months prior to the study. In the preceding 30 days, there was an increase in amphetamine use.
Female students were found to consume more tobacco, marijuana, anticholinergics and inhalants in the 30 days preceding the survey and were major consumers of tran-quilizers and amphetamines in 2001.14 Among American
college students, as shown in the University of Michigan Monitoring the Future Study, tranquilizer use followed a cohort behavioral pattern.6 This behavior was particular
in the sample studied: there was a rising consumption from 1996 to 2009 with a tendency towards stabilization from 2001 to 2009. However, female students continued to prefer amphetamines and tranquilizers.
The popularity of amphetamines can be attributed to its ease production and ready availability, which facilitates purchase and experimentation. Data from the Brazilian population show an increase in consumption of appetite suppressants from 2001 to 2005, as previously reported among middle and high school students from 1987 to 2004.4 These students seem to consume alcohol,
tobacco, marijuana, hallucinogens and synthetic drugs more often than Brazilian college students in general.h
Both experimentation and regular use of alcohol seem to have reached a ceiling, particularly among Biological Sciences and Arts & Humanities students. Alcohol is also the most widely used drug among Brazilian college students in general among both males and females. Use is initiated at the age of 16.5 Even though
alcohol-related disorders are more prevalent among adults over 25 years old, high-risk use is more frequent among young drinkers. Such use is associated with several negative consequences and is one of the main causes of morbidity and mortality among college students.i
The most prevalent negative consequences of alcohol use are traffi c accidents, violence, sexual abuse, sexual harassment, health problems, declines in academic performance and interpersonal problems.9,11
Experimentation with ecstasy has also shown an increase since 2001, the year its analysis was introduced
into the research instrument. Paradoxically, there was a reduction in inhalant use for all measurements over the 13-year period, which might be related to an increased use of ecstasy or reduced consumption of inhalants by the students sampled.
Increased drug use among students from 1996 to 2001 refl ected worldwide and Brazilian trends, especially compared with Brazilian middle and high school students. However, drug use between 2001 and 2009 did not change and was similar to US patterns.10 The
data suggesting increased drug use among young people in developing compared with developed countries are paradoxical since a steady state was reported among these students.c It describes a signifi cant fraction of
middle and upper-middle class Brazilian youth who have high access to information and education equivalent to
fi rst-world countries, maybe because São Paulo has the largest socioeconomics characteristics in Brazil. The degree and extend of psychoactive drug use among undergraduate students attending the university studied is signifi cant. Special attention should be given to alcohol consumption and increased consumption of other substances mainly in the preceding 30 days. Prevention and treatment programs targeting drug use should be expanded in Brazil. About 28.0% of the Brazilian universities have developed programs for drug use prevention and/or guidance/counseling. Of these, seven institutions have their programs reviewed, and it has been identifi ed in a single program the need for implementing curriculum components that address participatory and preventive education with regard to drug use among the students and colleges here studied.e
The change in the study design, from a stratifi ed random sample (1996 and 2001) to a cluster sample (in 2009) made the fi eldwork easier, as less time was required for data collection, analysis of results and identifi ca-tion of drug use trends. However, the introducca-tion of a selection method using clusters increased the variability among the respondents and reduced the accuracy that had previously been achieved in the 1996 and 2001 studies. This diffi culty was offset by an increase in sample size. Weights were assigned to the sampling units in the three studies so that the distribution of respondents in the sample would refl ect the distribution of students in the general college population, without affecting the results or their scope. Although the sample design in the 2009 study was different from the previous years, the comparability was not limited. Kish7 (1965)
stated that comparison between distinct sampling plans does not interfere with or bias the inferential analyses
h Nicastri S, Oliveira LG, Wagner GA, Andrade AG. Prevalência e padrão de uso de tabaco e outras drogas (exceto álcool): estimativa de
abuso e dependência. In: Andrade AG, Duarte PCAV, Oliveira LG. I Levantamento nacional sobre o uso de álcool, tabaco e outras drogas entre universitários das 27 capitais brasileiras. Brasília: Secretaria Nacional de políticas sobre Drogas; 2010. p.129-82.
i Oliveira LG, Galduróz JCF, Wagner GA, Andrade AG. Uso de drogas pelos universitários brasileiros: contexto nacional e internacional. In:
1. Andrade AG, Queiroz S, Villaboim RCM, César CLG, Alves MCGP, Bassit AZ. Uso de álcool e drogas entre alunos de graduação da Universidade de São Paulo. Rev ABP-APAL. 1997;19(2):53-9.
2. Bolfarine HE, Bussab WO. Elementos de Amostragem. São Paulo: Edgard Blücher; 2005.
3. Cochran WG. Sampling Techniques. 3.ed. New York: John Wiley; 1977.
4. Galduróz JC, Noto AR, Nappo SA, Carlini EA. Trends in drug use among students in Brasil: analysis of four surveys in 1987, 1989, 1993 and 1997. Braz J Med Biol Res. 2004;37(4):523-31. DOI: 10.1590/S0100-879X2004000400009
5. Hingson RW, Zha W. Age of drinking onset, alcohol use disorders, frequent heavy drinking, and unintentionally injuring oneself and others after drinking. Pediatrics. 2009;123(6):1477-84. DOI: 10.1542/peds.2008-2176
6. Johnston LD, O’Malley PM, Bachman JG, Schulenberg JE. Monitoring the future national survey results on drug use, 1975-2006: volume ii: college students and adults ages 19-45. Bethesda: National Institute on Drug Abuse; 2009.
7. Kish L. Survey Sampling. New York: Wiley;1965. 8. Kutner MH, Li W, Nachtsheim CJ, Neter J, Wasserman
W. Applied Linear Statistical Models. 5.ed. London: McGraw-Hill Irwin; 2004.
9. Nelson TF, Xuan Z, Lee H, Weitzman ER, Wechsler H. Persistence of heavy drinking and ensuing
consequences at heavy drinking colleges. J Stud Alcohol Drugs. 2009;70(5):726-34.
10. Oliveira LG, Barroso LP, Wagner GA, Ponce J, Malbergier A, Stempliuk VA, et al. Drug consumption among medical students in São Paulo, Brasil: infl uences of gender and academic year. Rev Bras Psiquiatr. 2009;31(3):227-39. DOI: 10.1590/S1516-44462009000300008
11. Presley CA, Pimentel ER. The introduction of the heavy and frequent drinker: a proposed classifi cation to increase accuracy of alcohol assessments in postsecondary educational settings. J Stud Alcohol. 2006;67(2):324-31.
12. Rubin DB. Multiple imputation for nonresponse in surveys. New York: Wiley; 1987.
13. Stempliuk VA, Barroso LP, Andrade AG, Nicastri S, Malbergier A. Comparative study of drug use among undergraduate students at the College of São Paulo - São Paulo campus in 1996 and 2001. Rev Bras Psiquiatr. 2005;27(3):185-93. DOI: 10.1590/S1516-44462005000300006
14. Wagner GA, Andrade AG. Uso de álcool, tabaco e outras drogas entre estudantes universitários brasileiros. Psiquiat Clin. 2008;35(Supl I):45-8. DOI: 10.1590/S0101-60832008000700011
15. Wagner GA, Stempliuk VA, Zilberman ML, Barroso LP, Andrade AG. Alcohol and drug use among college students: gender differences. Rev Bras Psiquiatr. 2007;29(2):123-9. DOI:10.1590/S1516-44462006005000033
REFERENCES
This study was funded by Secretaria Nacional de Políticas sobre Drogas (Procedural n° 9/2008).
Wagner GA and Oliveira LG were supported by the Fundação de Amparo à Pesquisa do Estado de São Paulo (Research Support Foundation of the State of São Paulo – FAPESP, Procedural no. 09/51.901-2 and 2008/55.550-7, respectively). This paper was based on doctoral thesis of Wagner GA presented to Faculdade de Medicina da Universidade de São Paulo in 2011.
The authors declare no confl icts of interest.
provided these have been based on good selection and probability methods.
Drug use among undergraduate college students at the university studied remains high compared with other Brazilian contexts, but these students appear to be consuming fewer drugs than that reported in the 1996 and 2001 surveys, particularly regarding drug use in the preceding 30 days. The prevalence of alcohol use
in this population is remarkable as a ceiling for lifetime use was reached (92.5%).