Potential impacts of climate variability on respiratory
morbidity in children, infants, and adults*
Potenciais impactos da variabilidade climática sobre a morbidade respiratória em crianças, lactentes e adultos
Amaury de Souza, Widinei Alves Fernandes, Hamilton Germano Pavão, Giancarlo Lastoria, Edilce do Amaral Albrez
Abstract
Objective: To determine whether climate variability influences the number of hospitalizations for respiratory diseases in infants, children, and adults in the city of Campo Grande, Brazil. Methods: We used daily data on admissions for respiratory diseases, precipitation, air temperature, humidity, and wind speed for the 2004-2008 period. We calculated the thermal comfort index, effective temperature, and effective temperature with wind speed (wind-chill or heat index) using the meteorological data obtained. Generalized linear models, with Poisson multiple regression, were used in order to predict hospitalizations for respiratory disease. Results: The variables studied were (collectively) found to show relatively high correlation coefficients in relation to hospital admission for pneumonia in children (R2 = 68.4%), infants (R2 = 71.8%), and adults (R2 = 81.8%). Conclusions: Our results indicate a quantitative risk for an increase in the number of hospitalizations of children, infants, and adults, according to the increase or decrease in temperature, humidity, precipitation, wind speed, and thermal comfort index in the city under study.
Keywords: Meteorology; Pneumonia/epidemiology; Risk factors.
Resumo
Objetivo: Estudar a relação existente entre a o número de internações por doenças do aparelho respiratório em lactentes, crianças e adultos e as variações meteorológicas na cidade de Campo Grande (MS). Métodos: Foram utilizados dados diários de internações por doenças respiratórias, precipitação, temperatura do ar, umidade e velocidade dos ventos entre 2004 e 2008. Foram calculados os índices de conforto térmico humano, temperatura efetiva e temperatura efetiva com velocidade do vento com base nas variáveis meteorológicas. Foram realizados modelos lineares generalizados utilizando o modelo múltiplo de regressão de Poisson para predizer as internações por doenças respiratórias. Resultados: Foram observados valores relativamente elevados dos coeficientes de correlação entre as variáveis estudadas e internações por pneumonia em crianças (R2 = 68,4%), lactentes (R2 = 71,8%) e adultos (R2 = 81,8%). Conclusões: Os resultados aqui apresentados indicam em termos quantitativos o risco para um aumento no número de hospitalizações de crianças, lactentes e adultos de acordo com o aumento ou a diminuição das temperaturas, umidade, precipitação, velocidade dos ventos e índice de conforto térmico na cidade de Campo Grande.
Descritores: Meteorologia; Pneumonia/epidemiologia; Fatores de risco.
* Study carried out at under the auspices of the Graduate Program in Environmental Technologies, Exact Sciences and Technology Center, Federal University of Mato Grosso do Sul, Brazil.
Correspondence to: Amaury de Souza. Centro de Ciências Exatas e Tecnologia, Universidade Federal de Mato Grosso do Sul, Programa de Pós-Graduação em Tecnologias Ambientais, Caixa Postal 549, CEP 79070-900, Campo Grande, MS, Brasil. Tel. 55 67 3345-7990. E-mail: amaury.de@uol.com.br
Financial support: None.
Submitted: 13 June 2012. Accepted, after review: 25 September 2012.
Introduction
The risk factors for hospitalization due to respiratory diseases include exposure to environmental pollutants (especially smoking), household crowding, deficit in nutritional status, climate seasonality, incomplete immunization schedules, low socioeconomic status and exposure
to biological agents such as pollen. These factors affect mainly individuals at the extremes of age, such as children under 5 years of age or elderly individuals over 65 years of age.(1-3)
with pneumonia. The period from January 1, 2004 to December 31, 2008 was analyzed. Respiratory diseases were encoded according to the International Classification of Diseases, 9th revision (460-519). Information regarding precipitation, air temperature, humidity and wind speed were obtained from the Empresa Brasileira de Pesquisa Agropecuária, Gado de Corte (Brazilian Agency for Agricultural Research, Beef Cattle Division, Campo Grande, Brazil). Thermal comfort can be defined as the condition of the mind which expresses satisfaction with the thermal environment. Therefore, each person will have their own thermal comfort. Thermal comfort is affected by air temperature, air movement (speed), humidity, clothing, level of activity (amount of physical work performed), mean radiant temperature (mean temperature of walls, ground, windows, etc.) and several other factors. However, the principal environmental factors which contribute to thermal comfort are air temperature, humidity and air speed, which were considered in this study. In order to analyze the thermal comfort during the study period, two indices were used in which the physiological processes of the human body are not taken into account, although the triggering processes of the physiological responses to thermal stress that causes cold or heat are considered.(16)
Among the indices used in determining the availability of thermal comfort in the geographical level is the index of effective temperature, defined by the following equation:
ET = T – 0.4 × (T − 10) × (1 − RH/100) (1)
where ET is the effective temperature (in °C), T is the dry bulb temperature (in °C), and RH is the relative humidity (%). An index which depends on wind speed as well as on temperature and humidity was also used and is defined by the following equation:
ETW = 37 − (37 − T)/[0.68 – 0.0014
× RH + 1/(1.76 + 1.4 × v × 0.75)]
– 0.29 × T × (1 − RH/100)
(2)
where ETW is the effective temperature in function of wind (in °C) and v is wind speed (m/s).
The human thermal comfort index (HTCI) is divided into nine ranges, varying from very cold to very hot: very cold (< 13°C), cold (13-16°C), moderate cold (16-19°C ), slightly cold (19-22°C) comfortable (22-25°C), slightly warm (25-28°C), the respiratory system.(4) Health risks include those
directly related to climate and those that occur indirectly, due to sensitive biological systems, such as vector-borne infections, pathogens that contaminate food, production of aeroallergens and water-acquired diseases.(5,6)
Although several effects of climate seasonality in public health in areas of temperate and subtropical climate have been documented,(7-9)
the relationships between health and climate have yet to be understood.(10) Some studies have found
a connection between temperature or humidity and the increase in the proportion of respiratory diseases, however, those studies were based on secondary data, which are subject to bias, and this causes concern about their methodological validity and reliability.(11-13)
The diversity of landscape and architectural solutions has created a variety of open spaces where the thermal comfort conditions were determined. The methods employed were based on neutral outdoor temperature and in new effective temperature for the application of an adaptive model. The results showed that proper ventilation, and especially shading are absolutely necessary, adding value to these spaces and, consequently, to the architecture of the facility, which had as its starting point adaptation to the climate and the weight given to spaces. The open spaces studied showed satisfactory thermal comfort, principally due to the appropriate consideration of shading and ventilation strategies in architectural and landscaping design, as well as in the buildings.(14)
Regardless of the hypotheses of global climate variations caused by human activities, it is nevertheless more evident that the ability to control or alter the climate and the weather is still very limited to local climate, principally in urban areas.(15) Therefore, the objective of
this study was to investigate the relationship between the number of hospitalizations due to respiratory diseases in infants, children and adults and climate variability in Campo Grande (MS).
Methods
year. There was also a decrease in morbidity from pneumonia in the warmer months (January, February, November and December).
Relatively high values of correlation coefficients between hospitalizations due to pneumonia in different age groups and the studied variables were observed. In children, infants and adults,
respectively, these varied from −0.77 to 0.83, −0.79 to 0.84 and −0.86 to 0.89. Negative values
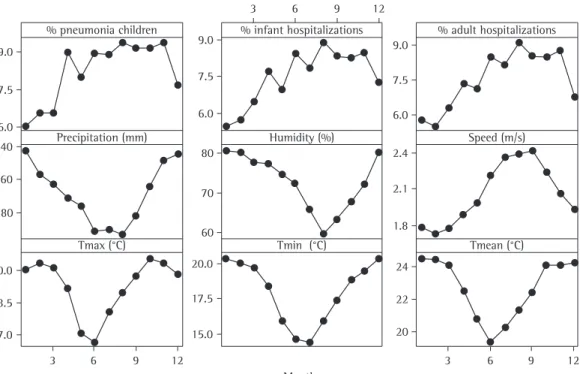
indicate an inverse relationship between the variables, that is, as the number of hospitalizations increases, for example, these variables tend to decrease, which can be observed in Figure 1. The curves of the graphs of the HTCI (without speed and with speed)(18-20) have the same shape
and behavior of the temperatures obtained in the present study, in the shape of a V (Figure 1).
In the analysis of the principal components, after varimax rotation, which included only the climate variables and the level of comfort, the extraction of two factors is observed, with a total explained variance in relation to hospitalizations due to pneumonia in children, infants and adults respectively, of 82.9%, 83.6% and 83.9% (Table 1). Factor 1 presents explained variances of 68.8%, 69.0% and 68.8%, respectively, in relation to hospitalizations due to pneumonia in children, infants and adults, with high positive weights for the group of temperatures (ranging from 0.82 to 0.99). However, based on this factor, it is believed that an increase or decrease in temperature may result in a slight increase in hospitalization due to pneumonia. For factor 2, explained variance was 14.1%, 14.6% and 15.1%, respectively, in relation to hospitalizations in the same age groups, with high negative weights to the relative humidity and precipitation and
less weight to wind speed (−0.994, −0.83 and −0.28, respectively), opposed to the number of
hospitalizations due to pneumonia, indicating that the decrease in humidity, precipitation and wind speed (polar high winds, which are characterized by being cold and dry) favor hospitalization due to pneumonia (Table 1).
Tables 2, 3 and 4 show the relative risks and the explanatory variables for the model in relation to children, infants and adults. The b coefficients assumed negative and positive values depending on the variable, confirming that the number of hospitalizations decreases when these values rise, that is, the lower the TCI, the greater the number of people with respiratory diseases and moderately warm (28-31°C), hot (31-34°C) and
very hot (> 34°C). These are known Fanger’s comfort criteria(16) and were obtained as a result
of measurements of physiological responses of the human being when exposed to heat or cold. Climate variables such as temperature, humidity, wind speed and radiation affect the HTCI directly and, in general, the behavior of individuals. That is the importance of the study of biometeorological indices. In the present study, the maximum ET, minimum ET, mean ET, maximum ETW, minimum ETW and mean ETW were calculated using equations 1 and 2.
Quantitative variables were described using central tendency (mean and median) and dispersion (standard deviation and percentiles) with the calculation of coefficients of variation. Subsequently, generalized linear models were performed using the Poisson multiple regression model.(17) In order to construct the models climate
variables that showed p values < 0.25 in univariate Poisson regression model were selected, which were then used in Poisson multiple regression model by the following equation:
log (E(Y)) = α + ∑βi (Xi) (3)
where Y is the daily count of admissions, E (Y) is the expected value of count, α and β are the parameters to be estimated and Xi represents the independent variables. The relative risk, using the parameters estimated in the model, was calculated using the following equation:
RR = exp(β × X) (4)
where RR is the relative risk, X is the value of the independent variable, and β is the parameter estimated by Poisson regression.
Results
can be performed using the graph of residual deviations of each observation in relation to the values adjusted by the model. The graph of a well-adjusted model presents points as close as
possible to zero in the interval between −2 and 2.
The adjusted model for children was as follows: vice versa. The highest relative risk (95% CI) was
for the variable minimum temperature, followed by the biometeorological indicator which involves temperatures, relative humidity and wind speed.
Residual analysis was performed in order to evaluate the adjustment of the model. Such analysis
Figure 1 - Temporal variation of the variables in function of the months of the year.
Table 1 - Results of analysis of the two main factors for the variables in relation to visits for pneumonia in children, infants and adults. Factor 1 was associated with a group of variables related to human energy and thermal comfort, and factor 2 was associated with the humidity component, involving precipitation and relative humidity.
Variable Children Infants Adults
Factor 1 Factor 2 Factor 1 Factor 2 Factor 1 Factor 2
Precipitation 0.24 −0.83 0.57 −0.65 0.29 −0.79
Humidity 0.42 −0.90 0.01 −0.99 0.37 −0.91
Speed 0.07 −0.28 0.02 −0.26 0.06 −0.22
Tmax 0.98 −0.16 0.96 0.25 0.99 −0.12
Tmin 0.03 −0.95 0.41 −0.85 0.07 −0.94
Tmean −0.17 0.41 −0.32 0.27 −0.19 0.40
ETmax 0.95 −0.28 0.98 0.14 0.96 −0.24
ETmin 0.82 −0.55 0.97 −0.17 0.84 −0.51
ETmean 0.89 −0.43 0.99 −0.03 0.91 −0.39
ETWmax 0.97 −0.18 0.96 0.24 0.98 −0.14
ETWmin 0.90 −0.36 0.97 0.05 0.92 −0.32
ETWmean 0.92 −0.39 0.99 0.03 0.93 −0.34
Variation, % 68.8 14.1 69.0 14.6 68.8 15.1
presenting respiratory symptoms during the winter was associated with a significant reduction in humidity as a result of the low precipitation rates and low temperatures.
Discussion
In this group of statistical models, the dependent variable (number of hospitalizations) is a counting process, that is, it is a discrete quantitative variable, whereas the independent variables are candidates to explain the behavior of the series over time. As independent variables, we used the climate variables (maximum mean and minimum temperatures, humidity, HTCI, wind speed and precipitation). The variables “weekday” and “holiday” were used to control the short-term seasonality. The variable “year” was used to control long-term seasonality.
Positive associations were found between climate variables and the incidence of respiratory
log Pchil = −2.31 – 0.00044 × P + 0.0166
× RH + 2.20 × V + 0.014 ×ETmin
where Pchil is the number of children with pneumonia, P is the precipitation, S is the speed of the winds and ETmin is the minimum ET, with R2 = 68.4% and adjusted R2 = 50.3%.
The adjusted model for infants was as follows:
log Pinf = −2.50 – 0.00102 × P + 0.0128
× RH + 2.03 × V + 0.045 × ETmin
where Pinf is the number of infants with pneumonia, with R2 = 71.8% and adjusted
R2 = 55.6%.
The adjusted model for adults was as follows:
log Padul = 2.74 + 0.00221 × P – 0.0233 × RH + 1.43 × V – 0.053 × ETWmin
where Padul is the number of adults with pneumonia, with R2 = 81.1% and adjusted
R2 = 70.4%. The increased number of individuals
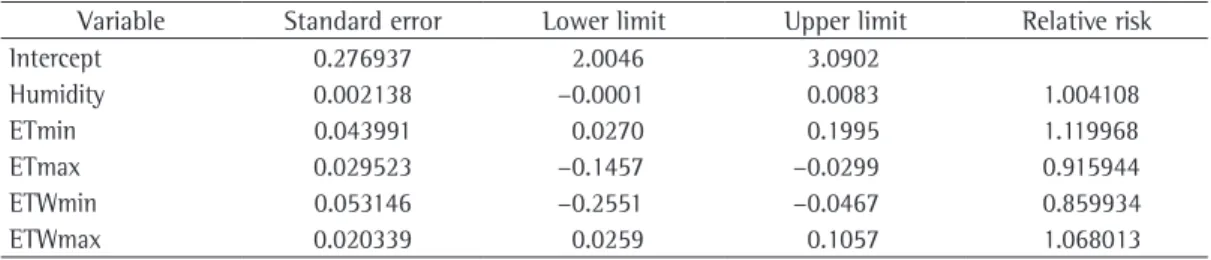
Table 2 - Regression coefficients, standard error and 95% confidence intervals for the model to children. Variable Standard error Lower limit Upper limit Relative risk
Intercept 0.276937 2.0046 3.0902
Humidity 0.002138 −0.0001 0.0083 1.004108
ETmin 0.043991 0.0270 0.1995 1.119968
ETmax 0.029523 −0.1457 −0.0299 0.915944
ETWmin 0.053146 −0.2551 −0.0467 0.859934
ETWmax 0.020339 0.0259 0.1057 1.068013
T: temperature; max: maximum; min: minimum; ET: effective temperature; and ETW: effective temperature in function of wind.
Table 3 - Regression coefficients, standard error and 95% confidence intervals for the model to infants. Variable Standard error Lower limit Upper limit Relative risk
Intercept 0.4563 1.4025 2.3151
ETmin 0.0614 0.1097 0.2325 1.186609
ETmax 0.0695 -0.2879 −0.1489 0.803804
ET: effective temperature; min: minimum; and max: maximum.
Table 4 - Regression coefficients, standard error and 95% confidence intervals for the model to adults. Variable Standard error Lower limit Upper limit Relative risk
Intercept 0.3234 2.2593 2.9061
ETmin 0.05414 0.00076 0.10904 1.056435
ETmax 0.0223 −0.2512 −0.2066 0.795408
ETWmin 0.0351 −0.2091 −0.1389 0.840297
ETWmax 0.0204 0.0441 0.0849 1.066626
hospitalization rate, Figure 1). This time of year, precipitation is very rare, with an average of only 4-5 days of rain per month. The dry season takes place in the winter quarter, that is, June to August, with low humidity, low temperatures and higher hospitalization risks (Figure 1 and Tables 2, 3 and 4).
The highest mean temperatures are observed between the months of October and March, which corresponds to summer in the domain of tropical climates in the Southern hemisphere, and the month of October presents the highest means and the highest hospitalization rates, since, during this month, the transition between the dry and rainy seasons takes place. Therefore, changes in atmospheric circulation patterns, high rates of evapotranspiration, low mean of wind speeds, incipient precipitation and low humidity favor the increase in temperatures, which indicate the beginning of summer. Another analysis that can be carried out from the temperatures is that the temperature range observed between the months with higher and lower temperatures are very low, with a mean variation of 4°C on between June (lower mean temperatures) and October (hottest month and high hospitalization rate; Figure 1).
The rainy season (October to March/ April) concentrates more than 85% of annual precipitation, and December and January contribute with more than 35% of the annual precipitation. In contrast, the dry season, which in some years starts in April and extends to the beginning of October, is characterized by a significant decrease in precipitation, and in the driest quarter of the year (June-August), the precipitations represent on average less than 2% of the annual total.
Regarding the occurrence of daily doldrums and intensity of the winds on the surface, it appears that, between May and September, respectively, there is the occurrence the lowest and highest values. This is justified by the greater frequency of polar air masses, promoting a greater variation in pressure gradients. This fact reduces the time of permanence of particles in the atmosphere, but increases the chance of fires by the addition to the oxygen flow. The distribution of the directions of the winds at 10 m height varies greatly; winds have predominant north and northeast direction, with a mean intensity of 2.06 m/s.
The results presented here quantitatively indicate the risk for an increase in the number of hospitalizations of children, infants and diseases (pneumonia) in Campo Grande. These
effects are similar to those found in other cities of Brazil, particularly those observed in São Paulo (SP),(4) both in the diversity of climate indicators
associated and in the magnitude of the estimated effects. The increased incidence of respiratory disease (pneumonia) during the colder periods of the year is due to the principal factor: the low temperatures, as shown by the relative risks for hospitalization due to respiratory diseases (pneumonia; Tables 2, 3 and 4).
Humans have an ideal temperature range. They possess the ability to adapt to environmental conditions, causing the body to function properly within a relatively wide range of temperature, according to Fanger’s comfort criteria. For the ETmin index, in which the minimum temperatures and relative humidity were used, there were 1.4% of comfortable days; for the ETmax index, in which the maximum temperatures and mean relative humidity were used, there were 11.4% of comfortable days, whereas for the ETmean index (mean temperatures and mean relative humidity), 48.8% of days were comfortable, showing that the latter is the best indicator for the distribution of days within the comfort zone of 22-25°C. Regarding ETmin (minimum temperatures, relative humidity and wind speed), ETmax (maximum temperature, relative humidity and wind speed) and ETmean (mean temperatures, relative humidity and wind speed) indices, there were respectively 5.3 %, 5.5% and 26.7% of comfortable days.
As noted, the effects caused by the increase and decrease of the temperatures are significantly different and affect children, infants and adults. Temperature variations have caused higher risks of hospitalizations (Tables 2, 3 and 4) precisely because most people, as cities and urban construction, are neither prepared nor adapted to the changes that are occurring.
prevalence in middle-school children in Taiwan. Eur Respir J. 2003;21(6):964-70. PMid:12797489. http:// dx.doi.org/10.1183/09031936.03.00094602
10. Gosai A, Salinger J, Dirks K. Climate and respiratory disease in Auckland, New Zealand. Aust N Z J Public Health. 2009;33(6):521-6. PMid:20078568. http://dx.doi. org/10.1111/j.1753-6405.2009.00447.x
11. Kendrovski VT. The impact of ambient temperature on mortality among the urban population in Skopje, Macedonia during the period 1996-2000. BMC Public Health. 2006;6:44. PMid:16504096 PMCid:1403761. http://dx.doi.org/10.1186/1471-2458-6-44
12. Liang WM, Liu WP, Kuo HW. Diurnal temperature range and emergency room admissions for chronic obstructive pulmonary disease in Taiwan. Int J Biometeorol. 2009;53(1):17-23. PMid:18989710. http:// dx.doi.org/10.1007/s00484-008-0187-y
13. Green RS, Basu R, Malig B, Broadwin R, Kim JJ, Ostro B. The effect of temperature on hospital admissions in nine California counties. Int J Public Health. 2010;55(2):113-21. PMid:19771392. http://dx.doi.org/10.1007/ s00038-009-0076-0
14. Monteiro LM, Duarte D, Gonçalves J, Alucci MP. Conforto térmico como condicionante do projeto arquitetônico-paisagístico: o caso dos espaços abertos do novo centro de pesquisas da Petrobras no Rio de Janeiro, CENPES II. Ambiente Construído. 2008;8(4):61-86.
15. Ayoade JO. Introdução à Climatologia para os Trópicos. São Paulo: Bertrand Brasil; 1991.
16. Fanger PO. Thermal Comfort - Analysis and Application in Environmental Engineering. New York: McGraw-Hill; 1972. 17. Tadano YS, Ugaya CM, Franco AT. Método de regressão
de Poisson: metodologia para avaliação do impacto da poluição atmosférica na saúde populacional. Ambiente e Sociedade. 2009;12(2):241-55. http://dx.doi.org/10.1590/ S1414-753X2009000200003
18. Braga AL, Zanobetti A, Schwartz J. The time course of weather-related deaths. Epidemiology. 2001;12(6):662-7. PMid:11679794. http://dx.doi.org/10.1097/00001648-200111000-00014 19. Curriero FC, Heiner KS, Samet JM, Zeger SL, Strug L,
Patz JA. Temperature and mortality in 11 cities of the eastern United States. Am J Epidemiol. 2002;155(1):80-7. PMid:11772788. http://dx.doi.org/10.1093/aje/155.1.80 20. Baccini M, Biggeri A, Accetta G, Kosatsky T, Katsouyanni
K, Analitis A, et al. Heat effects on mortality in 15 European cities. Epidemiology. 2008;19(5):711-9. http:// dx.doi.org/10.1097/EDE.0b013e318176bfcd
adults according to the increase or decrease in temperature, humidity, precipitation, wind speed and thermal comfort indices in Campo Grande. The results suggest that the minimum and maximum temperatures promote adverse effects on the health of children, infants and adults.
References
1. IV Brazilian Guidelines for the management
of asthma [Article in Portuguese]. J Bras
Pneumol. 2006;32(Suppl 7):S447-S474. PMid:17420905. 2. Cançado JE, Braga A, Pereira LA, Arbex MA, Saldiva
PH, Santos Ude P. Clinical repercussions of exposure
to atmospheric pollution [Article in Portuguese]. J Bras
Pneumol. 2006;32(Suppl 2):S5-S11. PMid:17273599. http://dx.doi.org/10.1590/S1806-37132006000800003 3. Nascimento LF, Marcitelli R, Agostinho FS, Gimenes CS.
Análise hierarquizada dos fatores de risco para pneumonia em crianças. J Bras Pneumol. 2004;30(5):445-51. http:// dx.doi.org/10.1590/S1806-37132004000500008 4. Rosa AM, Ignotti E, Botelho C, Castro HA, Hacon SS.
Respiratory disease and climatic seasonality in children under 15 years old in a town in the Brazilian Amazon. J Pediatr (Rio J). 2008;84(6):543-9. http://dx.doi. org/10.1590/S0021-75572008000700012
5. Ezzati M, Lopez AD, Rodgers A, Vander Hoorn S, Murray CJ; Comparative Risk Assessment Collaborating Group. Selected major risk factors and global and regional burden of disease. Lancet. 2002;360(9343):1347-60. http://dx.doi.org/10.1016/S0140-6736(02)11403-6 6. Global Partnership to Roll Back Malaria. Using climate to
predict infectious disease outbreaks: a review. Geneva: World Health Organization; 2004.
7. Zanolin ME, Pattaro C, Corsico A, Bugiani M, Carrozzi L, Casali L, et al. The role of climate on the geographic variability of asthma, allergic rhinitis and respiratory symptoms: results from the Italian study of asthma in young adults. Allergy. 2004;59(3):306-14. PMid:14982513. http://dx.doi.org/10.1046/j.1398-9995.2003.00391.x 8. Moyes CD, Waldon J, Ramadas D, Crane J, Pearce
N. Respiratory symptoms and environmental factors in schoolchildren in the Bay of Plenty. N Z Med J. 1995;108(1007):358-61. PMid:7566773.
About the authors
Amaury de Souza
Professor. Graduate Program in Environmental Technologies, Exact Sciences and Technology Center, Federal University of Mato Grosso do Sul, Brazil.
Widinei Alves Fernandes
Professor. Graduate Program in Environmental Technologies, Exact Sciences and Technology Center, Federal University of Mato Grosso do Sul, Brazil.
Hamilton Germano Pavão
Professor. Graduate Program in Environmental Technologies, Exact Sciences and Technology Center, Federal University of Mato Grosso do Sul, Brazil.
Giancarlo Lastoria
Professor. Graduate Program in Environmental Technologies, Exact Sciences and Technology Center, Federal University of Mato Grosso do Sul, Brazil.
Edilce do Amaral Albrez