Asso ciatio n o f acantho sis nigricans
with race and m e tabo lic disturbance s
in o be se wo m e n
1Seção de Endocrinologia, Hospital Universitário Prof. Edgard Santos,
Faculdade de Medicina, Universidade Federal da Bahia, Salvador, BA, Brasil
2Fundação de Infectologia da Bahia, Universidade Federal da Bahia,
Salvador, BA, Brasil
3Laboratório de Investigação Médica (LIM 18), Faculdade de Medicina,
Universidade de São Paulo, São Paulo, SP, Brasil L.M.B. Araújo1,
M.V. Porto1,
E.M. Netto2
and M.J. Ursich3
Abstract
Acanthosis nigricans (AN) has been recognized as a marker of insulin resistance and diabetes mellitus. We have compared frequency of race and metabolic disturbances in obese women with several degrees of AN (AN group, N = 190) to a group without AN (non-AN group, N = 61) from a mixed racial population. The groups were similar regarding age and body mass index. All patients (except the diabetic patients) underwent an oral glucose tolerance test (75 g). The racial distribution of this population was 35.1% white, 37.8% mulatto and 27.1% black and the frequency of AN was 62.5, 82.1 and 83.8%, respectively, higher in black versus white (P = 0.003) and mulatto versus white (P = 0.002) women. The frequencies of diabetes mellitus and impaired glucose tolerance were 5.8 and 12.6% in the AN group and 1.6 and 8.2% in the non-AN group, respectively (P>0.05). Fasting glucose, ß cell function determined by the homeostasis model of assessment (HOMA), fasting insulin and insulin area under the curve were similar for the AN and non-AN groups. A higher HOMA insulin resistance was observed in the AN group compared to the non-AN group (P = 0.02) and in the subgroup of highest degree of AN compared to those with other degrees. The mean lipid levels and the frequency of dyslipidemia were similar for the two groups. AN was strongly associated with the black or mulatto rather than the white race, even after taking into account the effect of age, body mass index and HOMA insulin resistance.
Co rre spo nde nce
L.M.B. Araújo Seção de Endocrinologia Hospital Universitário Prof. Edgard Santos
Rua Augusto Viana, s/n, 6º andar 40110-160 Salvador, BA Brasil
Fax: + 55-71-247-8492 E-mail: lmba@ ufba.br
L.M.B. Araújo is the recipient of a
CNPq Scientific Productivity grant. Publication supported by FAPESP.
Received April 16, 2001 Accepted O ctober 16, 2001
Ke y wo rds
·Acanthosis nigricans
·Race
·O besity
·Insulin resistance
·Hyperinsulinism
Intro ductio n
Acanthosis nigricans (AN) is a cutaneous abnormality characterized by a hyperpig-mented velvety cutaneous thickening that can occur on any part of the body: axillae, nape and sides of the neck, the groin, antecu-bital and popliteal surfaces, umbilical area and even mucosal surfaces. Both
hyperpig-mentation and papillomatosis are usual on the skin but papillomatosis is more common on the mucosal surface (1).
resis-tance. Other metabolic conditions such as diabetes mellitus and impaired glucose tol-erance and some other clusters of metabolic syndromes such as dyslipidemia, polycystic ovary and arterial hypertension could also be associated. Several other endocrine diseases are also associated with AN: acromegaly, hyperprolactinemia, Cushings syndrome, hirsutism, hyperthyroidism, hypothyroidism, Addisons disease, and lipoatrophic diabe-tes (8). Some of these conditions are also associated with obesity and insulin resis-tance.
Several investigators have described the prevalence of AN in small groups of obese patients and some of them have shown increased fasting insulin levels in patients with AN compared to patients without AN (8,10-12). Insulin resistance was evaluated in few reports. In a larger study of 137 Mexican Americans with AN, Burke et al. (16) suggested a quantitative scale of AN and showed a strong association of this scale with fasting insulin and body mass index (BMI). They also described an association with elevated fasting glucose and low HDL-cholesterol in non-diabetic patients and with elevated cholesterol levels only in diabetic subjects.
In the present investigation, we studied insulin secretion in response to glucose over-load, insulin resistance and lipid profile in obese women from a mixed racial popula-tion with and without AN to determine if AN is associated with race, insulin resistance and higher frequency of metabolic distur-bances.
Mate rial and Me tho ds
A total of 251 obese women (BMI from 30.3 to 71.9 kg/m2) from an obesity
outpa-tient clinic who were seeking obesity treat-ment were enrolled consecutively prior to being placed on a diet. All patients with chronic diseases or taking medication that would change glucose tolerance or induce
AN were excluded. This research was ap-proved by the Prof. Edgard Santos Hospital Ethics Committee and the participants gave informed consent.
AN was identified and classified accord-ing to the followaccord-ing scale: 0, no AN; 1+, fine verrucous plaques with or without pigmen-tation in the neck or axillae; 2+, coarse ver-rucous plaque with or without pigmentation in the neck or axillae; 3+, coarse verrucous plaque with or without pigmentation on the neck or axillae, on the trunk and on one pair of extremities, and 4+, more severe than the last one, involving more than one pair of extremities or on mucosal membranes (11). One of the authors (L.M.B.A.) plus a second examiner observed all patients.
The women were from Salvador, Bahia, Northeastern Brazil, where there is a mixed race population, mostly black and mulatto of African American ancestry. Their race was determined based on phenotype appearance and skin color according to Krieger et al. (17).
All patients underwent an oral glucose tolerance test (75 g). Plasma glucose was measured by the glucose-oxidase method and serum insulin by radioimmunoassay 0, 1 and 2 h after the glucose load. The patients were classified as diabetic or as having im-paired glucose tolerance according to World Health Organization criteria (18).
Serum levels of total cholesterol, HDL-cholesterol, and triglycerides were deter-mined with an auto-analyzer (Vitalab, Selectra, Merck KGaA, Darmstadt, Ger-many), with standard enzymatic procedures. The insulin area under the curve (AUC) of the oral glucose tolerance test (0-2 h) was calculated by the trapezoidal method. The ß cell function (HOMA ß cell) and the insulin resistance (HOMA IR) were evaluated with a homeostasis model of assessment (19):
HOMA ß cell = (insulin µU/ml *20)/ fasting glucose (mmol/l) - 3.5 HOMA IR = [insulin µU/ml x fasting
Statistical analysis
Statistical analysis was performed using the Epi-Info software, version 6.0. The Student t-test was applied to normally dis-tributed data and analysis of variance (Mann-Whitney and Kruskal-Wallis tests) to other data distributions. For proportion analysis, the Epi-Table calculator was used. The dif-ferences were considered to be statistically significant when P£0.05.
Logistic regression was performed using the Statistical Package for the Social Sci-ences (SPSS, version 9.0). BMI and HOMA insulin resistance were normalized using logarithmic transformation. AN was recorded as presence or absence of the attribute.
The five subgroups of AN were com-pared with the other variables by ANOVA adjusted for multiple comparison (Bonfer-roni).
Re sults
Clinical characteristics, fasting glucose
and insulin levels, insulin AUC and HOMA insulin resistance of the patients according to the degree of AN are presented in Table 1. Age, BMI and waist diameter were similar for the AN and non-AN groups.
The AN group had similar fasting glu-cose, ß cell function, fasting insulin levels and insulin AUC when compared with the non-AN group. Only HOMA insulin resis-tance was significantly higher in the AN group as compared to the non-AN group (P = 0.02).
Fasting glucose levels among subgroups of AN were similar. Fasting insulin levels were higher in subgroup 4 of AN than in subgroup 1 (P = 0.04). HOMA insulin resis-tance was significantly higher in subgroup 4 of AN compared to all other subgroups (Table 1).
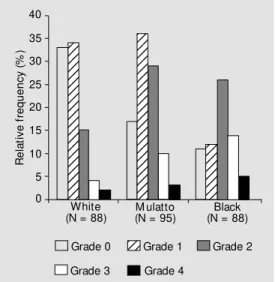
Seventy-six percent of the whole group had AN. The race distribution was 35% white, 38% mulatto and 27% black obese women. The frequency of AN in black (83.8%) and mulatto (82.1%) women was higher than in white women (62.5%) (P = 0.003 and 0.002,
Table 1. Clinical and metabolic parameters for the groups of obese w omen.
Grade of acanthosis nigricans P
0 1 2 3 4
(N = 56) (N = 82) (N = 69) (N = 28) (N = 11)
Age (years) 37 ± 9 35 ± 9 36 ± 9 34 ± 10 34 ± 9 0.83
BM I (kg/m2) 38 ± 8 39 ± 6 41 ± 7 42 ± 6 42 ± 8 0.12
Waist (cm) 102 ± 12 103 ± 12 106 ± 12 107 ± 12 109 ± 11 0.56
Fasting glucose (mmol/l) 4.8 ± 0.8 4.8 ± 0.9 5.0 ± 1.0 4.8 ± 0.6 5.4 ± 0.9 0.20
Fasting insulin (pmol/l) 116 ± 69 111 ± 80 114 ± 70 118 ± 62 180 ± 94* 0.08
Insulin AUC 396 ± 240 378 ± 258 414 ± 336 438 ± 222 492 ± 240 0.65
(pmol l-1 0-2 h-1)
HOM A IR 4.1 ± 2.4 4.2 ± 3.8 4.3 ± 2.8 4.2 ± 2.3 7.5 ± 4.8* *# 0.02
HOM A ß cell 494 ± 327 460 ± 302 465 ± 306 489 ± 266 649 ± 310 0.40
Total cholesterol (mmol/l) 4.8 ± 1.1 4.8 ± 0.9 4.8 ± 1.3 4.5 ± 1.0 4.9 ± 1.1 0.62
HDL-cholesterol (mmol/l) 1.16 ± 0.33 1.15 ± 0.36 1.19 ± 0.26 1.12 ± 0.31 1.17 ± 0.30 0.74
Triglycerides (mg% ) 119 ± 43 124 ± 56 114 ± 52 112 ± 53 141 ± 69 0.57
Data are reported as means ± SD. BM I, body mass index; AUC, area under the curve; HOM A, homeostasis model of assessment; IR, insulin resistance; HDL, high-density lipoprotein.
respectively). Figure 1 shows these data. AN was 2.5 times (95% CL: 1.2-5.2) more frequent in the mulatto race than in the white race. This difference increased to 4.1 times (95% CL: 1.7-9.4) when black women were compared to white women after adjust-ing for BMI, age and HOMA insulin resis-tance. BMI and age were significantly asso-ciated with AN (P = 0.004) but HOMA insulin resistance was not (P = 0.54).
The frequencies of diabetes mellitus and impaired glucose tolerance were 5.8 and 12.6% and tended to be higher in patients with AN than in patients without AN (1.6 and 8.2%, respectively), although the differ-ences were not significant.
The mean total cholesterol, HDL-choles-terol and triglyceride levels were similar for the group with AN and the group without AN. The frequencies of total cholesterol lev-els ³200 mg% (28.8 and 27.9%, AN and non-AN group, respectively), HDL-choles-terol levels <35 mg% (16.8 and 14.8%) or triglyceride levels ³200 mg% (8.4 and 6.6%) were similar.
D iscussio n
AN has been considered a marker of insulin resistance and a risk factor for type 2 diabetes mellitus, especially in young adults
(2-9,12,14,15). In the current study, a stron-ger association with AN was observed in black and mulatto women than in white obese women of a mixed race population. In con-trast, HOMA insulin resistance was not as-sociated with the AN group in multivariate analysis.
Hud et al. (11) have described higher fasting insulin levels in 25 obese women with AN in contrast to 9 without AN but this increase was not significant. Stuart et al. (10) studied fasting insulin levels in 1412 obese children and showed a good correlation be-tween fasting insulin concentration and the severity of AN. Matsuoka et al. (8) observed elevation of fasting glucose in 42% of 26 patients with endocrine and dermatological diseases and with AN. They also showed increased levels of fasting insulin and most of them had an exaggerated peak of insulin secretion in response to glucose overload. In contrast, another author did not find an in-crease in insulin response to glucose in women with polycystic ovaries and with AN versus patients without AN (7).
The present study has also shown higher HOMA insulin resistance in the subgroup with the highest degree of AN compared to the non-AN group or to the other subgroups. Insulin resistance, diabetes mellitus or im-paired glucose tolerance, low LDL-choles-terol and high triglycerides are the best mark-ers of metabolic syndromes. In our study, all patients were obese and the frequency of diabetes mellitus (5.8%) and impaired glu-cose tolerance (12.6%) tended to be higher in the AN group although lipid profiles were similar. In a study on 89 African Americans, Stuart et al. (13) observed non-insulin-de-pendent diabetes mellitus in 20% of the sub-jects with AN. Nearly a two-fold higher prevalence was observed in African Ameri-cans compared with US whites. It was sug-gested that AN would identify a subset with a higher risk to develop non-insulin-depend-ent diabetes mellitus. Burke et al. (16) have studied 137 Mexican Americans from the
R e la ti v e f re q u e n c y ( % ) 40 35 30 25 20 15 10 5 0 White
(N = 88) M ulatto(N = 95)
Black (N = 88)
12 12 12 12 12 12 12 12 12 12 12 12 12 12 12 12 12 12 12 12 12 123 123 123 123 123 123 123 123 123 123 123 123 123 123 123 123 123 123 123 123 123 123 12 12 12 12 12 12 12 12 123 123
Grade 0 Grade 1 Grade 2
Grade 3 Grade 4
San Antonio Texas Family Diabetes Study or from the San Antonio Texas Family Heart Study of both sexes compared to 269 indi-viduals without AN, all submitted to the oral glucose tolerance test. According to Ameri-can Diabetes Association criteria, they found type 2 diabetes in 27% patients of the AN group versus 19.7% in the non-AN group but the AN group subjects were younger and included many more obese subjects (89 ver-sus 52.4%) than the non-AN group. They observed no differences in total cholesterol and triglyceride levels between the groups, as also observed in the present study. They also showed that an elevated degree of AN was associated with higher fasting insulin and 2-h glucose after the oral glucose toler-ance test, with low HDL-cholesterol and diastolic blood pressure in non-diabetic sub-jects but with a higher total cholesterol, only in diabetic patients. These higher frequen-cies of metabolic abnormalities in compari-son to our data may be related to ethnic, nutritional or environmental factors.
In the present report, a global prevalence of AN was shown in 76% of the obese women, similar to the 74% value reported by Hud et al. (11) whose study included 56% of black obese women. A higher AN preva-lence in black obese women compared with white (85 and 57%, respectively) was also shown. A higher degree of AN in blacks and mulattos was observed. Some authors em-phasize the black race as one important de-terminant factor for AN (12). Stuart et al. (10) have found a much lower frequency of AN (7.1%) in 1412 obese children of white, black and Hispanic extraction, but only 27% of them were obese. They observed an AN frequency of 0.5% in white, 5.7% in His-panic and 13.3% in African American sub-jects. In 110 African American adults, Stuart et al. (13) observed a 77% frequency of AN. Barbiere et al. (3) described increased
androgen production, insulin resistance and AN, or hyperandrogenemia insulin resis-tance-AN syndrome in women with ovarian or adrenal tumors, congenital or adrenal hy-perplasia, and gonadal dysgenesis. In these cases, chronic hyperinsulinemia may stimu-late the increased ovarian androgen section and epidermis proliferasection, which re-sult in hirsutism, virilization and AN.
The etiology of AN is probably related to increased levels of a keratinocyte-stimulat-ing factor and of dermal fibroblasts. Insulin at high concentrations may activate insulin-like growth factor receptors and mediate epidermal cell proliferation (20,21). In cases of malignancy and pituitary adenoma asso-ciated with AN, an increased production of growth factors, insulin-like activity and trans-forming growth factor-a have been described (9). The latter is structurally related to epi-dermal growth factor. Antibodies against in-sulin receptors could explain the AN asso-ciation with other autoimmune diseases (22,23).
The presence of AN in this group of obese women was strongly associated with black and mulatto race but weakly with insu-lin AUC and HOMA insuinsu-lin resistance, in spite of higher insulin resistance. Since this lesion is easily recognized by skin inspec-tion, it should be carefully monitored in terms of the development of disorders of insulin resistance.
Ackno wle dgm e nts
Re fe re nce s
1. Schw artz RA (1994). Acanthosis nigri-cans. Journal of the American Academy of Dermatology, 31: 1-19.
2. Kahn CR, Flier JS, Bar RS, Archer JA, Gorden P, M artin M M & Roth J (1976). The syndrome of insulin resistance and acanthosis nigricans: insulin-receptor dis-orders in man. New England Journal of M edicine, 294: 739-745.
3. Barbiere RL, Smith S & Ryan KJ (1983). Hyperandrogenism, insulin resistance, and acanthosis nigricans syndrome: a com m on endocrinopathy w ith distant pathophysiologic features. American Jour-nal of Obstetrics and Gynecology, 147: 90-99.
4. Flier JS (1985). M etabolic importance of acanthosis nigricans. Archives of Derma-tology, 121: 193-194.
5. Peters EJ, Stuart CA & Prince EJ (1986). Prevalence of acanthosis nigricans and obesity: acquired and intrinsic defects in insulin action. M etabolism: Clinical and Experimental, 35: 807-813.
6. Flier JS, Eastman RC, M inaker KL, M atte-son D & Row e JW (1987). Acanthosis nigricans in obese w omen w ith hyperan-drogenism. Characterization of an insulin resistant state distinct of the type A and B syndrome. Diabetes, 34: 101-107. 7. Dunaif A, Graf M , M andeli J, Laumas V &
Dobrjansky A (1987). Characterization of groups of hyperandrogenic w omen w ith acanthosis nigricans, impaired glucose tol-erance, and/or hyperinsulinemia. Journal of Clinical Endocrinology and M etabolism, 65: 499-507.
8. M atsuoka LY, Wortsman J, Gavin JR & Goldman J (1987). Spectrum of endocrine abnormalities associated w ith acanthosis
nigricans. American Journal of M edicine, 83: 719-725.
9. Barth JH, Ng LL & Wojnarow ska F (1988). Acanthosis nigricans, insulin resistance and cutaneous virilism. British Journal of Dermatology, 118: 613-619.
10. Stuart CA, Pate CJ & Peters EJ (1989). Prevalence of acanthosis nigricans in an unselected population. American Journal of M edicine, 87: 269-272.
11. Hud JA, Cohen JB, Wagner JM & Cruz PD (1992). Prevalence and significance of acanthosis nigricans in an adult obese population. Archives of Dermatology, 128: 941-944.
12. St uart CA, Sm it h M M , Gilkison CR, Shaheb S & Stahn RM (1994). Acanthosis nigricans among native Americans: an in-dicator of high diabetes risk. American Journal of Public Health, 84: 1839-1842. 13. Stuart CA, Gilkison CR, Keenan BS &
Nagamani M (1997). Hyperinsulinemia and acanthosis nigricans in African Ameri-cans. Journal of the National M edical As-sociation, 89: 523-527.
14. Panidis D, Skiadopoulos S, Rousso D, Ioannides D & Panidou E (1995). Associa-tion of acanthosis nigricans w ith insulin resistance in patients w ith polycystic ovary syndrome. British Journal of Der-matology, 132: 936-941.
15. St uart CA, Gilkison CR, Sm it h M M , Bosma AM , Keenan BS & Nagamani M (1998). Acanthosis nigricans as a risk fac-tor for non-insulin dependent diabetes mellitus. Clinical Pediatrics, 37: 73-80. 16. Burke JP, Hale DE, Hazuda HP & Stern
M P (1999). A quantitative scale of acan-thosis nigricans. Diabetes Care, 22: 1655-1659.
17. Krieger H, Norton NE, Azevedo E, Freire-M aia A & Yasuda N (1965). Racial admix-ture in north-eastern Brazil. American Journal of Human Genetics, 29: 113-125. 18. World Health Organization (1995). Diabe-tes mellitus: Report of a WHO Study Group. World Health Organization, Teach Report Series, No. 727, Geneva, Sw itzer-land.
19. M atthew s DR, Hosker JP, Rudenski AS, Naylor BA, Treacher DF & Turner RL (1985). Homeostasis model assessment: insulin resistance and B-cell function from fasting plasma glucose and insulin con-centrations in man. Diabetologia, 28: 412-419.
20. Ellis DL, Kafka SP, Chow JC, Nanney LB, Inman WH, M cCadden M E & King Jr LE (1987). M elanoma, grow th factors, acan-thosis nigricans, the sign of Leser-Trelat, and multiple acronchordons: a possible role for alpha-transforming grow th factor in cutaneous paraneoplastic syndromes. New England Journal of M edicine, 17: 1582-1587.
21. M irsa P, Nickoloft BJ, M orhenn UB, Hintz RL & Rosenfeld RG (1986). Characteriza-tion of insulin-like grow th factor-1/so-matomedin C receptors on human kerati-nocyte monolayers. Journal of Investiga-tive Dermatology, 87: 264-267.
22. M oller DE & Flier JS (1991). Insulin resis-tance mechanisms, syndromes, and im-plications. New England Journal of M edi-cine, 325: 938-948.