“
Once upon a Time in the Mediterranean
”
Long Term Trends of Mediterranean Fisheries
Resources Based on Fishers
’
Traditional
Ecological Knowledge
Dimitrios Damalas1,2*, Christos D. Maravelias2, Giacomo C. Osio1, Francesc Maynou3, Mario Sbrana4, Paolo Sartor4
1European Commission, Joint Research Centre (JRC), Institute for the Protection and Security of the Citizen (IPSC), G.03 Maritime Affairs Unit, Fisheries and Aquaculture Sector, Via E. Fermi 2749, 21027, Ispra, Italy,2Hellenic Centre for Marine Research (HCMR), 46.7 Km Athens-Sounio avenue, P.O Box 712, 190 13 Anavissos, Attica, Greece,3Institut de Ciències del Mar (ICM-CSIC), Psg. Marítim de la Barceloneta 37–49, 08003, Barcelona, Spain,4Consorzio per il Centro Interuniversitario di Biologia Marina ed Ecologia Applicata“G. Bacci”(CIBM), V.le N. Sauro 4 57128, Livorno, Italy
*shark@hcmr.gr
Abstract
We investigate long-term changes in the Mediterranean marine resources driving the trawl fisheries by analysing fishers’perceptions (Traditional Ecological Knowledge, TEK) throughout the Mediterranean Sea during the last 80 years. To this end, we conducted an extended set of interviews with experienced fishers that enabled us to classify species (or taxa) as‘decreasing’or‘increasing’both in terms of abundance, as well as average size in the catch. The aspect that most clearly emerged in all the investigated areas over time was the notable increase of fishing capacity indicators, such as engine power and fishing depth range. Atlantic mackerel, poor cod, scorpionfishes, striped seabream, and John Dory dem-onstrated a decreasing trend in the fishers’perceived abundance, while Mediterranean par-rotfish, common pandora, cuttlefish, blue and red shrimp, and mullets gave indications of an increasing temporal trend. Although, as a rule, trawler captains did not report any cataclys-mic changes (e.g. extinctions), when they were invited to estimate total catches, a clear de-creasing pattern emerged; this being a notable finding taking into account the steep escalation of fishing efficiency during the past century. The overall deteriorating status of stocks in most Mediterranean regions calls for responsible management and design of re-building plans. This should include historical information accounting for past exploitation patterns that could help defining a baseline of fish abundance prior to heavy industrial fisheries exploitation.
a11111
OPEN ACCESS
Citation:Damalas D, Maravelias CD, Osio GC, Maynou F, Sbrana M, Sartor P (2015)“Once upon a Time in the Mediterranean”Long Term Trends of Mediterranean Fisheries Resources Based on Fishers’Traditional Ecological Knowledge. PLoS ONE 10(3): e0119330. doi:10.1371/journal. pone.0119330
Academic Editor:Moncho Gomez-Gesteira, University of Vigo, SPAIN
Received:August 1, 2014
Accepted:January 20, 2015
Published:March 17, 2015
Copyright:© 2015 Damalas et al. This is an open access article distributed under the terms of the Creative Commons Attribution License, which permits unrestricted use, distribution, and reproduction in any medium, provided the original author and source are credited.
Introduction
The Mediterranean Sea and its environment are of great economic importance to the sur-rounding countries. Around 150 million people live along the shores of the Mediterranean; many coastal cities have over a million inhabitants. More notable in terms of employment
(250,000 fishermen) than production (about 1.5 million tons declared in 2011 [1]), fishing is
mainly on a small scale [2]. Humans have exploited the Mediterranean Sea since the prehistoric
era [3]–[4]. This perennial utilization of resources has led, earlier than any other marine region
of the world, to the acknowledgement that fishing may have largely affected the marine envi-ronment; manifestations in the form of protests against bottom trawling as a detrimental fish-ing tactic date back to 1377 A.D. and such concerns have materialized into spatio-temporal
closures for fishing even since the 18th century [5], [6], [7], and prohibitions of certain fishing
gears (1825 A.D. [8]). During the past two centuries, the introduction of many technological
innovations has produced a progressive increase of fishing capacity, technology and catchabil-ity, a factor which further increased the pressure on the resources and the marine environment [7].
Although, there is a long history of biological research in the region [2], due to the poor
con-dition of local economies in many countries, marine research was not a top priority. It is only recently that research has been carried out specifically in support of managing fish populations, however the level of application of research recommendations in the management of marine fisheries is still generally low. Landing trends often provide the only indication of changes that have occurred in the past. Based on a review study, 85% of the assessed stocks are currently
overfished compared to a maximum sustainable yield reference point (MSY) [9]. In general,
ex-ploitation rate has been steadily increasing, selectivity (proportional exex-ploitation of juveniles)
has been deteriorating, and stocks have been shrinking [10]. However, in order to assess the
true current status of the stocks, a starting point, a baseline, has to be set, so far back in time so that to coincide with the period when the stocks were at a pristine, unexploited status. It has been argued that by choosing an unsuitable baseline one will fail to properly assess the true
ex-tent of change [11]. This phenomenon, described as the“shifting baseline syndrome,”is
partic-ularly occurring in all Mediterranean fisheries assessments, given that fishermen have been
trawling for at least 300 years and exploitation by other means dates back for millennia [7].
Several studies have aimed at recovering knowledge from past Mediterranean ecosystems to
reconstruct ecosystem baselines [12], [13], [14]. To overcome limitations in data availability
prior to the 1990’s and to recover historical information, fishers’perceptions can be used to
document changes in marine ecosystems (also called Local Ecological Knowledge, LEK, or
Tra-ditional Ecological Knowledge, TEK [15], [16], [17]). Historical memories of experienced
fish-ermen and skippers are still vivid and can provide valuable information on decades spent at sea fishing. This approach could substantially contribute to improve the historical picture and un-derstanding of the fisheries and associated fish communities, usually obtained from other sources. Useful information on description of fishing practices, reconstruction of the trends of exploited stocks and, changes in the species population structure can be obtained. Even though some discrepancies due to emotionality of the past memories can sometimes confine the infor-mation, its added value is indubitable to reconstruct a past picture of marine environment.
Dis-qualifying such information as“anecdotal”dismisses important first-hand information. In
addition, fishermen’s traditional ecological knowledge (TEK) could have an important role in the management process; this kind of information could constitute a complementary source to integrate new knowledge in fisheries biology and marine ecology.
In this study we explored fishers’perceptions throughout the northern Mediterranean Sea
in the most extensive study conducted to date (26 fishing ports, 91 old fishers interviewed). accepted by the European Commission (funding this
study). All interviews are available and stored both on hardcopy (original paper notes) and digital media (voice recordings); however our reservations to disclose the underlying data of this study stems from the ethical agreement with the interviewed fishers not to disclose personal information. Although individual interviews may be striped out of personal ID data, a combination of the remaining information for each interview, such as:‘Country’,‘Geographical subarea’, ‘Age’,‘Place of origin’,‘Port of activity’,‘Year of starting activity’,‘Education level’,‘Period of active fishing’,‘engine power’,‘gear specifications’,‘depth of fishing grounds’,‘targeting species’may easily lead to an indirect identification of the interviewed fisher. To deal with this issue we can provide the data tables used in the analyses with‘masked’/recoded info for the fields of‘Country’,‘Area’,‘Period’,‘Species’. Moreover field‘Fisherman’will be eliminated. All data may be acquired by contacting: Dr Paolo Sartor, Consorzio per il Centro Interuniversitario di Biologia Marina ed Ecologia Applicata“G. Bacci”(CIBM), V.le N. Sauro 4 57128 - Livorno (Italy) contact e-mail: psartor@cibm.it.
Funding:The data acquisition was supported by the European Commission through project EVOMED (“The 20th Century evolution of Mediterranean exploited demersal resources under increasing fishing disturbance and environmental change”(no MARE/2008/11: Lot 4). The funders had no role in study design, data collection and analysis, decision to publish, or preparation of the manuscript.
The same group of fishers has recently provided valuable information regarding the dramatic
historical decline of Mediterranean elasmobranchs and marine mammals [18]. This time our
focus was on the commercial species driving the bottom trawl fisheries from the past up till now, investigating how their relative abundance and average size has evolved through time. By
doing so we were able to classify species (or taxa) as‘decreasing’or‘increasing’both in terms of
abundance, as well as average size in the catch. The plausible drivers behind these trends were further considered.
Materials and Methods
Fishers
’
perception
Information was gathered by means of questionnaire-based interviews following a
standard-ized sampling protocol [15], [19]. No ethics statement was required by the funding agency
(Eu-ropean Commission, Directorate General for Maritime Affairs & Fisheries—EC, DG MARE).
All interviewed fishers (during the DG MARE Tender‘EVOMED’) collaborated on a voluntary
basis. An‘Oral Consent process’was followed: participants were provided all of the necessary
information on the nature of the study before obtaining their consent.‘Oral consent’is
suffi-cient for this type of studies since no personal sensitive data is planned to be disclosed. To this end the datasets made available to PLoSONE, use masked codes (for the fields: Country, Area, Period, Species) and lack actual names of persons, making it impossible to track the
individual fishers.
A total of 91 experienced fishermen in 26 fishing ports belonging to five FAO GFCM (Food and Agriculture Organization of the United Nations—General Fisheries Commission for the Mediterranean) Geographical Sub-Areas (GSAs) of the northern Mediterranean Sea were
in-terviewed (Fig. 1): Catalan Sea (GSA 6) in Spain; Ligurian, northern-central Tyrrhenian Sea
(GSA 9) and northern Adriatic Sea (GSA 17) in Italy; Ionian (GSA 20) and Aegean Sea (GSA 22) in Greece. Fishermen were between 45 and 88 years old (median 70). One of them has en-tered the fishery in the distant past (1932) with the median year of starting activity being 1955; no fisher in our sample had less than 27 years of experience in the field. Thus, as a result of the
interviewees’longtime experience, a coverage of almost 80 years of observations was obtained.
The questionnaire was designed to study the perception of the oldest active and retired fish-ers on the evolution of bottom trawling, principally targeting demfish-ersal fish and occasionally small pelagics. Interviews were carried out during 2009 and 2010 in selected ports of Spain, Italy and Greece. The main contents of the questionnaire concerned information about vessels, fishing gears, fishing practices and fishing grounds (location of main fishing grounds, duration of fishing trips, on board activity, etc.), the main target species, estimation of catches (the usual catch, memories of exceptional captures, sizes of specimen caught, etc) and discard composi-tions. The choice of sites/areas where the interviews were collected was based on: (a) the impor-tance of the local fisheries, at a national level, in terms of total production, employment and number of fishermen; (b) the historical aspect: existence of experienced skippers; (c) an already existing mutual confidentiality and respectful relationship between the fishing associations/in-dividual fishermen and the researchers; (d) constraints such as time and distance. In order to facilitate the estimation of eventual changes over time, questionnaires were designed to collect information during three main time periods: 1940 to 1959, 1960 to 1979, and from 1980 to present. Upon recording fisherman’s age, vessel characteristics and fishing tactics, the local fish names mentioned were linked to taxonomic ones. Only species brought up during the inter-view by the fisherman were noted down. Respondents were asked to qualitatively rank
chrono-logical abundance of these taxa, by assigning one of the following scores:‘Much more
size of valuable commercial species was assessed by classifying average size by time period into
one of the following:‘Larger’,‘More or less the same’,‘Smaller’, and‘Not able to evaluate’. By
combining responses of each respondent over all time periods, the recorded taxa were assigned to a trend factor: species showing a decreasing trend (“D”), species showing an increasing
trend (“I”) and species not showing any noticeable trend (classified as stable or“S”).
Addition-ally to the aforementioned qualitative information, quantitative estimates of total catch rates were recorded, expressed in kg (or boxes) landed per fishing day. All information gathered con-cerned species caught in the bottom trawl fisheries. Details on the protocol followed and the
structure of the questionnaires are available in [20] and as supplementary material (S1 File).
Statistical analyses
All taxa mentioned in each interview were structured in a presence/absence matrix, interviews being the samples (rows) and taxa the variables (columns). Interview data was accompanied by the corresponding information: identified Trend, Country, Geographical Area, Time Period,
Fishing Depth and, Vessel characteristics. Each‘interview x time period’was considered as an
independent replicate sample. To investigate differences in the temporal trends of each taxon among regions, the non-parametric multivariate permutational analysis of variance
(Perma-nova) was employed [21]. Whereas ordinary ANOVA/MANOVA assumes normal
distribu-tions and implicitly Euclidean distance, Permanova can work with any distance measure that is Fig 1. Map showing the ports where the interviews with the fishermen were carried out.SPAIN (GSA 6): 1: Port de la Selva; 2: Roses; 3: Palamos; 4: Blanes; 5: Arenys de Mar; 6: Mataro; 7: Barcelona; 8: Vilanova i la Geltrù; 9: Tarragona; 10: Cambrils; 11: L’Ametlla de Mar; 12: San Carles de la Rapita; ITALY (GSA 9 & 17): 13: Viareggio; 14: Livorno; 15: Elba Island; 16: Castiglione della Pescaia; 17: Porto Santo Stefano; 18: Porto Ercole; 19: Civitavecchia; 20: Fiumicino; 21: Ponza Island; 22: Civitanova Marche; GREECE (GSA 20 & 22) 23: Nea Michaniona; 24: Chalkis; 25: Peireas; 26: Patra. Country maps source: ©OpenStreetMap contributors.http://www.openstreetmap.org/copyright
appropriate to the data using permutations to make it distribution-assumption free. A two way
Permanova based on Bray-Curtis resemblance matrix was used to test for the terms“Country”
(with 3 levels: Spain, Italy, Greece) and“Trend”(with 3 levels:‘“D-Decrease”,“I-Increase”,
“S-Stable”’), both considered as fixed crossed factors. Whenever Permanova results were
signifi-cant, the Similarity Percentages Procedure (SIMPER) was employed [22] to identify taxa that
were most important in each region regarding abundance/size trends. A Non-metric Multi Di-mensional Scaling (nMDS) ordination was performed to visualize geographical patterns in abundance/size trends. Only taxa observed three or more times, in the whole series of
inter-views, were considered. All the multivariate analyses were performed in R libraryvegan
(Com-munity Ecology Package ver. 2.0–10).
Assuming that non-linearities are most likely to occur in the functional relationships be-tween catch estimates and explanatory variables, catch rates were modelled as a function of six
factors (Period,Country,GSA,Depth, engine power-kWandFisherman) by applying
General-ized Additive Mixed Models (GAMM) techniques. GAMMs are extensions of GeneralGeneral-ized
Ad-ditive Models (GAMs [23]) with some of the predictors being treated as random variables. The
fact that the same fishers’responses are used induces correlations among the observations,
which are important for the model to capture. One very effective way of achieving this is to
at-tribute a random effect to each response, treatingFishermanas a random effect, by implying a
GAMM. The use of GAMMs in fisheries science, although not widely used, is gaining
recogni-tion [24]. To model catch rates (total catch/fishing day), we used the functionbam(mgcv
pack-age in R [25]) as it allows specification of random term smoothers, specification of weights,
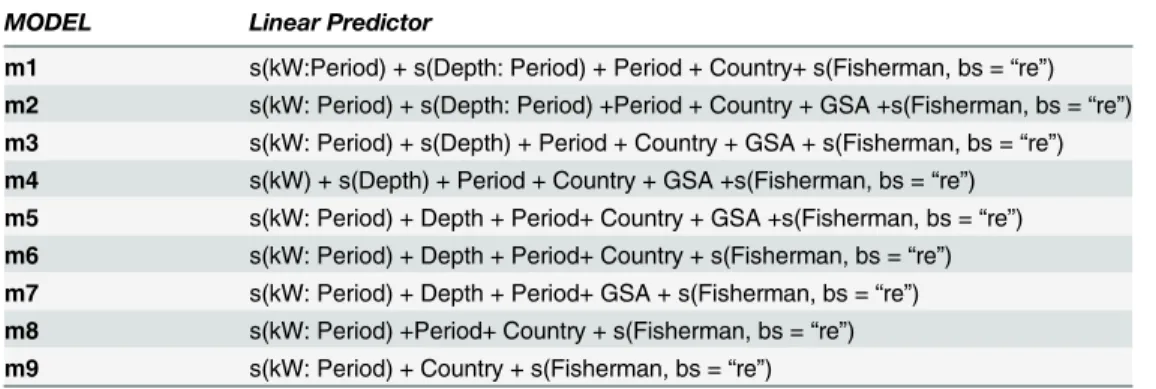
offset and it can handle large datasets while still providing good estimates when there are few random effects levels. Plausible combinations among predictor variables, plus interactions among them, would have generated a sizeable number of candidate models. To avoid investiga-tion of numerous irrelevant models, we focused on those combinainvestiga-tions linked to the problem
under study [26]. As a result a series of empirical candidate models were constructed including
meaningful combinations of the six parameters under investigation that plausibly influenced
catch rates (Table 1).‘Best’model selection was based on a comparison of the AIC-GCV
(Akaike Information Criterion—Generalized Cross Validation) statistical scores [25].
Compar-isons via GCV score and via AIC normally yield similar answers [27], and AIC was used. Once
the‘best’model was identified, parameters were estimated using REML (REsidual Maximum
Likelihood) statistical score since it gives better parameter estimates [28]. All the analyses were
Table 1. The set of candidate models.
MODEL Linear Predictor
m1 s(kW:Period) + s(Depth: Period) + Period + Country+ s(Fisherman, bs =“re”)
m2 s(kW: Period) + s(Depth: Period) +Period + Country + GSA +s(Fisherman, bs =“re”)
m3 s(kW: Period) + s(Depth) + Period + Country + GSA + s(Fisherman, bs =“re”)
m4 s(kW) + s(Depth) + Period + Country + GSA +s(Fisherman, bs =“re”)
m5 s(kW: Period) + Depth + Period+ Country + GSA +s(Fisherman, bs =“re”)
m6 s(kW: Period) + Depth + Period+ Country + s(Fisherman, bs =“re”)
m7 s(kW: Period) + Depth + Period+ GSA + s(Fisherman, bs =“re”)
m8 s(kW: Period) +Period+ Country + s(Fisherman, bs =“re”)
m9 s(kW: Period) + Country + s(Fisherman, bs =“re”)
GSA = Geographical Sub-Areas
s() is a smooth function represented using penalized regression splines [25]. Covariate“Fisherman”was estimated through penalized random effects (bs =“re”).
performed in R v.3.0.3 [29]. Additionally to the standard approach which standardizes the
trends but does not account for technological improvement (also known as‘technological
creeping’), we reconstructed technological improvement on Mediterranean trawl vessels based
on a recently applied methodology [7]. Time scaled correction coefficients were used as an
off-set parameter, representing the increase in trawl efficiency. 1.00 was selected over the period 1940–1959 (considering catching power constant), 1.72 from 1960 to 1979 and 2.24 from 1980 to 2008.
Results
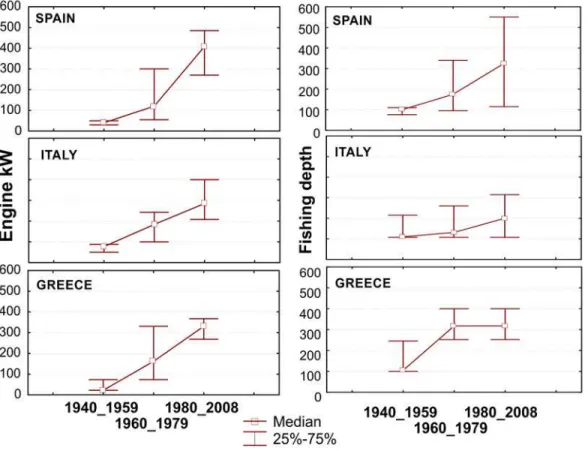
Temporal representation of the fleet operational characteristics illustrates how fishing capacity amplified at a fast pace; fishing activities expanded from coastal/shelf areas to distant deeper waters. While in the past the median fishing depth was shallower than 100 m, in the recent years working depths have exceeded 300 m; obviously promoted by the immense escalation of
engine power (Fig. 2), allowing skippers to explore new unexploited fishing grounds.
The assemblage of responses included a total of 42 species (or taxa) (Table 2). 14 species/
taxa were mentioned more than 10 times; the three dominating species being: European hake
(M.merluccius), red mullet (M.barbatus) and deep-water rose shrimp (P.longirostris). These
species were brought up by fishers in more than 1/3 of the interviews.
Fig 2. Median overall engine power (in kW) and fishing depth (in meters) of the vessels used by the fishermen interviewed over time.Upper and lower whiskers indicate 25–75% percentiles around the median.
Table 2. List of taxa reported by thefishers.
Taxon English name Abundance Size trend
D S I D S I
Aristeus antennatus Blue and red shrimp 4 0 2 1 4 1
Aristaeomorpha foliacea Giant rd shrimp 0 0 1 0 2 0
Boops boops Bogue 6 4 1 2 10 0
Citharus linguatula Spottedflounder 1 0 1 1 1 0
Dicentrarchus labrax Sea bass 0 1 1 0 2 0
Engraulis encrasicolus Anchovy 6 2 1 1 7 1
Eledone spp. Horned/musky octopus 8 6 4 3 12 2
Illex coindetii Broadtail shortfin squid 1 1 0 1 1 0
Lithognathus mormyrus Striped seabream 3 1 0 0 3 0
Loligo spp. Squids 3 5 1 0 7 1
Lophius spp. Anglerfishes 2 3 1 1 5 0
Mullus barbatus Red mullet 15 21 5 9 32 1
Merluccius merluccius European hake 38 27 11 17 56 6
Micromesistius poutassou Blue whiting 10 5 3 5 12 2
Mullus surmuletus Striped red mullet 3 8 1 0 11 0
Mullus spp Red mullets 8 3 7 5 10 4
Nephrops norvegicus Norway lobster 11 9 4 2 21 2
Octopus vulgaris Common octopus 5 3 2 2 6 1
Pagellus bogaraveo Blackspot seabream 0 0 1 1 0 0
Pagellus erythrinus Common Pandora 1 1 1 1 1 1
Penaeus kerathurus Caramote prawn 2 2 1 1 3 1
Parapenaeus longirostris Deep sea pink shrimp 10 21 5 4 28 1
Pomatomus saltator Bluefish 0 1 0 0 1 0
Raja spp. Rays 2 0 0 0 2 0
Sparus aurata Gilthead seabream 1 1 0 1 1 0
Scyliorhinus canicula Small spotted catshark 0 0 1 0 1 0 Sparisoma cretense Mediterranean parrotfish 1 2 4 0 7 0
Spicaraflexuosa Picarel 0 2 0 0 2 0
Squilla mantis Mantis shrimp 6 6 3 1 12 1
Sepia officinalis Cuttlefish 4 0 2 1 6 0
Sardina pilchardus Sardine 1 2 1 0 2 2
Scomber scomber European mackerel 10 1 1 2 10 0
Spicara smaris Picarel 5 5 1 2 10 0
Solea vulgaris Common sole 3 0 0 1 2 0
Scophthalmidae Flatfishes 0 1 0 0 1 0
Scorpaena spp. Scorpionfishes 5 2 0 2 3 0
Squalus spp. Squalid sharks 0 1 0 1 0 0
Trisopterus minutus capelanus Poor cod 5 0 1 3 3 0
Trachurus trachurus Horse mackerel 0 2 0 0 1 0
Trachurus spp. Horse Mackerels 4 6 2 1 11 1
Triglidae Gurnards 1 2 0 0 1 0
Zeus faber John Dory 2 1 0 0 3 0
The number of times in which they were assigned to the groups‘INCREASE’(‘I’),‘DECREASE’(‘D’) and ‘STABLE’(‘S’) is reported.
Abundance trends
Most species/taxa were classified under all three trend categories, by the different fishers,
mak-ing it difficult to infer a straightforward conclusion on their status (Table 2). However,
Perma-nova analysis highlighted significant differences by geographical criteria (Country) and time
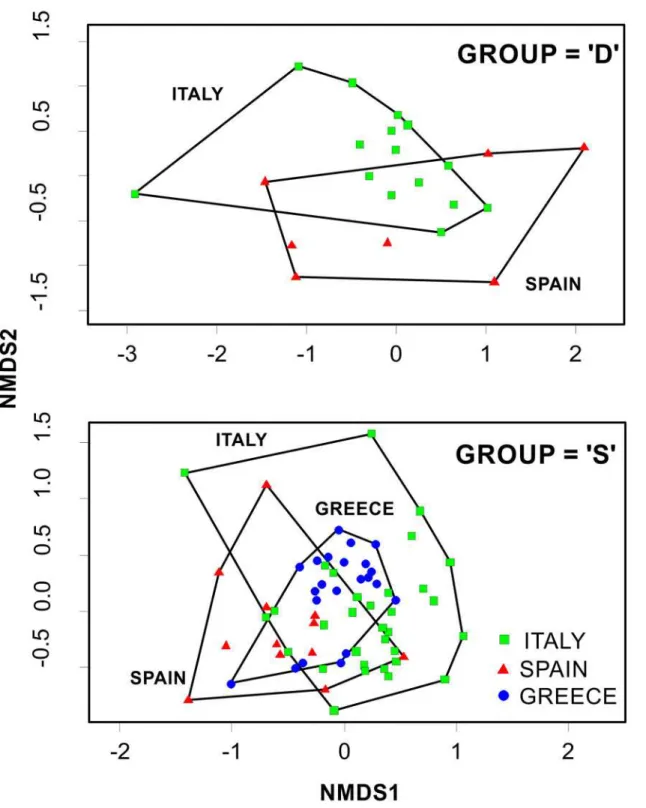
period (Trend) (Table 3top). The Non-metric Multi Dimensional Scaling (nMDS) ordinations
demonstrated the geographical structure of the observed trends in the datasets (“D”,“I”,“S”)
(Fig. 3). SIMPER analyses (Table 4) identified the species/taxa contributing mostly into each group and indicated a quite high separation among groups (overall between groups
dissimilari-ties:‘I’vs‘D’81.34%;‘D’vs‘S’79.07%;‘S’vs‘I’82.66%).
Decreasing (
“
D
”
)
Fifty-eight percent of the fishers listed one or more species/taxon as decreasing (Table 2). In
total, 33 species/taxa were listed. Of those most frequently listed the most common were valu-able commercial species such as European hake, red mullet, deep-water rose shrimp, and Nor-way lobster. Other commercial species followed, such as horned and musky octopuses, blue whiting, mantis shrimp, striped red mullets and various species of mackerels. It must be noted here, that these absolute numbers of species occurrence cannot directly typify the abundance
trend group; this is realized through SIMPER analyses. Looking at the“D”nMDS ordination
plot (Fig. 3top), there is a partial overlap among all regions (Spanish, Italian, Greek).
Accord-ing to SIMPER analysis (Table 4), the first 5 species contributing mostly in characterizing
group“D”were: poor cod, Atlantic mackerel, striped seabream, scorpionfishes, and John Dory.
Stable (
“
S
”
)
Fifty-three percent of the fishers considered, listed one or more species/taxon as not being
af-fected in terms of abundance throughout the years (Table 2); 33 species/taxa in total were
listed. European hake, red mullet, and deep-water rose shrimp were the most common ones.
The“S”nMDS ordination plot (Fig. 3mid), demonstrated an almost complete overlap between
Greek and Italian fishers responses and a reasonable separation between Italian and Spanish
fishermen perceptions. According to SIMPER analysis (Table 4), the species contributing
Table 3. Results of the PERMANOVA Analyses.
ABUNDANCE Df SumsOfSqs MeanSqs F.Model R2 Pr(>F)
Trend 2 1.574 0.78694 2.6392 0.03727 0.01
Country 2 4.290 2.14509 7.1940 0.10160 0.01
Trend:Country 4 1.772 0.44307 1.4859 0.04197 0.04
Residuals 116 34.588 0.29818 0.8191
Total 124 42.225 1
SIZE Df SumsOfSqs MeanSqs F.Model R2 Pr(>F)
Trend 2 0.8962 0.44808 1.7804 0.02934 0.05
Country 2 4.1434 2.07172 8.2319 0.13564 0.01
Trend:Country 3 0.8445 0.28151 1.1186 0.02765 0.37
Residuals 98 24.6636 0.25167 0.8073
Total 105 30.5478 1
Permutational multivariate analyses of variance based on the Euclidean dissimilarity measure for presence-absence data. The tests were done using 9999 permutations under the reduced model.
Fig 3. Non-metric Multi Dimensional Scaling (nMDS) ordination comparing species abundance trends responses outputs across the different locations (Country).The position of each dot is defined by the assemblage of species recorded in each interview.
mostly in characterizing group“S”were: striped red mullet, Loligo squids, sardine, anglerfish, and horse mackerels.
Increasing (
“
I
”
)
A minor fraction of fishers, twenty-three percent, listed one or more species/taxon as
increas-ing (Table 2). In total, 29 species/taxa were listed. From the“I”nMDS ordination plot (Fig. 3
bottom), there was a complete separation between the eastern region (Greece) and the central-west Mediterranean (Italy, Spain) as well as a significant overlap between Spain and Italy.
Ac-cording to SIMPER analysis (Table 4), the first 5 species contributing in characterizing group
“I”, were: Mediterranean parrotfish, common pandora, cuttlefish, blue and red shrimp, and mullets.
Size trends
Several species/taxa were classified among all three trend categories (Table 2). Permanova
analy-sis highlighted significant differences by Country and time Period (Table 3bottom). The
Non-metric Multi Dimensional Scaling (nMDS) ordinations demonstrated the geographical structure
of the observed trends in the datasets (“D”and“S”) (Fig. 4). Group“D”did not account for
Greece, since only one Greek fisher suggested a decrease in average size; group“I”was not
plot-ted, since only few Spanish fishermen (and one Italian) observed an increasing size trend. In comparison to abundance trends, SIMPER analyses indicated a lower level of separation among
groups (overall between group dissimilarities:‘D’vs‘S’73.81%;‘I’vs‘D’76.85%;‘S’vs‘I’76.96%).
Decreasing (
“
D
”
)
Only twenty-seven percent of interviewed fishers mentioned one or more species/taxon as
de-creasing in size (Table 2). In total, 27 species/taxa were listed. Looking at the“D”nMDS
Table 4. Abundance trends: most important taxa characterizing groups‘I’,‘D’and‘S’by SIMPER analysis.
GROUP Taxon Average frequency of occurrence Contribution (%) Cumulative Sum (%)
D T.min.capelanus 0.200 5.62 5.62
S.scomber 0.290 5.33 10.95
L.mormyrus 0.128 5.17 16.12
Scorpaena spp. 0.151 4.86 20.98
Z.faber 0.081 4.65 25.63
S M.surmuletus 0.227 6.47 6.47
Loligo spp. 0.116 5.64 12.11
S.pilchardus 0.050 5.2 17.31
Lophius spp. 0.062 5.17 22.48
Trachurus spp. 0.089 5.09 27.57
I S.cretense 0.583 10.45 10.45
P.erythrinus 0.154 6.94 17.39
S.officinalis 0.220 6.76 24.15
A.antennatus 0.220 6.76 30.91
Mullus spp. 0.537 6.46 37.37
Thefish taxa are listed in decreasing order of their importance in typifying the groups‘INCREASE’(‘I’),‘DECREASE’(‘D’) and‘STABLE’(‘S’) by SIMPER analysis performed on presence/absence data. Cut off for low contributions: 90.00%.‘I’vs‘D’overall between group dissimilarity 81.34;‘D’vs‘S’overall between group dissimilarity 79.07;‘S’vs‘I’overall between group dissimilarity 82.66
Fig 4. Non-metric Multi Dimensional Scaling (nMDS) ordination comparing species size trends responses outputs across the different locations (Country).The position of each dot is defined by the assemblage of species recorded in each interview.
ordination plot (Fig. 4top), there is a separation between the Spanish and Italian region (with a
partial overlap). SIMPER analysis (Table 5) revealed the species contributing mostly in
charac-terizing group“D”, and having undergone a significant decrease in their average size: poor cod,
various scorpionfishes, common sole, common pandora and European hake.
Stable (
“
S
”
)
A large part of the interviewees (78%) listed one or more species/taxon as not having
experi-enced any change in body size; almost all species/taxa were listed (40) (Table 2). The“S”nMDS
ordination plot (Fig. 4bottom), demonstrated an almost complete overlap between Greek and
Italian fishers responses and a moderate separation between Italian and Spanish fishermen
per-ceptions. According to SIMPER analysis (Table 5), the species contributing mostly in
charac-terizing group“S”were: Mediterranean parrotfish, striped red mullet, Loligo squids, cuttlefish
and mantis shrimp.
Increasing (
“
I
”
)
Only one out of ten fishers, listed one or more species/taxon as increasing in body size. In total,
16 species/taxa were listed (Table 2). According to SIMPER analysis (Table 5), the species
con-tributing more than 55% in characterizing group“I”, were:sardine, common pandora,
cara-mote prawn, blue and red shrimp, and red mullets. Table 5. Size trends: most important taxa characterizing groups‘I’,‘D’and‘S’by SIMPER analysis.
GROUP Taxon Average frequency of occurrence Contribution (%) Cumulative Sum (%)
D T.min.capelanus 0.273 10.01 10.01
Scorpaena spp. 0.154 8.29 18.30
S.vulgaris 0.070 7.07 25.37
P.erythrinus 0.070 7.07 32.44
M.merluccius 0.149 5.80 38.24
S S.cretense 0.125 4.71 4.71
M.surmuletus 0.160 4.60 9.31
Loligo spp. 0.082 4.16 13.47
S.officinalis 0.069 4.10 17.57
S.mantis 0.102 4.01 21.58
I S.pilchardus 0.964 18.83 18.83
P.erythrinus 0.497 14.21 33.04
P.kerathurus 0.300 8.69 41.73
A.antennatus 0.235 7.32 49.05
Mullus spp. 0.688 6.64 55.69
Thefish taxa are listed in decreasing order of their importance in typifying the groups‘INCREASE’(‘I’),‘DECREASE’(‘D’) and‘STABLE’(‘S’) by SIMPER analysis performed on presence/absence data. Cut off for low contributions: 90.00%.‘I’vs‘D’overall between group dissimilarity 76.85;‘D’vs‘S’overall between group dissimilarity 73.81;‘S’vs‘I’overall between group dissimilarity 76.96
Total catch rates trends
Assuming a normal distribution for the underlying dataset, we examined a series of candidate
models based on their AIC scores. Modelm1was selected as the most suitable (Table 6):
fðE½CatchÞ ¼cþa1Countryþa2Periodþs1ðkW:PeriodÞ þs2ðDepth
:PeriodÞ þs3ðFishermanÞ
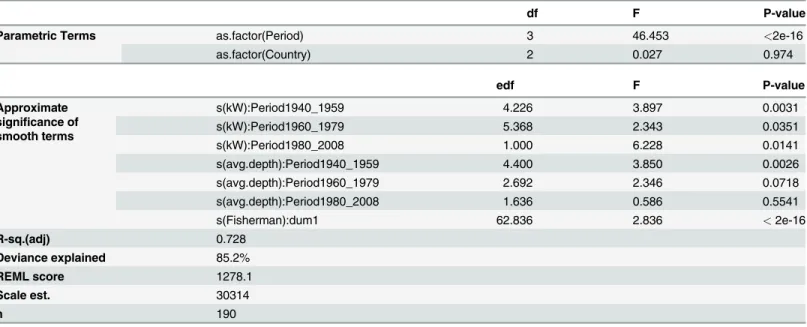
The model explained a considerable percentage (85.2) of the variance in the perceived catch
rates, the main explanatory variables being: interactions ofPeriodwithkWandDepth, and
Fisherman(which was treated as a random effect). The likelihood of a larger catch was higher
during the early years; in the most recent period catch estimates were significantly lower than
those before the 1980’s (Fig. 5). Fishing depth and engine power (kW) effects were weak during
the two early periods, however during the last period (post 1980) it seems that increased horse power and deep water fishing became significant drivers of elevated catch rates. Furthermore, when taking into account the correction factor for technological creeping throughout the years,
this decreasing temporal catch trend was once more confirmed (Table 7andFig. 6).
Table 6. Generalized Additive Mixed Model results for factors affecting total catches.
df F P-value
Parametric Terms as.factor(Period) 3 46.453 <2e-16
as.factor(Country) 2 0.027 0.974
edf F P-value
Approximate significance of smooth terms
s(kW):Period1940_1959 4.226 3.897 0.0031
s(kW):Period1960_1979 5.368 2.343 0.0351
s(kW):Period1980_2008 1.000 6.228 0.0141
s(avg.depth):Period1940_1959 4.400 3.850 0.0026
s(avg.depth):Period1960_1979 2.692 2.346 0.0718
s(avg.depth):Period1980_2008 1.636 0.586 0.5541
s(Fisherman):dum1 62.836 2.836 <2e-16
R-sq.(adj) 0.728
Deviance explained 85.2%
REML score 1278.1
Scale est. 30314
n 190
s: smooth function represented using penalized regression splines df: degrees of freedom
edf: estimated degrees of freedom F: F-ratio test score
P-value: refers to the p-values from an ANOVA F-ratio test “:”: interaction among terms
R-sq: The adjusted r-squared for the model. Defined as the proportion of variance explained REML: Random efects maximum likelihood score
Family: gaussian; Link function: identity; Formula (Response variable as a function of predictor variables): catch_kg ~as.factor(Period) + s(kW, by = Period) + s(avg.depth, by = Period) + as.factor(Country) + s(Fisherman, bs =“re”, by = dummy var).
Fig 5. Generalized additive mixed model (GAMM) derived effects of engine power (kW), fishing depth, Period, and Country on the catch rates reported by fishers.Gray shaded area and dashed lines of upper and lower brackets indicate 2 standard errors above and below the estimates shown in solid lines. The relative density of data points is shown by the‘rug’on the x-axis.
Discussion
The interviews performed during this study constituted the first attempt to collect information in such a way on a wide geographical scale in the Mediterranean. In general, the fishermen demonstrated interest and wide availability to provide information on their past activities. As a rule, fishermen were pleased to see scientists looking over their past experiences and actually wondered why the decision-making centres such as ministries, government and the European Commission have never seriously considered their views.
Many fisheries scientists are still rather sceptical against fishers’historical information and
tend to disqualify it as‘anecdotal’, seeing history as‘unscientific’. Traditional ecological
knowl-edge (TEK) or‘anecdotes’(as fisheries scientists call it), represents a very important source of
knowledge falling under an entire specialty in history known as oral history [30]–[31]. Sáenz—
Arroyo et al. [15] elegantly argue how (and why) fisheries science and marine conservation
bi-ology can be perceived as an historical science, in a similar way as evolutionary bibi-ology is. They stress that, in order to correctly explain the patterns and processes prevailing today, we need to consider how human impacts have affected wild population in the past applying not only methods traditionally used by fisheries scientists, but also employing methods used by historians.
During this study, the aspect that most clearly emerged in all the investigated areas was the notable increase of fishing capacity indicators over time, such as engine power and fishing depth range. Horse power was undoubtedly the parameter showing the highest temporal in-crease: the present values are, on average, five-to-eight times higher, than those of the earlier Table 7. Generalized Additive Mixed Model results for factors affecting total catches, taking into account correction for technological creeping.
df F P-value
Parametric Terms as.factor(Period) 2 34.29 1.87e-12
edf F P-value
Approximate significance of smooth terms
s(kW):Period1940_1959 1.002 4.162 0.0434
s(kW):Period1960_1979 1.294 0.830 0.3877
s(kW):Period1980_2008 1.000 3.915 0.0501
s(avg.depth) 2.217 2.357 0.0830
s(Fisherman):dum1 64.127 2.974 <2e-16
R-sq.(adj) 0.659
Deviance explained 78.8%
REML score 1299.9
Scale est. 37912
n 190
s: smooth function represented using penalized regression splines df: degrees of freedom
edf: estimated degrees of freedom F: F-ratio test score
P-value: refers to the p-values from an ANOVA F-ratio test “:”: interaction among terms
R-sq: The adjusted r-squared for the model. Defined as the proportion of variance explained REML: Random efects maximum likelihood score
Family: gaussian; Link function: identity; Formula (Response variable as a function of predictor variables): catch_kg ~ s(kW, by = Period) + s(avg.depth) + Period + offset(Q) + s(Fisherman, bs =“re”, by = dummy var).
Fig 6. Generalized additive mixed model (GAMM) derived effects of engine power (kW), fishing depth, and Period on the catch rates reported by fishers, after correcting for technological creeping.Gray shaded area and dashed lines of upper and lower brackets indicate 2 standard errors above and below the estimates shown in solid lines. The relative density of data points is shown by the‘rug’on the x-axis.
periods. The vessels used at present are notably different in terms of size and technological equipment compared to those employed in the past, providing also higher working standards. Technological innovations have improved the operational capacity of the fleets allowing them to abandon their traditional shallow coastal fishing grounds and start visiting distant deeper waters, fully exploiting the water column, a pattern in accordance with a general expansion of
fishing activities documented worldwide [32], [33], [34].
Abundance trends
In spite of many Mediterranean Institutions being involved since the late 19th century in the field of fishery science, knowledge on the historical evolution of the exploited populations is still rather scarce and limited to restricted areas and time periods. This aspect hampered, for most of the commercial species, the investigation of the temporal evolution of abundance. Only after the early 1990’s, through the introduction of the MEDITS international trawl survey
[35] and since 2002, with the implementation of a regular data collection for all EU
Mediterra-nean waters [36]–[37], the EU Mediterranean fisheries are regularly monitored. As a result,
knowledge on the status of the resources is largely based on the relatively good quantitative
in-formation of the past twenty years [9]–[38], however most stock assessments rely on data from
the past 10 years.
Based on the same set of interviews, fishermen reported a striking decline for elasmobranch
species and marine mammals throughout the Mediterranean [18]; a pattern largely supported
by recent studies [39], [40], [41]. Atlantic mackerel (Scomber scomber), poor cod (Trisopterus
minutus capelanus) and John Dory (Zeus faber) were identified as species showing a significant decline in abundance. In general, fish of the Scombridae family, are considered a heavily fished group all over the world and the Atlantic populations are considered to be in a decreasing
trend over the past 20 years [42]. Coinciding with this time frame, in the Mediterranean, It has
been suggested [13] that late 1990’s were the point in time at whichScomber scomberstatus
downturned from‘abundant’to‘occasional’in catches. This was attributed to the negative
im-pacts of confounding effects such as: expanding fisheries, habitat degradation and pollution.
Poor cod has been classified as‘overexploited’in the most recent assessment of Mediterranean
stocks [43]. It is recommended that current poor cod fishing mortality rates should be reduced
by 18% if exploitation has to be in line with sustainable levels of fishing. An evident decline in abundance of John Dory has been reported in the Adriatic Sea, based on comparisons of
histor-ical bottom trawl surveys (‘Hvar’1948–1949) with concurrent ones (MEDITS) [44]–[45]. The
biological characteristics of this species, mainly the late age and size at maturity [46] make it
one of the most sensitive species to fishing pressure.
On the other hand, a limited number of species were perceived as demonstrating an increas-ing abundance trend. Among them, the Mediterranean parrotfish (Sparisoma cretense), a
spe-cies of thermophilic nature of the southern Mediterranean. It has been argued [13] that it
belongs to the list of organisms considered to be good indicators of changes associated with warming in the marine environment. Mediterranean fisheries are threatened by a shift in the climate regime, the main feature of the current period being the increased variability in the ob-served phenomena. These changes have a faster effect on the comparatively small and
semi-en-closed Mediterranean Sea than on the world ocean [47]. The recorded changes in temperature
and rainfalls, among others, are associated to dramatic changes in Mediterranean biota. In the last 50 years, enhanced by both the opening of the Suez Canal, aquaculture and ship transport, hundreds of non indigenous species reached and established themselves in the Mediterranean Sea basin. The majority of them are of warm-water affinity. In parallel, it might be expected
coldwater affinity. Poor cod‘s decreasing trend may also be related to the warming tendency of Mediterranean waters. Poor cod’s preference for cooler water masses within the continental
shelf of the eastern Mediterranean has been documented [48]. In contrast, blue and red shrimp
(Aristeus antennatus) observed increase was most likely a masked effect of the gradual
expan-sion of the fleets’fishing depth range, targeting unexploited virgin populations residing in the
deep. This species, also known as the deep-sea shrimp, has a eurybathic distribution in the Mediterranean, and although it colonizes several habitats between 100 and 3000m of depth, an
increased abundance at the deeper layers (1400–1500m) has been identified [49].
Size trends
Temporal changes in the size of the specimen caught were less noticeable than changes in abundance. The cases of poor cod (Trisopterus minutus capelanus) and scorpionfishes (Scor-paena spp.) need to be highlighted, since both of them exhibited a simultaneous decrease in abundance and size. Taking into account that average mesh size of trawl net has increased
from less than 20 mm in the 1940s up to more than 40 mm currently [20], it is alarming that
average body size of captured fish kept decreasing. It is documented that substantial improve-ments in size selectivity of commercially important species should be achieved by switching
from smaller to larger mesh cod-ends [50]–[51]. Moreover, one of the most common
commer-cial species driving Mediterranean demersal fisheries, the European hake (Merluccius
merluc-cius), was among the list of‘shrinking’fish. These findings were also corroborated by the
results of the MEDITS survey running since 1994. Annual trends in the lengths of the large fish
and specifically the average 95thpercentile of total length distribution (average total length of
the large fish making up less than 5% of the sample), give clear signs of populations lacking large individuals, both for European hake and poor cod, since the late 1990’s. In addition,
dur-ing the 50’s in the North Tyrrhenian Sea [52]–[53], a much larger average size for hake has
been reported, compared to the one observed in the current trawl surveys.‘Shrinking’of fishes
has been contended for a long time, not denying it is an observable fact, but mostly debating on
who/what is to hold responsible for. In a most recent review [54] plausible causes are
summa-rized to: (i) direct removals of oldest and largest individuals through size-selective harvesting, (ii) contemporary evolution towards smaller size-at-age owing to selective harvesting of fast growing individuals or climate change, (iii) contemporary evolution towards increased/earlier energy allocation to reproduction, and consequently smaller realized size-at-age owing to high fishing mortality, and (iv) physiological declines in growth rates owing to increasing tempera-tures and decreasing oxygen concentration in warmer oceans. Some seem to be convinced that climate change is the main driver behind changes in fish size structure. It has been suggested
[55] that averaged maximum body weight is expected to shrink by 14–24% globally from 2000
to 2050 under a high-emission scenario; tropical and intermediate latitudinal areas being the most heavily impacted. In few cases, results were so compelling to exclude environmental fac-tors as the underlying cause of the observed declines, and clearly identify overfishing as the
prime agent (NW Atlantic shelf fish communities [56]).
Total catch rates
When trawler captains were invited to estimate total overall catches, a clear decreasing pattern
emerged. In almost all areas, production during the040-060 period was significantly higher
than the one observed recently. This is quite a remarkable finding taking into account how cient have the modern fishing fleets become, compared to the ones in the past. Elevated effi-ciency can be straightforwardly interpreted as an increase in catchability. The recent project
improvements occurred over time in the Mediterranean fisheries, notably affecting fishing power and catch efficiency (estimated to increase by 1–2% annually).
It is likely that the perception on the amount of catch over time, may have been biased by several factors, such as the different discard rate throughout the years (in the past discards were significantly less) and the different gear selectivity. In a broad sense, fishermen observe a non-standardized catch rate that is largely shaped by unnoticed changes over time: new fishing grounds, alterations in gear, innovative fishing tactics, altered target species and markets. The result may be a misleading perception in the change in abundance. However, by taking into ac-count the increasing fishing efficiency we aimed to correct for any misconceptions and hope-fully grasped a valid change in resource relative abundance, which was conclusively decreasing. Concurring with these findings, a recent study on historical catches from the Hellenic Seas stressed that recent levels of relative abundance for certain demersal species, were estimated as
low as just 20% of the initial ones back in the 60s [57]. The most extensive search of historical
data sources and publications carried out in the Mediterranean [7], concludes that the drop in
biomass in most regions was extremely large; highest relative biomass identified back in the 1920s with a second lower peak in the 1960s and contemporary biomass even lower. The fur-ther back the series was reconstructed, the larger the decline in demersal biomass. These find-ings were realized as a quantification of the shifting baseline syndrome: today we are assessing stocks solely based on data from the past 20 years, which correspond to the recent part of the historical trends, having no knowledge of the decline’s extent. The overall deteriorating status
of demersal stocks in most Mediterranean regions [9]–[10] should trigger multidisciplinary
and multilateral collaborations to design a feasible management scheme. Ecosystem based and regionalized management by means of multiannual plans are among the most important
inno-vative aspects of the reform of the European Common Fishery Policy [58]. Incorporation of
historical information could assist proper assessment by accounting for exploitation history as well as for constructing rebuilding plans.
Supporting Information
S1 File. EVOMED protocols. (PDF)
Acknowledgments
We warmly thank all fishers who dedicated their precious time to help us realize the evolution
of Mediterranean fisheries in the 20thcentury.
Author Contributions
Conceived and designed the experiments: MS PS FM CM. Performed the experiments: MS PS FM CM DD GO. Analyzed the data: DD MS FM GO CM PS. Contributed reagents/materials/ analysis tools: DD CM FM PS MS GO. Wrote the paper: DD CM FM PS MS GO.
References
1. FAO. Global Production Statistics 1950–2012. FAO-Fisheries and Aquaculture Information and Statis-tics Service; 2014. Available:http://www.fao.org/fishery/statistics/global-production/query/en
2. Farrugio H, Oliver P, Biagi F. An overview of the history, knowledge, recent and future research trends in Mediterranean fisheries. Sci Mar. 1993, 57(2–3): 105–119.
4. Cortes-Sanchez M, Morales-Muniz A, Simon-Vallejo MD, Lozano-Francisco MC, Vera-Pelaez JL, Fin-layson C, et al. Earliest Known Use of Marine Resources by Neanderthals. PLoS ONE, 2011; 6(9): e24026. doi:10.1371/journal.pone.0024026PMID:21935371
5. Sanez-Reguart A. Diccionario historico de los artes de la pesca nacional, vol. 5. La viuda de Don J. Ibarra, editors; 1795.
6. Berthelot S. Etude sur les pêches maritimes dans la Mediterranèe et l’Ocean. Kessinger Publishing, LLC; 1868. doi:10.1542/peds.2010-2442PMID:21382951
7. Osio GC. Reconstruction of Mediterranean Trawl Fisheries and Stock Recovery: What are the Perspec-tives? PhD Thesis, University of New Hampshire, USA. 2012. Available:http://unhlibrary.worldcat.org/ oclc/847990625.
8. NHRF. Fishing in the Greek Seas (in Greek). National Hellenic Research Foundation (NHRF)— Department of Neohellenic Research; 2010. ISBN 978–960–7916–89–1.
9. Colloca F, Cardinale M, Maynou F, Giannoulaki M, Scarcella G, Jenko K, et al. Rebuilding Mediterra-nean fisheries: a new paradigm for ecological sustainability. Fish Fish. 2013; 14: 89–109.
10. Vasilakopoulos P, Maravelias CD, Tserpes G. The Alarming Decline of Mediterranean Fish Stocks, Curr Biol. 2014; 24(14): 1643–1648. doi:10.1016/j.cub.2014.05.070PMID:25017210
11. Pauly D. Anecdotes and the shifting baseline syndrome of fisheries, TREE 1995; 10: 430. PMID: 21237093
12. Fortibuoni T, Libralato S, Raicevich S, Giovanardi O, Solidoro C. Coding early naturalists’accounts into long-term fish community changes in the Adriatic Sea (1800–2000). PLoS ONE, 2010; 5: e15502. doi: 10.1371/journal.pone.0015502PMID:21103349
13. Azzurro E, Moschella P, Maynou F. Tracking Signals of Change in Mediterranean Fish Diversity Based on Local Ecological Knowledge. PLoS ONE, 2011; 6(9): e24885. doi:10.1371/journal.pone.0024885 PMID:21966376
14. Lotze HK, Coll M, Dunne J. Historical changes in marine resources, food-web structure and ecosystem functioning in the Adriatic Sea. Ecosystems 2011; 14: 198–222.
15. Sáenz—Arroyo A, Roberts CM, Torre J, Cariño-Olvera M. Using fishers’anecdotes, naturalists’ obser-vations and grey literature to reassess marine species at risk: the case of the Gulf grouper in the Gulf of California, Mexico. Fish Fish. 2005; 6(2): 121–133.
16. Mc Clenachan L. Documenting loss of large trophy fish from the Florida Keys with historical photo-graphs. Conserv Biol. 2009; 23: 636–643. doi:10.1111/j.1523-1739.2008.01152.xPMID:19183214
17. Boudreau SA, Worm B. Top-down control of lobster in the Gulf of Maine: insights from local ecological knowledge and research surveys. Mar Ecol Progr Ser. 2010; 403: 181–191.
18. Maynou F, Sartor P, Maravelias C, Kavadas S, Damalas D, Cartes JE, et al. Estimating Trends of Popu-lation Decline in Long-Lived Marine Species in the Mediterranean Sea Based on Fishers’Perceptions. PLoS ONE, 2011; 6(7): e21818. doi:10.1371/journal.pone.0021818PMID:21818268
19. Bergmann M, Hinz H, Blyth RE, Kaiser MJ, Rogers SI, Armstrong M. Using knowledge from fishers and fisheries scientists to identify possible groundfish‘Essential Fish Habitats’. Fish Res. 2004; 66(2): 373–379.
20. Sartor P (coord.). The 20th Century evolution of Mediterranean exploited demersal resources under in-creasing fishing disturbance and environmental change, EVOMED. Open call for tenders no. MARE/ 2008/11, Proposal for Lot 4, (Contract No. SI2 539097), 2011. Available:http://ec.europa.eu/fisheries/ documentation/studies/study_evolution_mediterranean/index_en.htm.
21. Anderson MJ. A new method for non-parametric multivariate analysis of variance. Austral Ecol. 2001; 26: 32–46. PMID:11469182
22. Clarke KR. Non-parametric multivariate analyses of changes in community structure. Austral J Ecol. 1993; 18: 117–143.
23. Hastie TJ, Tibshirani RJ. Generalized additive models. Chapman and Hall, London; 1990.
24. Venables WN, Dichmont CM. GLMs, GAMs and GLMMs: an overview of theory for applications in fish-eries research. Fish Res. 2004; 70(2–3): 319–337.
25. Wood S. Generalized Additive Models: An Introduction with R. Chapman & Hall/CRC Press; 2006. PMID:23242683
26. Burnham KP, Anderson DR. Model selection and Multimodel Inference: A Practical Information-Theoretic Approach, 2nd edn. New York: Springer; 2002.
27. Wood S. gamm4: Generalized additive mixed models using mgcv and lme4, R package version 0.1–5; 2011. Available:http://www.icesi.edu.co/CRAN/web/packages/gamm4/gamm4.pdf
29. R Core Team. R: A language and environment for statistical computing, 2014. R Foundation for Statis-tical Computing, Vienna, Austria. Available:http://www.R-project.org/
30. Joutard P. Ces voix qui nous viennent du passe´ (Le temps et les hommes). In: Histoire de l’éducation, Hachette, Paris. 1983; 25 (1): 137–138. PMID:15095733
31. Lozano JA.“Historia oral”. Instituto Mora and UNAM, Mexico; 1993.
32. Morato T, Watson R, Pitcher TJ, Pauly D. Fishing down the deep. Fish Fish. 2006; 7: 24–34.
33. Coll M, Libralato S, Tudela S, Palomera I, Pranovi F. Ecosystem Overfishing in the Ocean. PLoS ONE, 2008; 3: e3881. doi:10.1371/journal.pone.0003881PMID:19066624
34. Swartz W, Sala E, Tracey S, Watson R, Pauly D. The Spatial Expansion and Ecological Footprint of Fisheries (1950 to Present). PLoS ONE, 2011; 5: e15143
35. Bertrand J. The general specifications of the MEDITS surveys. Sci Mar. 2002; 66(2): 9–17.
36. EC (European Commission). Council Regulation No 1543/2000 of 29 June 2000 establishing a Com-munity framework for the collection and management of the data needed to conduct the common fisher-ies policy; 2000. Official Journal of the European Communitfisher-ies L 176/1. Available:http://eur-lex.europa. eu/legal-content/EN/TXT/?uri=CELEX:32000R1543
37. EC (European Commission). Council Regulation (EC) No 199/2008 of 25 February 2008 concerning the establishment of a Community framework for the collection, management and use of data in the fisheries sector and support for scientific advice regarding the Common Fisheries; 2008. Official Jour-nal of the European Union L 60/1. Available:http://eur-lex.europa.eu/legal-content/EN/TXT/?qid= 1422977509535&uri=CELEX:32008R0199
38. Lleonart J, Maynou F. Fish stock assessments in the Mediterranean: state of art. Sci Mar. 2003; 67 (Suppl. 1): 37–49.
39. Ferretti F, Myers RA, Serena F, Lotze HK. Loss of large predatory sharks from the Mediterranean Sea. Conserv Biol. 2008; 22: 952–964. doi:10.1111/j.1523-1739.2008.00938.xPMID:18544092
40. Ferretti F, Worm B, Britten G, Heithaus MR, Lotze HK. Patterns and ecosystem consequences of shark declines in the ocean. Ecol Lett. 2010; 13: 1055–1071. doi:10.1111/j.1461-0248.2010.01489.xPMID: 20528897
41. Ligas A, Osio GC, Sartor P, Sbrana M, De Ranieri S. Long-term trajectory of some elasmobranch spe-cies off the Tuscany coasts (NW Mediterranean) from 50 years of catch data. Sci Mar. 2013; 77(1): 119–127.
42. Collette B, Boustany A, Carpenter KE, Di Natale A, Fox W, Graves J.Scomber scombrus. In: IUCN 2013. IUCN Red List of Threatened Species. Version 2014.3. Available:http://www.iucnredlist.org/ details/170354/0.
43. Cardinale M, Osio GC. Status of Mediterranean and Black Sea resources in European Waters in 2013. Results for stocks in GSA 1–29 (Mediterranean and Black Sea). 2013; Presentation at DG MARE, EC, 17 Sep 2013. Available:http://www.europarl.europa.eu/document/activities/cont/201312/
20131217ATT76355/20131217ATT76355EN.pdf.
44. Jukic-Peladic S, Vrgoc N, Krstulovic-Sifner S, Piccinetti C, Piccinetti-Manfrin G, Marano G, et al. Long-term changes in demersal resource of the Adriatic Sea: composition between trawl surveys carried out in 1948 and 1998. Fish Res. 2001; 53(1): 95–104.
45. Vrgoc N, Krstulović-Šifner S, DadićV, Jukić-PeladićS. Demographic structure and distribution of John Dory,Zeus faberL. 1758, in the Adriatic Sea. J Appl Ichth. 2006; 22: 205–208.
46. Dunn MR. The biology and exploitation of John dory,Zeus faber(Linnaeus, 1758) in the waters of En-gland and Wales. ICES J Mar Sci. 2001; 58(1): 96–105.
47. CIESM. Climate warming and related changes in Mediterranean marine biota. In: Briand F, editor. N° 35 in CIESM Workshop Monographs; 2008. 152 p.
48. Katsanevakis S, Maravelias CD, Damalas D, Karageorgis AP, Tsitsika EV, Anagnostou C, et al. Spatio-temporal distribution and habitat use of commercial demersal species in the eastern Mediterranean Sea. Fish Oceanogr. 2009; 18(6): 439–457.
49. SardàF, Company JB, Maynou F. Deep-sea shrimpAristeus antennatus(Risso 1816) in the Catalan Sea, a review and perspective. J Northw Atl Fish Sci. 2003; 31: 127–136.
50. Bahamon N, Sarda F, Suuronen P. Improvement of trawl selectivity in the NW Mediterranean demersal fishery by using a 40mm square mesh codend. Fish Res. 2006; 81: 15–25.
51. Sala A, Lucchetti A, Piccinetti C, Ferretti M. Size selection by diamond- and square-mesh codends in multispecies Mediterranean demersal trawl fisheries. Fish Res. 2008; 93: 8–21.
52. Matta F. Il merluzzo del Mediterraneo. Boll Pesca Piscic Idrobiol. 1954; 9(1).
54. Audzijonyte A, Kuparinen A, Gorton R, Fulton EA. Ecological consequences of body size decline in har-vested fish species: positive feedback loops in trophic interactions amplify human impact. Biol Lett. 2013; 9(2): 20121103. doi:10.1098/rsbl.2012.1103PMID:23365151
55. Cheung WW, Sarmiento JL, Dunne J, Frölicher TL, Lam VWY, Palomares LD et al. Shrinking of fishes exacerbates impacts of global ocean changes on marine ecosystems. Nat Clim Change. 2012; 3(3): 254–258.
56. Haedrich RL, Barnes SM. Changes over time of the size structure in an exploited shelf fish community. Fish Res. 1997; 31(3): 229–239.
57. Damalas D, Maravelias CD, Kavadas S. Advances in fishing power: a study spanning 50 years. Rev Fish Sci Aquacult. 2014; 22(1): 112–121.