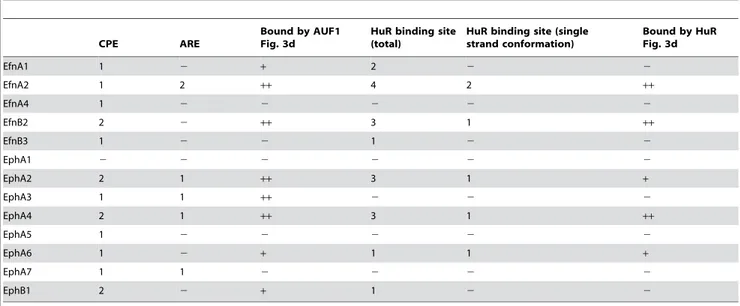
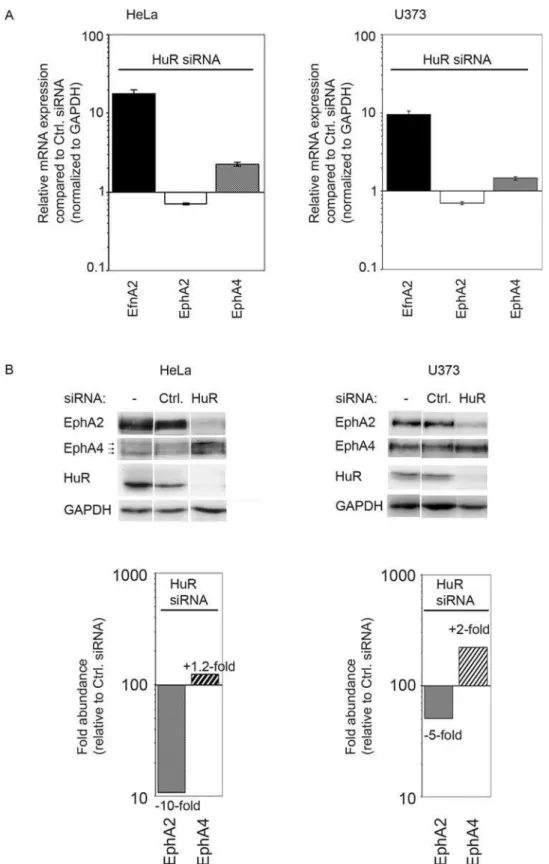
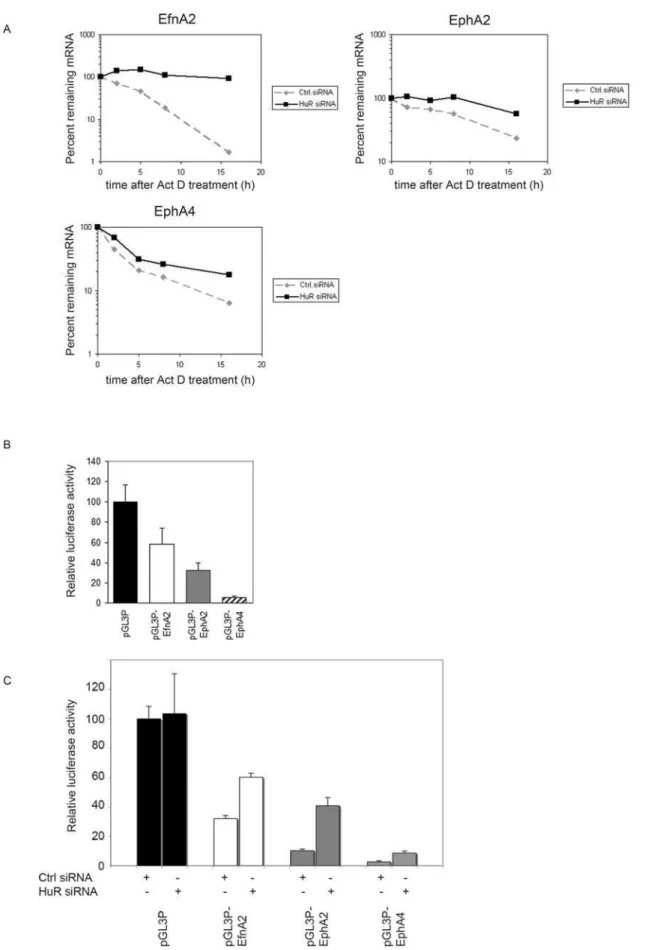
Comparative 3'UTR analysis allows identification of regulatory clusters that drive Eph/ephrin expression in cancer cell lines.
Texto
Imagem
Documentos relacionados
With relation to the third column in Table 3, detailed analysis of the results obtained allows us to conclude that the predictive ability of the model increases to 30% and that,
Neste sentido, propôs-se desenvolver uma investigação cuja temática pretende analisar os sintomas psicopatológicos, como a ansiedade e a depressão, e a perceção de
Com o ritmo frenético causado pelo cuidar do seu familiar, cuidar da restante família, as tarefas domésticas e por vezes ainda as exigências do trabalho, é difícil
We also determined the critical strain rate (CSR), understood as the tangent of the inclination angle between the tangent to the crack development curve and the crack development
At the first stage of the measurements results analysis, the gear wheel cast surface image was compared with the casting mould 3D-CAD model (fig.. Next, the measurements results
Consequently, we found that the HtrA1 transcripts (Figure 1C) and protein expression were also reduced in the pancreatic cancer cell lines PANC-1 and BXPC-3 compared with the
Ao compararmos a Figura 5.1(b) com a Figura 5.1(a), esta com um pólaron no sistema, vemos que a localização de carga é bem mais acentuada quando temos um bipólaron no sistema, que
