BGD
12, 12761–12782, 2015
DOC lability and stable isotope shifts
during microbial decomposition
N. Geeraert et al.
Title Page
Abstract Introduction
Conclusions References
Tables Figures
◭ ◮
◭ ◮
Back Close
Full Screen / Esc
Printer-friendly Version
Interactive Discussion
Discussion
P
a
per
|
Discussion
P
a
per
|
Discussion
P
a
per
|
Discussion
P
a
per
|
Biogeosciences Discuss., 12, 12761–12782, 2015 www.biogeosciences-discuss.net/12/12761/2015/ doi:10.5194/bgd-12-12761-2015
© Author(s) 2015. CC Attribution 3.0 License.
This discussion paper is/has been under review for the journal Biogeosciences (BG). Please refer to the corresponding final paper in BG if available.
Dissolved organic carbon lability and
stable isotope shifts during microbial
decomposition in a tropical river system
N. Geeraert1, F. O. Omengo1,2, G. Govers1, and S. Bouillon1
1
KU Leuven, Department of Earth and Environmental Sciences, Leuven, Belgium
2
Kenya Wildlife Service, Nairobi, Kenya
Received: 13 July 2015 – Accepted: 25 July 2015 – Published: 11 August 2015
Correspondence to: N. Geeraert ([email protected])
BGD
12, 12761–12782, 2015
DOC lability and stable isotope shifts
during microbial decomposition
N. Geeraert et al.
Title Page
Abstract Introduction
Conclusions References
Tables Figures
◭ ◮
◭ ◮
Back Close
Full Screen / Esc
Printer-friendly Version
Interactive Discussion
Discussion
P
a
per
|
Discussion
P
a
per
|
Discussion
P
a
per
|
Discussion
P
a
per
|
Abstract
A significant amount of carbon is transported to the ocean as dissolved organic carbon (DOC) in rivers. During transport, it can be transformed through microbial consumption and photochemical oxidation. In dark incubation experiments with water from the Tana River, Kenya, we examined the consumption of DOC through microbial decomposition
5
and the associated change in its carbon stable isotope composition (δ13C). In 15 of the 18 incubations, DOC concentrations decreased significantly by 10 to 60 %, with most of the decomposition taking place within the first 24–48 h. After 8 days, the re-maining DOC was up to 3 ‰ more depleted in13C compared with the initial pool, and the change inδ13C correlated strongly with the fraction of DOC remaining. We propose
10
that the shift inδ13C is consistent with greater microbial lability of DOC originating from herbaceous C4 vegetation than DOC derived from woody C3 vegetation in the
semi-arid lower Tana. The findings complement earlier data that riverine C sources do not necessarily reflect their proportion in the catchment: besides spatial distribution, also processing within the river can further influence the riverineδ13C.
15
1 Introduction
Rivers form the main connection between the terrigenous and oceanic organic carbon (OC) pools. Although rivers were previously seen as mere conduits of water and ma-terial, this is no longer the case (Cole et al., 2007; Battin et al., 2009; Aufdenkampe et al., 2011). Indeed, from the 1.9 Pg C yr−1(Cole et al., 2007; Regnier et al., 2013) to
20
2.7 Pg C yr−1 (Battin et al., 2009) estimated to be globally entering inland waters, only 0.9 Pg C yr−1 is delivered to the ocean (Cole et al., 2007; Battin et al., 2009; Regnier
et al., 2013). Of the total OC flux, 73±21 % is exported as dissolved carbon
(Alvarez-Cobelas et al., 2012). Despite the significant amount of terrigenous carbon entering the river systems, relatively little organic material with a terrigenous signature can be found
25
BGD
12, 12761–12782, 2015
DOC lability and stable isotope shifts
during microbial decomposition
N. Geeraert et al.
Title Page
Abstract Introduction
Conclusions References
Tables Figures
◭ ◮
◭ ◮
Back Close
Full Screen / Esc
Printer-friendly Version
Interactive Discussion
Discussion
P
a
per
|
Discussion
P
a
per
|
Discussion
P
a
per
|
Discussion
P
a
per
|
2014). Therefore, it is important to have a better understanding of the changes OC is subjected to and at which point those changes occur during their transport towards the oceans. Two processes, photochemical oxidation and microbial consumption, are able either to mineralize the terrigenous OC, or transform it in such a way that its char-acteristics resemble the oceanic OC (Bianchi and Bauer, 2011; Lalonde et al., 2014;
5
Marìn-Spiotta et al., 2014). When this transformation of the OM characteristics occurs during transport in the rivers, it may lead to inconsistent characteristics between the ter-restrial input, what is present in the river and the OM which is delivered to the ocean, if the transformation processes are not fully understood.
Photochemical processes can occur directly, when the chromophoric dissolved
or-10
ganic matter (DOM) becomes excited under the influence of UV and visible light, lead-ing to transformation within the molecules, or indirectly when free radicals are formed which react with organic compounds (Amon and Benner, 1996; Lalonde et al., 2014). Compared with carbohydrates, lignin components are found to be much more suscep-tible to photochemical degradation, despite their resistance to biological degradation
15
(Opsahl and Benner, 1998; Opsahl and Zepp, 2001; Spencer et al., 2009). As lignin is more depleted in13C than the bulk DOM, decomposition of lignin would lead to a13C enrichment of the remaining DOC pool (Opsahl and Zepp, 2001). An increase in the
δ13C signature of DOC under the influence of UV light has indeed been observed in different river systems such as the Congo, Amazon, and Mississippi rivers (Opsahl and
20
Zepp, 2001; Spencer et al., 2009; Lu et al., 2013; Lalonde et al., 2014).
The biodegradable fraction of DOC can be quantified by the loss of DOC by micro-bial consumption in dark incubation experiments (Servais et al., 1989). Several exper-iments have combined the effect of photochemical oxidation with microbial incubation, either by exposing filtered water to UV light followed by the addition of inoculum (Amon
25
BGD
12, 12761–12782, 2015
DOC lability and stable isotope shifts
during microbial decomposition
N. Geeraert et al.
Title Page
Abstract Introduction
Conclusions References
Tables Figures
◭ ◮
◭ ◮
Back Close
Full Screen / Esc
Printer-friendly Version
Interactive Discussion
Discussion
P
a
per
|
Discussion
P
a
per
|
Discussion
P
a
per
|
Discussion
P
a
per
|
2013; Lalonde et al., 2014). Furthermore, microbial and photochemical processes exert greater effect in combination than independently (Benner and Kaiser, 2011; Lu et al., 2013). However, photochemical processes only take place in the light penetrated upper layer of a river, while microbial consumption can take place in the entire water column. Depth-integrated estimates for the Amazon River indicate that microbial consumption
5
is the dominant process affecting DOC degradation, accounting for a loss of ca. 0.75 % of the DOC per day, while it is only 0.01 % for photochemical oxidation (Amon and Benner, 1996). Studies have not found a significant change inδ13C associated with microbial consumption of DOC, with the exception of the Congo and Parana rivers, which experienced a decrease in δ13C by 1.2 and 2.5 ‰ (Lalonde et al., 2014).
Ac-10
cording to Lalonde et al. (2014), the different behavior for these rivers might be due to the importance of the C4carbon fixation pathway in their catchments.
In the discussion about processes affecting the stable carbon isotope signature of DOC, it is important to distinguish between isotope fractionation and selective decom-position. In processes subjected to isotope fractionation, there is a preferential use
15
of the light or heavy isotopes of a homogeneous substrate because it is energetically more favorable. When the original substrate is not homogeneous, the isotope signature of the different components might be different. If one of those components decomposes at a faster rate than others (i.e. selective decomposition takes place), the isotope sig-nature of the remaining substrate will shift towards the isotope sigsig-nature of the less
20
degradable component. During the degradation of DOC in aquatic systems, selective decomposition might be the main reason for changes in isotope signatures; Opsahl and Zepp (2001) have demonstrated that the isotope shift during photochemical ox-idation is caused by the preferential decomposition of lignin components, which are isotopically lighter than the remaining13C-enriched carbohydrates.
25
BGD
12, 12761–12782, 2015
DOC lability and stable isotope shifts
during microbial decomposition
N. Geeraert et al.
Title Page
Abstract Introduction
Conclusions References
Tables Figures
◭ ◮
◭ ◮
Back Close
Full Screen / Esc
Printer-friendly Version
Interactive Discussion
Discussion
P
a
per
|
Discussion
P
a
per
|
Discussion
P
a
per
|
Discussion
P
a
per
|
time, we noticed a decrease inδ13CDOC(from−22.6 to−24.6 ‰). These findings
sug-gested that significant DOC processing took place in the lower Tana River. However, quantifying decomposition rates as well as understanding decomposition mechanisms requires more detailed information than can be obtained from river time series alone. Therefore, we performed dark incubation experiments during the two last campaigns
5
in order to assess the stability of DOC over the travel time of the water between both stations (ca. 5 days). We focused on the microbial decomposition of DOC, as light pen-etration was limited due to the high sediment load of the river, typically>100 mg L−1 in the lower Tana (Bouillon et al., 2009; Tamooh et al., 2012, 2014). We also tested whether decomposition dynamics was significantly affected by the presence of POC
10
and suspended sediment. The presence of POC could affect microbial degradation kinetics and DOC mineralization as it may function as a source of DOC.
2 Material and methods
The Tana River catchment (95 500 km2) is characterized by a strong variation in cli-mate: high rainfall (up to 3000 mm yr−1
) and relatively low temperatures (around 10◦C) 15
occur in the highlands of the source area of the Tana, while the area around Garissa is very warm (around 35◦C) and receives an annual amount of ca. 350 mm yr−1, with high interannual variability. The rainfall follows a bimodal distribution resulting in high discharge from April to June and from November to January.
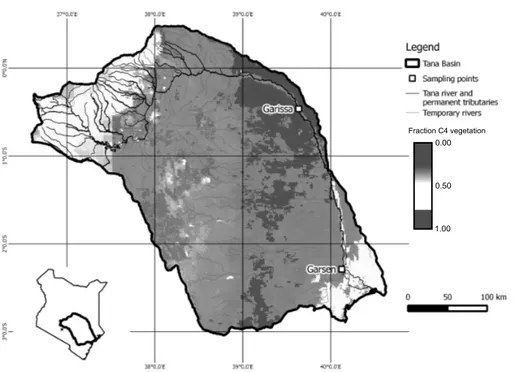
The variability in climate results in strong variations in vegetation composition
20
(Fig. 1). The overall coverage of the catchment with C4 vegetation is 59 %, based on the revised isoscape map (using the Global Land Cover 2000 map and estimates of crop %) of Still and Powell (2010) which was converted to a ratio of C4vegetation cover
based on a 2-source mixing scenario with as end members C3vegetation and C4 veg-etation with aδ13C of respectively−27 and −12 ‰. Between the sampling sites, the
25
BGD
12, 12761–12782, 2015
DOC lability and stable isotope shifts
during microbial decomposition
N. Geeraert et al.
Title Page
Abstract Introduction
Conclusions References
Tables Figures
◭ ◮
◭ ◮
Back Close
Full Screen / Esc
Printer-friendly Version
Interactive Discussion
Discussion
P
a
per
|
Discussion
P
a
per
|
Discussion
P
a
per
|
Discussion
P
a
per
|
Water samples were taken from the lower Tana River at Garissa and near Garsen (Fig. 1). The distance along the river between the sampling points is 385 km, and only ephemeral tributaries, which hold water during only a few days per year, are present along this stretch of the river. Sampling took place during the wet seasons in May– June, 2013 and in April–May, 2014. In 2013, maximum discharge in Garissa reached
5
750 m3s−1 which resulted in extensive flooding between the two sampling locations (but not upstream of Garissa), while only two small discharge peaks (up to 280 m3s−1) occurred in 2014.
Grab water samples were taken from the middle of two bridges crossing the river. One 40 mL subsample was used to determine the initial DOC concentration. This
wa-10
ter was vacuum filtered on a pre-combusted GF/F filter (pore size: 0.7 µm) and subse-quently filtered with a 0.2 µm Sartorius Minisart syringe filter. The filtration was started as soon as possible after sampling, but due to the high sediment load in the water, it could take up to 2 h before the filtration was finished. Finally, 50 µL of H3PO4 was added for preservation. These samples were stored in the dark until analysis, which
15
was within 4 months of sampling.
The remainder of the grab water sample was used to monitor DOC degradation. In 2013, the degradation rate of DOC was measured under two different treatments: with and without removal of particulate organic carbon (POC). In the first treatment, 500 mL of unfiltered water was stored in a glass bottle wrapped in Al foil. In the second,
20
500 mL of river water was first filtered to 0.2 µm as described above for DOC sampling. After filtration, 5 mL of unfiltered river water was added to serve as inoculum. Similar to the unfiltered set-up, the water was then kept in foil-covered glassware. To avoid large changes in temperature, both bottles were submerged either directly in the river water, or in a coolbox with water as an isolator from outside temperature changes. Water
25
temperature was regularly measured and ranged between 25 and 30◦C. At days 2,
BGD
12, 12761–12782, 2015
DOC lability and stable isotope shifts
during microbial decomposition
N. Geeraert et al.
Title Page
Abstract Introduction
Conclusions References
Tables Figures
◭ ◮
◭ ◮
Back Close
Full Screen / Esc
Printer-friendly Version
Interactive Discussion
Discussion
P
a
per
|
Discussion
P
a
per
|
Discussion
P
a
per
|
Discussion
P
a
per
|
50 µL of H3PO4 in glass vials with Teflon-coated screw caps. We carried out 4 series of incubation experiments (both filtered and unfiltered) at each location.
In 2014, 5 incubation series were carried out at each location, but only with filtered water (second treatment). The methodology was identical to the one used in 2013, except that subsamples were taken at days 1, 2, 3, 5 and 8 in order to provide a higher
5
time resolution during the early stages of the incubations.
DOC concentration and isotopic signature were measured with a wet oxidation TOC analyzer (IO Analytical Aurora 1030W) coupled with an isotope ratio mass spectrom-eter (ThermoFinnigan DeltaV Advantage). Calibrations were based on a 2-point cali-bration (IAEA-C6:δ13C−10.4 ‰ and an internal standard, sucrose:δ13C−26.99 ‰).
10
Based on replicates of the standards, the error in the concentration measurements was
<3 % and the standard deviation for theδ13C measurements was<0.2 ‰.
Decay rates, i.e. absolute rates of DOC loss per unit of time, over the whole incuba-tion period were calculated based on the concentraincuba-tion difference between the day of in situ sampling (day 0) and day 8, which is the last common day between the
mea-15
surements in 2013 and 2014. Initial decay rates were calculated over the first 2 days. We calculated the concentration (Cmin) and δ13C signature (δ13Cmin) of the DOC fraction lost to mineralization during the incubation period based on a 2-source mixing scenario:
Cmin=Cinit−Cfin (1)
20
δ13Cmin=Cinit·δ 13
Cinit−Cfin·δ13Cfin
Cinit−Cfin (2)
The initial concentration (Cinit) and δ13C signature (δ13Cinit) were those measured on day 0, while the final concentration (Cfin) andδ13C signature (δ13Cfin) were those measured on day 8. The seven series for which the relative error on the calculated
Cmin was higher than 50 % (due to very slow mineralization rates and hence, minor
25
BGD
12, 12761–12782, 2015
DOC lability and stable isotope shifts
during microbial decomposition
N. Geeraert et al.
Title Page
Abstract Introduction
Conclusions References
Tables Figures
◭ ◮
◭ ◮
Back Close
Full Screen / Esc
Printer-friendly Version
Interactive Discussion
Discussion
P
a
per
|
Discussion
P
a
per
|
Discussion
P
a
per
|
Discussion
P
a
per
|
of the results. For the series that were retained, the standard error on the isotopic signature of the mineralized DOC was estimated to be equal or less than 0.4 ‰, based on standard error propagation methods.
3 Results and discussion
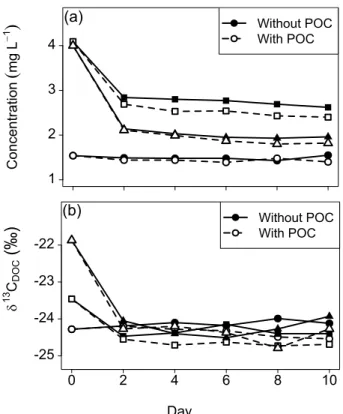
3.1 Comparison of incubation experiments with and without POC
5
In the incubation series with relatively limited decomposition of DOC, the presence of POC did not result in significant changes in concentration between both treatments (Fig. 2a, Table 1). In all other cases was a significant difference between the filtered and unfiltered incubation series, whereby the final concentration of DOC was system-atically higher in the samples without POC by ca. 10 %. A similar pattern was observed
10
forδ13CDOC(Fig. 2b, Table 1), whereby the samples with POC were slightly more
de-pleted in13C than the ones without POC, with on average ca. 0.3 ‰ difference. These two findings indicate that there was no substantial net addition of DOC originating from the POC pool within the time frame of our sampling. Mineralization rates were slightly enhanced in experiments with POC, likely due to the higher biomass of the
15
heterotrophic microbial community in the presence of suspended matter. As this en-hancement was relatively minor and because of the covariations between changes in DOC and δ13CDOC during both treatments, the unfiltered incubation series is treated as equivalent to the filtered ones for the remainder of the discussion.
3.2 Change in DOC concentration during microbial degradation
20
BGD
12, 12761–12782, 2015
DOC lability and stable isotope shifts
during microbial decomposition
N. Geeraert et al.
Title Page
Abstract Introduction
Conclusions References
Tables Figures
◭ ◮
◭ ◮
Back Close
Full Screen / Esc
Printer-friendly Version
Interactive Discussion
Discussion
P
a
per
|
Discussion
P
a
per
|
Discussion
P
a
per
|
Discussion
P
a
per
|
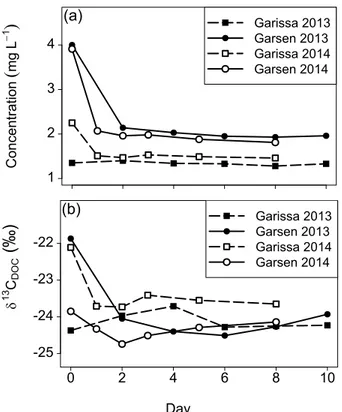
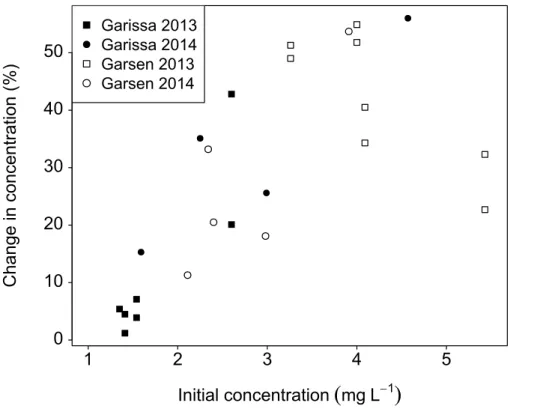
2.98 mg L−1. By day 8 of the incubation, this range was reduced to 1.28–4.20 mg L−1, and an average concentration of 1.96 mg L−1. Out of all series, only 6 samples from the upstream station (Garissa) in 2013 (three filtered ones and the corresponding un-filtered ones) showed minor degradation of DOC (a change of <10 % of the initial concentration). This limited decrease in concentration can be related to the low initial
5
concentration which was for all those samples below 2 mg L−1and which might consist
completely of the recalcitrant DOC, which is also still present at the end of the series where mineralization took place (Fig. 4).
Paired t tests over all the filtered series, indicated that the concentration at day 2 was significantly different (p <0.05) from the initial concentration, with a mean diff
er-10
ence of 0.91 mg L−1. The concentration difference between day 2 and day 8 over all the filtered series was also significant (paired t test, p <0.05), with an average de-crease in concentration of 0.09 mg L−1. The rate of decay of DOC ranged between 0.002 and 0.320 mg L−1day over the whole incubation (day 0 to day 8), with on aver-age 0.127 mg L−1day, while the decay rate during the first two incubation days reached 15
up to 1.50 mg L−1day, with an average of 0.456 mg L−1day. Similar to our experiments, Moody et al. (2013) observed an average decline of 47 % in DOC after 10 days dark incubation of water from a peat-covered catchment. They also observed that the major-ity of the degradation took place during the first two days, while degradation continued thereafter at a much lower rate (Moody et al., 2013).
20
3.3 Changes in stable isotope signatures of DOC during microbial degradation
Overall, δ13CDOC signatures decreased consistently during microbial degradation (Fig. 3b, Table 1). However, there was considerable variation in magnitude of change between the different series. Some incubation series, mainly in 2013 at Garissa and in 2014 at Garsen, experienced hardly any change, while other series, especially in
25
BGD
12, 12761–12782, 2015
DOC lability and stable isotope shifts
during microbial decomposition
N. Geeraert et al.
Title Page
Abstract Introduction
Conclusions References
Tables Figures
◭ ◮
◭ ◮
Back Close
Full Screen / Esc
Printer-friendly Version
Interactive Discussion
Discussion
P
a
per
|
Discussion
P
a
per
|
Discussion
P
a
per
|
Discussion
P
a
per
|
which is in line with previous measurements for the lower Tana River (Bouillon et al., 2009; Tamooh et al., 2012). Towards the end of the incubation (day 8), δ13C values had decreased significantly, ranging between−25.3 and−23.3 ‰ (avg.−24.2 ‰).
The δ13CDOC values at day 2 were significantly different from initial δ13C values (pairedttest,p <0.05) over all the filtered incubation series, with a decrease of 0.8 ‰.
5
In contrast to the concentration, no significant change inδ13C was detected between day 2 and day 8.
3.4 Characterization of mineralized and remaining C
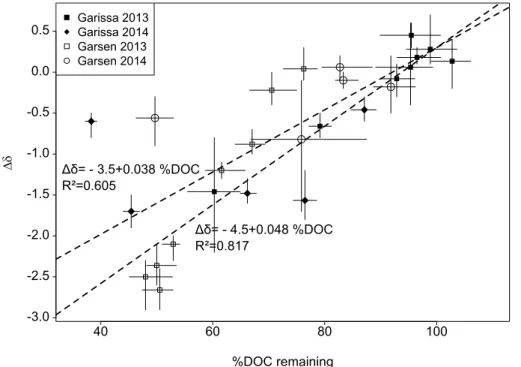
The change inδ13C was positively related to the proportion (%) of DOC still present af-ter incubation (Fig. 5). A stronger reduction in DOC led to a more13C depleted residue,
10
implying that the mineralized fraction of the DOC was enriched in13C vs. the bulk initial DOC pool. The regression equation for a linear fit over the averaged points per incu-bation series over the whole dataset was∆δ=−3.5+0.038×(%DOC remaining) (R2
0.605). However, two series with a strong reduction in DOC, but relatively little change in isotopic signature can be seen as outliers (Fig. 5). After removal of the latter data
15
points, the regression equation became∆δ=−4.5+0.048×(%DOC remaining), with
a higherR2value of 0.817.
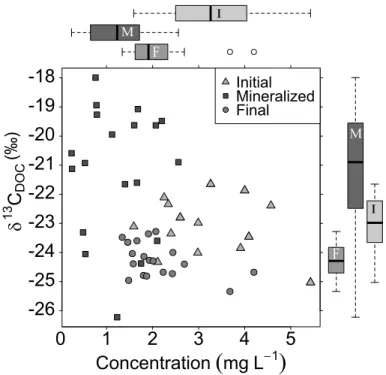
The isotopic characteristics of the mineralized DOC were clearly different from the initial DOC as well as from the remaining DOC (Fig. 6). The mineralized fraction of the DOC was more enriched in13C than the initial or remaining DOC, with average values
20
of−21.2,−23.1 and−24.3 ‰ for the mineralized, initial and remaining carbon pools for
all the observations. The concentration of the mineralized DOC was on average lower than that of the DOC which was more resistant to microbial degradation.
3.5 Removal mechanism and origin of DOC
Analogous to an isotopic shift due to selective photochemical oxidation of certain
com-25
mecha-BGD
12, 12761–12782, 2015
DOC lability and stable isotope shifts
during microbial decomposition
N. Geeraert et al.
Title Page
Abstract Introduction
Conclusions References
Tables Figures
◭ ◮
◭ ◮
Back Close
Full Screen / Esc
Printer-friendly Version
Interactive Discussion
Discussion
P
a
per
|
Discussion
P
a
per
|
Discussion
P
a
per
|
Discussion
P
a
per
|
nism to explain the shift inδ13C that we observed during DOC decomposition, whereby the isotopically heavier carbohydrates were preferentially decomposed. However, if such a mechanism were to be generally valid, a similar shift would be expected in other types of aquatic systems (irrespective of the C3/C4dominance in the catchment),
yet previous studies have typically shown little or no change inδ13C during microbial
5
degradation of DOC (Lu et al., 2013; Lalonde et al., 2014). However, a similar de-crease inδ13CDOC due to microbial degradation has been shown for both the Congo
and Parana rivers (Lalonde et al., 2014). One characteristic which both river systems have in common with the Tana River, is the presence of C4 vegetation within their catchment. A higher decomposition rate for the C4-derived DOC, as reported for soil
10
organic carbon (Wynn and Bird, 2007), would indeed be consistent with the observed isotopic shift.
It is, however, not clear whether the different decomposition rates are inherently re-lated to the different photosynthetic pathways used by C3and C4vegetation, or to the
fact that in tropical regions such as the Tana River catchment, C3 vegetation consists
15
of shrubs and trees, which are more resistant to degradation, while C4vegetation
con-sists of grass species, which are more easily degraded. The latter option would appear more likely, as a study directly comparing the decomposition of C3 and C4 grasses has shown a greater decomposition rate for C3grasses (Ross et al., 2002). More
ded-icated studies using a similar experimental approach as used here, but with mixtures
20
of DOC originating from both C3and C4 grasses would be required to verify the latter hypothesis.
Microbial degradation was high during the initial phase (first 48 h) in both sampling sites. Considering the water travel time (∼5 days) between these sites, the high
reac-tivity even at the downstream site implies that there is not merely a downstream
trans-25
BGD
12, 12761–12782, 2015
DOC lability and stable isotope shifts
during microbial decomposition
N. Geeraert et al.
Title Page
Abstract Introduction
Conclusions References
Tables Figures
◭ ◮
◭ ◮
Back Close
Full Screen / Esc
Printer-friendly Version
Interactive Discussion
Discussion
P
a
per
|
Discussion
P
a
per
|
Discussion
P
a
per
|
Discussion
P
a
per
|
groundwater inputs. Only the first source was explicitly tested for in the experiments in 2013, and it appeared that after 48 h, there was no net effect of the presence of POC. This does not completely rule out POC as a source of DOC, as ambient conditions in a river setting are still different than in our experimental setup. The advection of DOC by tributaries is unlikely, as their water flow is very erratic, likely even absent in 2014,
5
while the presence of labile DOC was fairly constant. Input from the flooded floodplain will have been important in Garsen during the flooding in 2013 as DOC concentrations were significantly higher. However, it can not explain the presence of labile DOC during the wet season of 2014 when no considerable flooding took place. The last two options, river bed sediments and groundwater flow, are speculative, as no information on them
10
is yet available. The analysis of optical characteristics of the dissolved organic mat-ter pool (Jaffé et al., 2008; Lambert et al., 2015) could be a valuable complementary approach in order to understand the origin and processing of DOC in rivers.
4 Conclusions
Our experiments demonstrated that in the lower Tana River, a fraction of the DOC
15
is highly susceptible to decomposition, similar to observations in other large river sys-tems. While it was previously considered that bacterial mineralization of labile dissolved OM generally has little influence on δ13CDOC signatures, our results show that such
a change should be taken into account, at least when considering environments with mixed C3/C4 inputs. Differences in the rate of decomposition of the DOC originating
20
from C3 and C4 vegetation will lead to an underestimation of the C4-derived carbon
input in catchments if the residence time between the input of carbon and the sampling location allows significant microbial degradation.
In addition, the high reactivity of the DOC at both sites has raised the question about the origin of the labile DOC pool. The applied method was only able to exclude POC
25
includ-BGD
12, 12761–12782, 2015
DOC lability and stable isotope shifts
during microbial decomposition
N. Geeraert et al.
Title Page
Abstract Introduction
Conclusions References
Tables Figures
◭ ◮
◭ ◮
Back Close
Full Screen / Esc
Printer-friendly Version
Interactive Discussion
Discussion
P
a
per
|
Discussion
P
a
per
|
Discussion
P
a
per
|
Discussion
P
a
per
|
ing optical characterization, would be required to shed more light on the dynamical replacement of the labile DOC pool in river systems.
The Supplement related to this article is available online at doi:10.5194/bgd-12-12761-2015-supplement.
Acknowledgement. Funding was provided by the KU Leuven Special Research Fund, the
5
Research Foundation Flanders (FWO-Vlaanderen, project G024012N), and an ERC Starting Grant (240002, AFRIVAL). We are grateful to the Kenya Wildlife Service (KWS) for assistance during field experiments and to Z. Kelemen for help with stable isotope analysis.
References
Alvarez-Cobelas, M., Angeler, D., Sánchez-Carillo, S., and Almendros, G.: A worldwide view of
10
organic carbon export from catchments, Biogeochemistry, 107, 275–293, 2012.
Amon, R. and Benner, R.: Photochemical and microbial consumption of dissolved organic car-bon and dissolved oxygen in the Amazon River system, Geochim. Cosmochim. Ac., 60, 1783–1792, 1996.
Aufdenkampe, A. K., Mayorga, E., Raymond, P. A., Melack, J. M., Doney, S. C., Alin, S. R.,
15
Aalto, R. E., and Yoo, K.: Riverine coupling of biogeochemical cycles between land, oceans, and atmosphere, Front. Ecol. Environ., 9, 53–60, 2011.
Battin, T. J., Luyssaert, S., Kaplan, L. A., Aufdenkampe, A. K., Richter, A., and Tranvik, L. J.: The boundless carbon cycle, Nat. Geosci., 2, 598–600, 2009.
Benner, R. and Kaiser, K.: Biological and photochemical transformations of amino acids and
20
lignin phenols in riverine dissolved organic matter, Biogeochemistry, 102, 209–222, 2011. Bianchi, T. S. and Bauer, J. E.: Particulate organic carbon cycling and transformation, in:
Trea-tise on Estuarine and Coastal Science, edited by: Wolansky, E. and McLusky, D., Academic Press, Waltham, 69–117, 2011.
Bouillon, S., Abril, G., Borges, A. V., Dehairs, F., Govers, G., Hughes, H. J., Merckx, R.,
25
BGD
12, 12761–12782, 2015
DOC lability and stable isotope shifts
during microbial decomposition
N. Geeraert et al.
Title Page
Abstract Introduction
Conclusions References
Tables Figures
◭ ◮
◭ ◮
Back Close
Full Screen / Esc
Printer-friendly Version
Interactive Discussion
Discussion
P
a
per
|
Discussion
P
a
per
|
Discussion
P
a
per
|
Discussion
P
a
per
|
cycling of carbon in the Tana River (Kenya): a dry season basin-scale survey from headwa-ters to the delta, Biogeosciences, 6, 2475–2493, doi:10.5194/bg-6-2475-2009, 2009. Cole, J. J., Prairie, Y. T., Caraco, N. F., McDowell, W. H., Tranvik, L. J., Striegl, R. G.,
Duarte, C. M., Kortelainen, P., Downing, J. A., Middelburg, J. J., and Melack, J.: Plumbing the global carbon cycle: integrating inland waters into the terrestrial carbon budget, Ecosystems,
5
10, 172–185, 2007.
Jaffé, R., McKnight D. M., Maie, N. Cory, R., McDowell, W. H., Campbell, J. L.: Spatial and tem-poral variatins in DOM composition in ecosystems: the importance of long-term monitoring of optical properties, J. Geophys. Res., 113, G04032, doi:10.1029/2008JG000683, 2008. Lalonde, K., Vähätalo, A. V., and Gélinas, Y.: Revisiting the disappearance of terrestrial
10
dissolved organic matter in the ocean: a δ13C study, Biogeosciences, 11, 3707–3719,
doi:10.5194/bg-11-3707-2014, 2014.
Lambert, T., Darchambeau, F., Bouillon, S., Alhou, B., Mbega, J., Teodoru, C. R., Nyoni, F. C., Massicotte, P., Borges, A. V.: Landsacpe control on the spatial and temporal variability of chromophoric dissolved organic matter and dissolved organic carbon in large African rivers,
15
Ecosystems, 1–16, doi:10.1007/s10021-015-9894-5, 2015.
Lu, Y., Bauer, J. E., Canuel, E. A., Yamashita, Y., Chambers, R. M., and Jaffé, R.: Photochem-ical and microbial alteration of dissolved organic matter in temperate headwater streams associated with different land use, J. Geophys. Res.-Biogeo., 118, 566–580, 2013.
Marìn-Spiotta, E., Gruley, K. E., Crawford, J., Atkinson, E. E., Miesel, J. R., Greene, S.,
20
Cardona-Correa, C., and Spencer, R. G. M.: Paradigm shifts in soil organic matter research affect interpretations of aquatic carbon cycling: transcending disciplinary and ecosystem boundaries, Biogeochemistry, 117, 279–297, 2014.
Moody, C. S., Worrall, F., Evans, C. D., and Jones, T. G.: The rate of loss of dissolved organic carbon (DOC) through a catchment, J. Hydrol., 492, 139–150, 2013.
25
Opsahl, S. and Benner, R.: Photochemical reactivity of dissolved lignin in river and ocean wa-ters, Limnol. Oceanogr., 43, 1297–1304, 1998.
Opsahl, S. P. and Zepp, R. G.: Photochemically-induced alteration of stable carbon isotope ratios (δ13C) in terrigenous dissolved organic carbon, Geophys. Res. Lett., 28, 2417–2420, 2001.
30
BGD
12, 12761–12782, 2015
DOC lability and stable isotope shifts
during microbial decomposition
N. Geeraert et al.
Title Page
Abstract Introduction
Conclusions References
Tables Figures
◭ ◮
◭ ◮
Back Close
Full Screen / Esc
Printer-friendly Version
Interactive Discussion
Discussion
P
a
per
|
Discussion
P
a
per
|
Discussion
P
a
per
|
Discussion
P
a
per
|
Regnier, P., Friedlingstein, P., Ciais, P., Mackenzie, F. T., Gruber, N., Janssens, I. A., Laruelle, G. G., Lauerwald, R., Luyssaert, S., Andersson, A. J., Arndt, S., Arnosti, C., Borges, A. V., Dale, A. W., Gallego-Sala, A., Goddéris, Y., Goossens, N., Hartmann, J., Heinze, C., Ilyina, T., Joos, F., LaRowe, D. E., Leifeld, J., Meysman, F. J. R., Munhoven, G., Raymond, P. A., Spahni, R., Suntharalingam, P., and Thullner, M.: Anthropogenic
perturba-5
tion of the carbon fluxes from land to ocean, Nat. Geosci., 6, 597–607, 2013.
Ross, D., Tate, K., Newton, P., and Clark, H.: Decomposability of C3and C4grass litter sampled under different concentrations of atmospheric carbon dioxide at a natural CO2 spring, Plant Soil, 240, 275–286, 2002.
Servais, P., Anzil, A., and Ventresque, C.: Simple method for determination of biodegradable
10
dissolved organic carbon in water, Appl. Environ. Microb., 55, 2732–2734, 1989.
Spencer, R. G. M., Stubbins, A., Hernes, P. J., Baker, A., Mopper, K., Aufdenkampe, A. K., Dyda, R. Y., Mwamba, V. L., Mangangu, A. M., Wabakanghanzi, J. N., and Six, J.: Pho-tochemical degradation of dissolved organic matter and dissolved lignin phenols from the Congo River, J. Geophys. Res., 114, G03010, doi:10.1029/2009JG000968, 2009.
15
Still, C. J. and Powell, R. L.: Continental-scale distributions of vegetation stable carbon iso-tope ratios, in: Isoscapes: Understanding Movement, Pattern, and Process on Earth through Isotope Mapping, Springer, Dordrecht, Heidelberg, London, New York, 179–193, 2010. Tamooh, F., Van den Meersche, K., Meysman, F., Marwick, T. R., Borges, A. V., Merckx, R.,
Dehairs, F., Schmidt, S., Nyunja, J., and Bouillon, S.: Distribution and origin of suspended
20
matter and organic carbon pools in the Tana River Basin, Kenya, Biogeosciences, 9, 2905– 2920, doi:10.5194/bg-9-2905-2012, 2012.
Tamooh, F., Meysman, F. J. R., Borges, A. V., Marwick, T. R., Van den Meersche, K., Dehairs, F., Merckx, R., and Bouillon, S.: Sediment and carbon fluxes along a longitudinal gradient in the lower Tana River (Kenya), J. Geophys. Res.-Biogeo., 119, 1340–1353, 2014.
25
BGD
12, 12761–12782, 2015
DOC lability and stable isotope shifts
during microbial decomposition
N. Geeraert et al.
Title Page
Abstract Introduction
Conclusions References
Tables Figures
◭ ◮
◭ ◮
Back Close
Full Screen / Esc
Printer-friendly Version
Interactive Discussion
Discussion
P
a
per
|
Discussion
P
a
per
|
Discussion
P
a
per
|
Discussion
P
a
per
|
Table 1.Concentration and isotopic signatures at the start (day 0) and the end (day 8) of the incubation series (the full dataset including all intermediate measurements, can be found in the Supplement).
Sitea yr Dateb Filteredc Initial C Final C % Remainingd Initialδ13C (‰) Finalδ13C (‰) ∆δ(‰)e (mg L−1
) (mg L−1
)
GSA 2013 04/05 U 2.60 1.48 57 −22.8 −25.0 −2.2
GSA 2013 15/05 U 1.54 1.48 96 −24.3 −24.5 −0.2
GSA 2013 26/05 U 1.35 −24.4
GSA 2013 05/06 U 1.41 1.39 99 −23.9 −23.3 0.6
GSA 2013 04/05 F 2.60 2.07 80 −22.8 −23.3 −0.5
GSA 2013 15/05 F 1.54 1.43 93 −24.3 −24.0 0.3
GSA 2013 26/05 F 1.35 1.28 95 −24.4 −24.2 0.1
GSA 2013 05/06 F 1.41 1.34 95 −23.9 −23.6 0.3
GSN 2013 03/05 U 5.43 3.68 68 −25.0 −25.3 −0.3
GSN 2013 14/05 U 4.09 2.43 59 −23.5 −24.7 −1.3
GSN 2013 26/05 U 4.00 1.80 45 −21.9 −24.8 −2.9
GSN 2013 06/06 U 3.26 1.58 49 −21.6 −24.4 −2.7
GSN 2013 03/05 F 5.43 4.20 77 −25.0 −24.7 0.3
GSN 2013 14/05 F 4.09 2.69 66 −23.5 −24.4 −0.9
GSN 2013 26/05 F 4.00 1.93 48 −21.9 −24.3 −2.4
GSN 2013 06/06 F 3.26 1.66 51 −21.6 −23.6 −2.0
GSA 2014 02/04 F 4.99 −23.5
GSA 2014 11/04 F 2.99 2.23 74 −23.0 −24.7 −1.7
GSA 2014 20/04 F 4.57 2.01 44 −22.4 −24.3 −1.9
GSA 2014 29/04 F 2.25 1.46 65 −22.1 −23.7 −1.5
GSA 2014 08/05 F 1.59 1.34 85 −23.1 −23.5 −0.4
GSN 2014 06/04 F 3.91 1.81 46 −23.9 −24.1 −0.3
GSN 2014 15/04 F 2.11 1.87 89 −24.3 −24.8 −0.5
GSN 2014 24/04 F 2.98 2.44 82 −24.0 −24.0 0.0
GSN 2014 03/05 F 2.40 1.91 80 −23.4 −23.4 0.0
GSN 2014 12/05 F 2.34 1.56 67 −22.3 −24.0 −1.7
a
BGD
12, 12761–12782, 2015
DOC lability and stable isotope shifts
during microbial decomposition
N. Geeraert et al.
Title Page
Abstract Introduction
Conclusions References
Tables Figures
◭ ◮
◭ ◮
Back Close
Full Screen / Esc
Printer-friendly Version
Interactive Discussion
Discussion
P
a
per
|
Discussion
P
a
per
|
Discussion
P
a
per
|
Discussion
P
a
per
|
0.00
0.50
1.00
Fraction C4 vegetation
BGD
12, 12761–12782, 2015
DOC lability and stable isotope shifts
during microbial decomposition
N. Geeraert et al.
Title Page
Abstract Introduction
Conclusions References
Tables Figures
◭ ◮
◭ ◮
Back Close
Full Screen / Esc
Printer-friendly Version
Interactive Discussion
Discussion
P
a
per
|
Discussion
P
a
per
|
Discussion
P
a
per
|
Discussion
P
a
per
|
(a)
(b)
(‰)
BGD
12, 12761–12782, 2015
DOC lability and stable isotope shifts
during microbial decomposition
N. Geeraert et al.
Title Page
Abstract Introduction
Conclusions References
Tables Figures
◭ ◮
◭ ◮
Back Close
Full Screen / Esc
Printer-friendly Version
Interactive Discussion
Discussion
P
a
per
|
Discussion
P
a
per
|
Discussion
P
a
per
|
Discussion
P
a
per
|
Δδ= - 3.5+0.038 %DOC R²=0.605
Δδ= - 4.5+0.048 %DOC R²=0.817
BGD
12, 12761–12782, 2015
DOC lability and stable isotope shifts
during microbial decomposition
N. Geeraert et al.
Title Page
Abstract Introduction
Conclusions References
Tables Figures
◭ ◮
◭ ◮
Back Close
Full Screen / Esc
Printer-friendly Version
Interactive Discussion
Discussion
P
a
per
|
Discussion
P
a
per
|
Discussion
P
a
per
|
Discussion
P
a
per
|
(‰)
I
I
M
M F
F