Hormonal and Hepatocanalicular Transporter Genetic
Variants in Gallstone Disease in North Indian Population
Anshika Srivastava1, Avshesh Mishra1, Rajan Singh1, Rajani Rai1, Neena Srivastava2, Balraj Mittal1*
1Department of Genetics, Sanjay Gandhi Post Graduate Institute of Medical Sciences (SGPGIMS) Lucknow, Uttar Pradesh, India,2Department of Physiology, King George’s Medical University (KGMU) Lucknow, Uttar Pradesh, India
Abstract
Objective: Cholesterol gallstone disease (CGD) is a multifactorial and multistep disease. Apart from female gender and increasing age being the documented non-modifiable risk factor for gallstones the pathobiological mechanisms underlying the phenotypic expression of CGD appear to be rather complex, and one or more variations in genes could play critical roles in the diverse pathways further progressing to cholesterol crystal formation. In the present study we performed genotyping score, Multifactor dimensionality reduction (MDR) and Classification and Regression Tree analysis (CART) to identify combinations of alleles among the hormonal, hepatocanalicular transporter and adipogenesis differentiation pathway genes in modifying the risk for CGD.
Design:The present case-control study recruited total of 450 subjects, including 230 CGD patients and 220 controls. We analyzed commonESR1, ESR2, PGR, ADRB3, ADRA2A, ABCG8, SLCO1B1, PPARc2,andSREBP2gene polymorphisms to find out
combinations of genetic variants contributing to CGD risk, using multi-analytical approaches (G-score, MDR, and CART).
Results:Single locus analysis by logistic regression showed association ofESR1IVS1-397C.T (rs2234693), IVS1-351A.G (rs9340799)PGRins/del (rs1042838)ADRB3-190 T.C (rs4994)ABCG8D19H (rs11887534),SLCO1B1Exon4 C.A (rs11045819) and SREBP2 1784G.C (rs2228314) with CGD risk. However, the MDR and CART analysis revealed ESR1 IVS1-397C.T (rs2234693)ADRB3-190 T.C (rs4994) andABCG8D19H (rs11887534) polymorphisms as the best polymorphic signature for discriminating between cases and controls. The overall odds ratio for the applied multi-analytical approaches ranged from 4.33 to 10.05 showing an incremental risk for cholesterol crystal formation. In conclusion, our muti-analytical approach suggests that,ESR1, ADRB3,in addition toABCG8genetic variants confer significant risk for cholesterol gallstone disease.
Citation:Srivastava A, Mishra A, Singh R, Rai R, Srivastava N, et al. (2013) Multi-Analytic Approach Elucidates Significant Role of Hormonal and Hepatocanalicular Transporter Genetic Variants in Gallstone Disease in North Indian Population. PLoS ONE 8(4): e59173. doi:10.1371/journal.pone.0059173
Editor:Matias A. Avila, University of Navarra School of Medicine and Center for Applied Medical Research (CIMA), Spain ReceivedOctober 26, 2012;AcceptedFebruary 12, 2013;PublishedApril 8, 2013
Copyright:ß2013 Srivastava et al. This is an open-access article distributed under the terms of the Creative Commons Attribution License, which permits unrestricted use, distribution, and reproduction in any medium, provided the original author and source are credited.
Funding:The study was supported by research and fellowship grants from ICMR, DBT and DST. The funders had no role in study design, data collection and analysis, decision to publish, or preparation of the manuscript.
Competing Interests:The authors have declared that no competing interests exist. * E-mail: bml_pgi@yahoo.com
Introduction
Cholesterol Gallstone disease (CGD) corresponds to one of the most recurrent and costly gastroenterological disorder. It is world-wide health problem representing 10% to 15% of the adult population in industrialised countries [1,2] whereas a prevalence of 6% have been reported from North India [3]. The female gender and increasing age are the documented non-modifiable risk factors for gallstones [4], the pathobiological mechanisms under-lying the phenotypic expression of CGD appear to be rather complex, and one or more defects could occur in genes that play critical roles in the diverse pathways leading to cholesterol gallstone formation. The genetic determinants of gallstone formation have only recently been dissected in humans [5] Compelling evidence for familial clustering and an increased concordance of the trait in monozygotic twins as compared to dizygotic twins [6] further confirms the heritability of gallstones. Thus ‘Gallstone genes’ are continuously being corroborated in
genome-wide association studies (GWAS), in case-control cohorts, and in family studies [7,8].
In human physiology, the gender disparity commences with puberty and continues through the childbearing years [9,10,11,12] which suggests that female sex hormones, could be an important risk factor for the formation of cholesterol gallstones [13]. The actions of these hormones such as estrogen, progesterone and catecholamines are executed through one or more of their respective receptors as estrogen receptors (ESRs), progesterone receptor (PGR) and adrenergic receptor (ADR) Allelic variants of
ESR, PGRandADRgenes have been shown to be associated with susceptibility or progression with various disorders such as myocardial infarction [14,15], cholesterol gallstones and biliary tract diseases [16].
Another area of interest is hepatocanalicular transporters namely ATP-binding cassette transporters (ABC transporters) and organic anion transporters both encoded by ABC and
transporters have been implicated in cholesterol gallstones formation owing to their ability to influence bile composition and causing retention of substances normally secreted in bile.
Peroxisome proliferator-activated receptor c 2 (PPARc2) orchestrate the adipocyte differentiation process whereas sterol regulatory element binding protein 2 (SREBP-2) is involved in adipocyte differentiation followed by cholesterol homeostasis. Series of previous observations have suggested that regulatory interactions between the SREBPs and PPARc2 can coordinate cholesterol and fatty acid metabolism. Therefore, sequence variation in these genes may further disrupt the cholesterol homeostasis which in turn may nurture the development of CGD. Previously, we have studied the role of some individual genetic variants with CGD susceptibility in a North Indian population [17,18,19]. Individual SNPs have little predictive value because of their modest effect on risk, but combinations of gene variants may improve the predictive ability and could be used to model susceptibility to CGD. Therefore, the current study aimed to search for gene-gene interactions in the selected pathways (hormonal, hepatocanalicular and adipogenesis differentiation) as a key contributory factor in the disease outcome.
The analysis of such interactions in case-control studies is weighed down by one of the major problems, namely, the curse of dimensionality. Recently, Multifactor-Dimensionality Reduction (MDR) approach, tree-based techniques: classification and regres-sion trees (CART), and genotyping score [20] have been used to detect interactions in large-scale association studies [21]. The strength of these methodologies is their ability to identify association in cases of small sample sizes and low penetrance of candidate single nucleotide polymorphisms (SNPs). Therefore, we have extended our previous work on CGD susceptibility by jointly investigating 13 SNP genotypes in 9 genes belonging to hormonal pathway [ESR1 IVS1-397C.T (rs2234693), IVS1-351A.G (rs9340799), Ex4-122C.G (rs1801132), ESR2 -789 A.C (rs1271572), 1082 G.A (rs1256049) PGR ins/del (rs1042838)
ADRB3-190 T.C (rs4994) andADRA2A (rs1800544)], hepatoca-nalicular transporter pathway [ABCG8 D19H (rs11887534),
SLCO1B1 Exon4 C.A (rs11045819), Ex6+40T.C (rs4149056)] and adipogenesis differentiation pathway [PPAR c2 C.G (rs1801282)SREBP21784G.C (rs2228314)], avoiding the prob-lem of dimensionality and multiple comparisons.
Results
Population Characteristics
The demographic profile of gallstone patients with respect to their age and gender matched controls are presented in Table 1.
Allelic Distribution of Studied Polymorphisms in Controls The genotypic and allelic distribution ofESR1IVS1-397C.T, IVS1-351A.G, Ex4-122C.G, ESR2 -789 A.C, 1082 G.A
PGR ins/del ADRB3-190 T.C and ADRA2A -1291 C.G in hormonal pathway, ABCG8 D19H, SLCO1B1 Exon4 C.A, Ex6+40T.C in hepatocanalicular transporter pathway andPPAR
c2 C.G SREBP2 1784G.C in adipogenesis differentiation pathway are shown in Table 2, 3 and 4. The details of the selected genes have been shown in supplementary table 1 (Table S1). The observed genotype frequencies of all the studied polymorphisms in controls were in accordance with Hardy-Weinberg equilibrium (p,0.05).
Overall Frequency Distribution of Selected Hormonal, Hepatocanalicular Transporter and Adipogenesis Differentiation Gene Polymorphisms in GSD Patients and Healthy Subjects
Association of hormonal pathway gene polymorphisms with gallstone patients. Table 2 shows the risk of gallstones in relation to each of the SNPs ofESR1, ESR2, PGR,and ADR in hormonal pathway. On comparing the genotype frequency distribution of our study groups i.e. gallstone patients with that of healthy subjects (HS), the homozygous variant genotypes of
ESR1 IVS1-397C.T, IVS1-351A.G and ADRB3 -190 T.C polymorphism showed statistically significant increased risk for developing gallstone (p =,0.001; [OR], 2.9: p = 0.002; [OR], 2.6: p =,0.001; [OR], 1.9.). On the contrary, no significant differ-ences were observed in the distribution of Ex4-122C.G, (ptrend = 0.605; MCS = 0.599),ESR2-789 A.C (ptrend = 0.630; MCS = 0.578), Ex6 1082 G.A (ptrend = 0.546; MCS = 0.435),
ADRA2A -1291 C.G (ptrend = 0.070; MCS = 0.065) polymor-phisms in selected groups, both at genotypic and allelic levels. The variant-containing genotypes (DI+II) of PGRins/del showed low risk in gallstone patients which was also significant (p = 0.004; [OR], 0.4; p = 0.009; [OR], 0.4 Table 2) when compared with homozygous wild-type DD genotype. Furthermore, on subdividing the study groups on the basis of gender we observed thatESR1
IVS1-397C.T and ADRB3 -190 T.C conferred increased risk for gallstones in female gender (Table S5).
Association of hepatocanalicular transporter pathway gene polymorphisms with gallstone patients. Table 3 shows the risk of gallstones in relation to each of the SNPs ofABCG8and
SLCO1B1 in hepatocanalicular transporter pathway. We found that in single locus analysis, the variant genotypes (GC+CC) of
ABCG8 145 G.C and (CA+AA) of SLCO1B1 463 C.A were significantly associated and conferred increased risk of gallstone disease (p =,0.019; [OR], 2.4: p = 0.007; [OR], 2.6). On the contrary, no significant difference were observed in the distribu-tion of SLCO1B1 521 T.C (rs4149056) (ptrend = 0.416; MCS = 0.298) polymorphism, both at genotypic and allelic levels and therefore conferred no risk for developing gallstones.
Association of adipogenesis differentiation pathway gene polymorphisms with gallstone patients. Table 4 shows the genotype and allele frequency distribution of sequence variants in
SREBP21784 G.C andPPARc2C.G. A borderline statistical significance was observed when the homozygous variant genotypes of SREBP2 1784 G.C (rs2228314) was compared i.e gallstone patients with that of healthy subjects (HS) (p = 0.045; [OR], 4.8). Furthermore, no significant difference was observed in the distribution of PPAR c2 C.G (rs1801282) (ptrend = 0.256; MCS = 0.218).
Table 1.Demographic profile of controls and gallstone patients.
Characteristic Healthy subjects Gallstone patients
Total 220 230
Age at interview (years) Mean6SD
49.069.8 48.6611.9
Sex
Male (n%) 77 (35.0) 83 (36.1)
Female (n%) 143 (65.0) 147 (63.9)
Table 2.Hormonal pathway.
Genotypes/Alleles Controls n (%) Cases n (%) p-value OR (95% CI)
ESR 1IVS1-397C.T
CC 91 (41.4) 64 (27.8) 2 1 (reference)
CT 110 (50.0) 128 (55.7) 0.019 1.66 (1.09–2.53)
TT 19 (8.6) 38 (16.5) 0.001 2.98 (1.56–5.70)
Ptrend ,0.001
*MCS 0.001
CT+TT 129 (58.6) 166 (72.2) 0.003 1.86 (1.23–2.80)
C 292 (66.4) 256 (55.7) 2 1 (reference)
T 148 (33.6) 204 (44.3) 0.001 1.59 (1.21–2.11)
ESR1IVS1-351A.G
AA 90 (40.9) 69 (30.0) 1 (reference)
AG 109 (49.5) 117 (50.9) 0.142 1.37 (0.90–2.07)
GG 21 (9.5) 44 (19.1) 0.002 2.65 (1.43–4.91)
Ptrend ,0.001
*MCS 0.001
AG+GG 130 (59.1) 161 (70.0) 0.025 1.58 (1.06–2.35)
A 289 (65.7) 255 (55.5) 2 1 (reference)
G 151 (34.3) 205 (44.5) 0.005 1.49 (1.13–1.95)
ESR1Ex4-122C.G
CC 106 (48.2) 120 (52.2) 2 1 (reference)
CG 104 (47.3) 97 (42.2) 0.487 0.87 (0.59–1.29)
GG 10 (4.5) 13 (5.7) 0.981 0.99 (0.41–2.40)
Ptrend 0.605
*MCS 0.599
CG+GG 114 (51.8) 110 (47.8) 0.518 0.88 (0.60–1.29)
C 318 (71.9) 337 (73.5) 2 1 (reference)
G 124 (28.1) 123 (26.5) 0.306 0.86 (0.63–1.15)
ESR2-789 A.C
AA 94 (43.2) 105 (45.7) 2 1 (reference)
AC 109 (49.1) 107 (47.0) 0.596 0.90 (0.61–1.33)
CC 17 (7.7) 18 (7.4) 0.728 0.87 (0.41–1.85)
Ptrend 0.630
*MCS 0.578
AC+CC 126 (56.8) 125 (54.3) 0.571 0.90 (0.61–1.31)
A 297 (67.5) 317 (68.9) 2 1 (reference)
C 143 (32.5) 143 (31.1) 0.521 0.91 (0.68–1.21)
ESR21082 G.A
GG 206 (93.6) 212 (92.2) 2 1 (reference)
GA+AA 14 (6.4) 18 (7.8) 0.596 1.22 (0.58–2.56)
Ptrend 0.546
*MCS 0.435
G 428 (97.0) 442 (96.3) 2 1 (reference)
A 14 (3.0) 18 (3.7) 0.416 1.36 (0.65–2.87)
PGRIns/Del
DD 181 (83.6) 208 (90.4) 2 1 (reference)
DI+II 39 (16.4) 22 (9.6) 0.009 0.46 (0.25–0.82)
Ptrend 0.011
*MCS 0.015
Haplotype Analysis
Linkage disequilibrium and haplotypes analysis ofESR1
andESR2in case and control groups. On LD analysis,ESR1
rs2234693 and rs9340799 were found to be in strong linkage disequilibrium (D’ = 0.575). Haplotypes were constructed for the three polymorphisms in ESR1 gene including IVS1-397C.T, IVS1-351A.G and Ex4-122C.G. The haplotypes comprising Table 2.Cont.
Genotypes/Alleles Controls n (%) Cases n (%) p-value OR (95% CI)
I 39 (8.9) 22 (4.7) 0.002 0.41 (0.24–0.72)
ADRB3 -190 T.C
TT 178 (80.9) 158 (68.7) 2 1 (reference)
TC+CC 42 (19.1) 72 (31.3) ,0.001 1.96 (1.43–2.69)
Ptrend 0.003
*MCS 0.002
T 398 (90.5) 388 (84.3) 2 1 (reference)
C 42 (9.5) 72 (15.7) 0.005 1.80 (1.19–2.73)
ADRA2A-1291 C.G
CC 61 (27.7) 53 (23.0) 2 1 (reference)
CG 117 (53.2) 117 (50.9) 0.678 1.1 (0.7–1.7)
GG 42 (19.1) 60 (26.1) 0.070 1.6 (1.0–2.9)
Ptrend 0.075
*MCS 0.065
CG+GG 159 (72.3) 177 (77.0) 0.317 1.2 (0.8–1.9)
C 239 (54.3) 223 (48.4) 2 1 (reference)
G 201 (45.6) 237 (51.5) 0.056 1.5 (1.0–2.5)
MCS = Monte Carlo Simulation; Significant values are in bold; For categorical data Cochrane Armitage trend test was used. doi:10.1371/journal.pone.0059173.t002
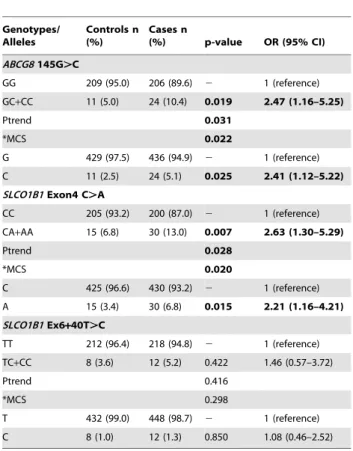
Table 3.Hepatocanalicular transporter pathway.
Genotypes/ Alleles
Controls n (%)
Cases n
(%) p-value OR (95% CI) ABCG8145G.C
GG 209 (95.0) 206 (89.6) 2 1 (reference)
GC+CC 11 (5.0) 24 (10.4) 0.019 2.47 (1.16–5.25)
Ptrend 0.031
*MCS 0.022
G 429 (97.5) 436 (94.9) 2 1 (reference)
C 11 (2.5) 24 (5.1) 0.025 2.41 (1.12–5.22) SLCO1B1Exon4 C.A
CC 205 (93.2) 200 (87.0) 2 1 (reference)
CA+AA 15 (6.8) 30 (13.0) 0.007 2.63 (1.30–5.29)
Ptrend 0.028
*MCS 0.020
C 425 (96.6) 430 (93.2) 2 1 (reference)
A 15 (3.4) 30 (6.8) 0.015 2.21 (1.16–4.21) SLCO1B1Ex6+40T.C
TT 212 (96.4) 218 (94.8) 2 1 (reference)
TC+CC 8 (3.6) 12 (5.2) 0.422 1.46 (0.57–3.72)
Ptrend 0.416
*MCS 0.298
T 432 (99.0) 448 (98.7) 2 1 (reference)
C 8 (1.0) 12 (1.3) 0.850 1.08 (0.46–2.52)
MCS = Monte Carlo Simulation; Significant values are in bold; For categorical data Cochrane Armitage trend test was used.
doi:10.1371/journal.pone.0059173.t003
Table 4.Adipogenesis differentiation pathway.
Genotypes/ Alleles
Controls n
(%) Cases n (%) p-value OR (95% CI) SREBP21784G.C
GG 145 (65.9) 138 (60.0) 2 1 (reference)
GC 73 (33.2) 82 (35.7) 0.475 1.16 (0.77–1.74)
CC 2 (0.9) 10 (4.3) 0.045 4.87 (1.03–22.96)
Ptrend 0.067
*MCS 0.057
GC+CC 75 (34.1) 92 (40.0) 0.250 1.26 (0.85–1.87)
G 363 (82.5) 358 (77.8) 2 1 (reference)
C 77 (17.5) 102 (22.2) 0.165 1.27 (0.91–1.79)
PPARGc2 C.G
CC 178 (80.9) 176 (76.5) 2 1 (reference)
CG+GG 42 (19.1) 54 (23.5) 0.351 1.25 (0.78–1.98)
Ptrend 0.256
*MCS 0.218
C 398 (90.5) 406 (88.4) 2 1 (reference)
G 42 (9.5) 54 (11.6) 0.652 1.11 (0.71–1.72)
MCS = Monte Carlo Simulation; Significant values are in bold; For categorical data Cochrane Armitage trend test was used.
the homozygous wild alleles were taken as reference and the difference in the frequencies of haplotypes between patients and controls were tested using chi-square test.
The results of the studied three polymorphisms of ESR1
revealed that distribution of T,G,C haplotypes was significantly higher in gallstone patients (25.1% v/s 13.7) in comparison to controls and was conferring high risk for gallstone disease (p = 0.0012; [OR], 2.2). Global haplotypes analysis indicated a statistically significant difference between cases and controls based on the distribution pattern of the ESR1 haplotypes (p =,0.001). Furthermore, none of the ESR2 haplotypes conferred risk for gallstones presenting the global haplotypes association p-value = 0.65 (Table S2; S3).
Linkage disequilibrium and haplotypes analysis of SLCO1B1 in case and control groups. SLCO1B1 Exon4 C.A and Ex6+40T.C were found to be in strong linkage disequilibrium (D’ = 0.8916). Haplotypes analysis of these two polymorphisms gave rise to three haplotypes, of which C, T was the most common haplotypes in control population. On compar-ing the haplotypes frequencies in controls and gallstone cases, A, T haplotypes was more commonly distributed in gallstone patients and was imposing risk for the disease (p = 0.017; OR = 2.21) (Table S4).
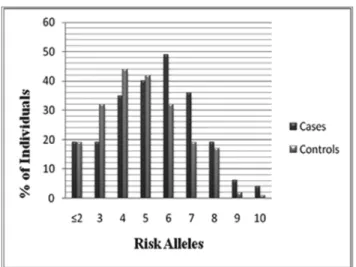
G-score. For each individual, we counted the number of risk-increasing alleles. The number of risk alleles ranged from 1 to 11 in overall 450 subjects (Figure 1). The mean (6SD) G-score was 5.4361.96 in gallstones subjects and 4.6361.95 in controls (p-value =,0.001) (Table 5). At the more extreme ends of the risk distribution, CIs around risk estimates became very wide because
of small numbers. The number of risk alleles ranged from 1 to 11 with a median of 4 among control subjects and 6 among cases (Figure 1). The risk for gallstone disease was estimated for each number of risk alleles, relative to the median number of risk alleles of 4, and ranged from an OR of 2.27 (95% confidence interval [CI], 1.0–4.6) for 5 risk alleles to an OR of 8.27 (95% CI, 0.90– 75.2) for 11 risk alleles. The average relative risk increase per risk allele, when treated as an ordinal variable, however, could be estimated with a high level of precision, and was 2.7 (95% CI, 1.12–1.16). This corresponded to several fold difference in risk between the lowest and the highest number of risk alleles in our population.
Association of High-Order Interactions with GSD Risk by MDR Analysis
Table 6 shows the best interaction model by MDR analysis. The one-factor model for predicting GS risk was ABCG8 145 G.C SNP (testing accuracy = 0.515, CVC = 7/10, permutation p = 0.027). The two-factor model of ESR1 IVS1 351A.G and
ADRB3 -190 T.C had an improved testing accuracy of 0.578 (permutation p =,0.001) however, the CVC was increased (10/ 10). The three factor model was the three-factor model including
ESR1 IVS1-397C.T ESR1 IVS1 351A.G and ADRB3 -190T.C SNPs, which yielded the testing accuracy of 0.605 and the CVC of 08/10 (permutation p =,0.001). The best four-factor interaction model consisted ofESR1IVS1-397C.T,ESR1IVS1 351A.G,ADRB3 -190T.C andABCG8145 G.C with highest testing accuracy compared with the one-factor model (CVC = 10/ 10 permutation p =,0.001).
Association of High-Order Interactions with GSD Risk by CART Analysis
Table 7 shows the CART, which included all investigated genetic variants of the selected pathways. The final tree structure contained seven terminal nodes as defined by single-nucleotide polymorphisms of the hormonal, hepatocanalicular transporter and adipogenesis differentiation pathway genes. Consistent with the MDR best one-factor model, the initial split of the root node on the decision tree wasESR1IVS1-397C.T, suggesting that this SNP is the strongest risk factor for GSD among the polymor-phisms examined. Individuals carrying ESR1 IVS1 -397CC,
ADRB3-190 TT, ABCG8 145 GG and ADRA2A GG genotypes had the lowest case rate of 17.2%, considered as reference. Further inspection of the tree structure revealed distinct interaction patterns between individuals carrying theESR1IVS1-397 variant and those with theADRB3variant andSLCO1B1463 C.A wild genotypes. Using the terminal node with lowest case rate as reference, individuals carrying the combination of ESR1 IVS1-397TT,SLCO1B1Exon4CC,ESR21082GG,ESR1IVS1-351AA and ESR1 Ex4-122GG exhibited a significantly higher risk for Figure 1. The 13-SNP G-score distribution in patients with
gallstones and control subjects. doi:10.1371/journal.pone.0059173.g001
Table 5.Mean G-Scores in the Selected Pathway and their Corresponding p-values.
Selected Pathways Cases Controls p-value
Hormonal 4.4661.68 3.9261.76 0.001
Hepatocanalicular Transporter 0.2960.54 0.16860.37 0.004
Adipogenesis Differentiation 0.6760.84 0.5460.70 0.062
Overall Genotyping Score Mean for all pathways 5.4361.96 4.6361.95 ,0.001
GSD (adjusted OR 5.083; 95% CI, 1.3–18.48), whereas individ-uals with the combined genotypes ofESR1IVS1-397TT,ABCG8
145 GC+CC, ESR21082GG+ ESR1IVS1-351GG and ADRB3
TC+CC had the highest risk for CGD (adjusted OR 6.48; 95% CI, 1.9–22.08). (Table 7).
Discussion
In order to achieve a more comprehensive evaluation of CGD risk, present analysis was performed in order to identify high and low intrinsic risk sets of sequence variants. Of the included 13 polymorphisms, some of them were found to be significantly associated with CGD risk in our previous studies [17,18,19] while others showed little or no influence on the risk for CGD development. Moreover, accumulating evidence supports the importance of adipogenesis differentiation and adrenergic receptor pathways in cholesterol associated diseases [22,23,24]. Therefore, we further extended our work by incorporating these two pathways.
In the single-locus analysis, genetic variants of hormonal pathway,ESR1IVS1-397C.T, IVS1-351A.G andADRB3190 T.C were significantly associated with GSD risk [17]. However,
Alu insertion polymorphism of progesterone receptors (PGR) conferred lower risk with gallstones. In hepatocanalicular trans-porter pathway ABCG8 D19H and SLCO1B1 Exon4 C.A conferred increased risk for CGD At haplotypes level, we found that the gallstones subjects who carry ESR1 haplotypes
IVS1-397T, IVS1-351G, Ex4-122C andSLCO1B1haplotypes Exon4A, Ex6+40T conferred increased risk for gallstones.
Based on the candidate SNPs in genes involved in the gallstone pathway. We created a consolidated Genotype Score (G-score) from the number of risk alleles as previously reported for risk assessment of cardiovascular events and diabetes [25,26]. Our assumption was that individuals with a high G-score might have a higher probability of gallstone development as compared to those with the low G-score. The overall G-scores for the three selected pathways obtained were highly significant and conferred increased risk for gallstone development. Further calculating the G-score individually in respective pathways we found both hormonal and hepatocanalicular transporter pathway conferred increase risk. These results suggest significant role of hormonal receptor and hepatocanalicular transporters in gallstone disease.
For the higher order gene-gene interaction analysis, we employed statistical approaches namely MDR and CART analysis to find out the particular combinations of genetic variants contributing to CGD risk. In MDR analysis, we observed the best four-factor interaction model consisting of ESR1 IVS1-397C.T,ESR1IVS1 351A.G,ADRB3 -190T.C andABCG8
145 G.C with highest testing accuracy compared with the one-factor model.
In CART analysis, which is a non-parametric statistical approach for conducting regression and classification analyses by recursive partitioning. [17], study subjects were grouped according to different risk levels on the basis of the different gene polymorphisms. From this analysis, we found that development Table 6.Association of High-Order Interactions with GSD Risk by MDR Analysis.
No. of interacting
loci Best Interaction Model
Testing
Accuracy #
CVC Pfor permutation Testing
1 ABCG8145 G.C 0.5156 7/10 0.0027
2 ESR1IVS1 351A.GADRB3-190T.C 0.5784 10/10 ,0.001
3 ESR1IVS1-397C.TESR1IVS1 351A.G,ADRB3-190T.C 0.6050 8/10 ,0.001
4 aESR1
IVS1-397C.T,ESR1IVS1 351A.G,ADRB3 -190T.C
ABCG8145 G.C
0.6212 10/10 ,0.001
#
CVC: Cross Validation Consistency.
aThe model with the maximum testing accuracy and maximum CVC cross was considered as the best model. The present study calculated, the best interaction model as
the four-factor model includingaESR1
IVS1-397C.T,ESR1IVS1 351A.G,ADRB3-190T.C,ABCG8145 G.C polymorphisms. doi:10.1371/journal.pone.0059173.t006
Table 7.Risk Estimates of CART Terminal Nodes.
Nodes Genotypes Case ratea(%) p-value ORb
1 ESR1IVS1397W+ADRB3W+ABCG8W+ADRA2A W 17.2 2 Reference
2 ESR1IVS1-397V+SLCO1B1 463 W+ESR2 1082W+ESR1IVS1-351V+ESRHinf1 W 21.7 0.352 0.429 (0.07–2.55)
2 ESR1IVS1-397W+ADRB3W+ABCG8W+ADRA2AV+ESR2Bsa1 V 29.3 0.475 1.576 (.453–5.479)
3 ESR1IVS1-397W+ADRB3W+ABCG8W+ADRA2AV+ESR2Bsa1W 47.2 0.018 4.33 (1.29–14.59)
4 ESR1IVS1-397V+SLCO1B1463 W+ESR21082W+ESR1IVS1-351V+ESRHinf1 V 56.2 0.014 5.083 (1.39–18.48)
5 ESR1IVS1397V+ABCG8V+ESR21082W+ESR1IVS1-351V+ADRB3V 63.0 0.003 6.48 (1.90–22.08)
6 ESR1IVS1-397V+ADRB3V 76.9 0.002 10.05 (2.33–43.29)
7 ESR1IVS1-397W+ADRB3V+ESRHinf1W 78.6 0.002 24.554 (3.24–185.84)
W = wild genotype. V = variant genotype.
aCase rate is the percentage of gallstone patients among all individuals in each node. bORs of terminal nodes were calculated by LR analysis adjusted for age and gender.
of CGD involves complex genetic interactions among the hormonal and hepatocanalicular transporter genetic variants. As our results from CART analyses consistently suggested that
ESR1IVS1-397TT, ABCG8GC+CC, ESR1IVS1-351GG and
ADRB3 TC+CC polymorphisms are the most important single susceptibility factor for CGD development.
The association between hormonal receptor gene polymor-phisms and risk of gallstones are biologically convincing. It has been assumed that the gallbladder is a female sex hormone responsive organ, and these hormones might be involved in the pathogenesis of gallbladder diseases. Elaborating on estrogen receptor the animal studies have shown that ESRs are present in the hepato-pancreatic-biliary tree [27,28,29] including bile duct epithelial cells and gallbladder. In addition, immunohistochemical and quantitative RT PCR studies have also revealed that the expression level of ESR1 gene is approximately 50 fold higher compared toESR2. In animal models, 17beta estradiol promoted gallstone formation which further involves the upregulation of hepatic expression of ERalpha but not ERbeta. These studies show that ESR-1 is key player and findings may offer a new approach to treat gallstones by inhibiting hepatic ER activity with a liver-specific, ERalpha-selective antagonists.
The literature regarding theADRB3confirms that it is localized in the smooth muscles of the vasculature and the muscularis propria of the gallbladder [30] where it is thought to mediate relaxation and increase mucosal blood flow. The T.C polymor-phism results in lowered responsiveness to potent agonists including endogenous catecholamines. [31] The mutated receptor had less ability to stimulate adenylyl cyclase and therefore less accumulation of cAMP. [31] Activation ofADRB3also results in smooth muscle relaxation in the guinea-pig common bile duct, [32] and since the ductal smooth muscle appear to be more sensitive to activation of the ß3-adrenoceptor, there is the possibility that these receptors may be involved in the regulation of tone in the ductal smooth muscle and hence the outflow of bile. Thus the inhibiting variant C inADRB3might result in gallstone formation by impairing the relaxation of the gallbladder and probably the biliary tree too, setting the stage for crystal formation. In the selected hepatocanalicular transportersABCG8145G.C conferred increased risk both individually and in combination to hormonal receptors. A genome wide scan carried out by Buch
et al., [33] identified a variant D19H in the hepatic cholesterol transporter (ABCG8) as major susceptibility factor for human gallstone disease. Subsequently, this association has been replicat-ed in various populations [9,19,34,35].
The phenomenon that a combination of polymorphisms within genes of unrelated pathways may elevate the risk for CGD could be explained by two hypotheses. One possibility is that some connection between these genes or proteins exists but still remains to be discovered. Another hypothesis, more credible in our opinion, is that the genes influencing risk for CGD may as well comprise a set of alterations located within genes not related to each other.
Our multi-analytic approach revealed that the combination of genotypes of respective polymorphisms asESR1IVS1-397 variant,
ABCG8 145 variant, ESR1 IVS1-351 variant and ADRB3 190 variant pose a significant risk for developing gallstone. Comparing to the results of single locus analysis the role ofSLCO1B1Exon4 C.ASREBP21784 G.C andPGRins/del was diminished when the overall analysis of 13 selected polymorphisms was performed. It also suggests that ESR1, ADRB3and ABCG8 have significant incremental risk factors for gallstone disease. Thus, the application of these multi analytical approaches allowed creating a decision that has more sensitivity or specificity and was more accurate with
reasonable power as compared to single strategy employed in calculating risk allele for disease prediction.
Also a prominent significant role of hormonal pathway was elucidated when the means of genotyping scores of selected pathways was calculated separately or all together. Therefore, exhaustive analysis of multi-analytic approaches as MDR, CART and G-scores are well recognized methods in understanding complex traits, such as disease susceptibility and also the etiology of complex diseases.
In summary, this is the first comprehensive study to use a multigenic analysis for cholesterol gallstone disease, and the data suggest that individuals with a higher number of genetic variations in hormonal and hepatocanalicular transporter pathway genes are at an increased risk for cholesterol gallstone disease, confirming the importance of taking a multigenic pathway based approach to risk assessment. The finding also indicates that the development of gallstone involves complex genetic interactions and follows different pathways depending on the specific genetic background of the subjects. The present study provided evidence supporting the cholesterol supersaturation contribution of hormonal, hepato-canalicular transporter and adipogenesis differentiation pathway genes, of which interaction betweenESR1, ADRB3 and ABCG8
genes were the most important.
Thus, our results support the concept that genetic polymor-phisms can be used as cholesterol gallstone risk predictors and multiple polymorphisms allow more precise delineation of risk groups and suggest the future direction of association studies. However, the present study included only North Indian individ-uals, therefore the results need to be replicated in other ethnic groups.
Patients and Methods
Ethics Statement
The institutional ethical committee of Sanjay Gandhi Post Graduate Institute of Medical Sciences (SGPGIMS) approved the present study protocol and the authors followed the norms of World’s Association Declaration of Helsinki. All the participants provided written informed consent.
Study Population
The case control study recruited a total of 450 subjects, including 230 cholesterol gallstone patients (GS) and 220 healthy subjects. From the year June 2006 to September 2011 symptom-atic cholesterol GS patients attending the Department of Gastro-surgery, Sanjay Gandhi Post Graduate Institute of Medical Sciences and Department of Surgical Oncology Lucknow India, were approached for participation in the present study. All subjects were unrelated and confirmed to North Indian ethnicity.
validate gallstone status and to identify silent gallstones. Inclusion criteria for controls also included absence of asthma, coronary artery disease, diabetes mellitus determined through maternal and paternal family history. At recruitment, informed consent was obtained from each subject and the information on demographic characteristics, such as sex and age was collected by questionnaire. Both patients and controls had similar ethnicity. The blood sample and the clinical details were collected from each participant at recruitment.
DNA Samples and Genotyping
Genomic DNA was isolated from peripheral blood leukocytes using salting out method [37]. The polymorphisms were genotyped using the PCR or PCR restriction fragment length polymorphism method. The details of genotyping for studied polymorphisms are shown in Table S1. Ten percent of masked, random sample of cases and controls were tested twice by different laboratory personnel and the reproducibility was 100%.
Genotype Score Calculation (G-score)
A Genotype score (G-score) was defined as the cumulative number that counts the total number of risk-increasing alleles in individuals. Genotyping of 13 selected SNPs in candidate genes involved in hormonal, hepatocanalicular and adipogenesis differ-entiation pathways was performed and G-score was computed from the number of variant alleles. A value of 2, 1 and 0 was allotted to homozygous variant, heterozygous and homozygous wild type genotypes respectively. Variant genotype was considered as risk conferring. Using these 13 SNPs a Genotype Score (G-score) was constructed ranging from 0 to 26 on the basis of the number of risk alleles. For each sample a consolidated G-score was calculated by adding the values from all 13 SNPs together.
Statistical Analysis
Descriptive statistics were presented as mean and standard deviation [SD] for continuous measures while absolute value and percentages were used for categorical measures. Differences in genotype and allele frequencies between study groups were estimated by chi-square test. Unconditional logistic regression
was used to estimate odds ratios [ORs] and their 95% confidence intervals [CIs] adjusting for age and sex. A two-tailed p-value of less than 0.05 was considered a statistical significant result. All statistical analyses were performed using SPSS software version 16.0 (SPSS, Chicago, IL, USA). Ptrend and Monte Carlo Simulation (MCS) were calculated through Cochrane Armitage trend using XLstats whereas haplotype analysis was performed using SNPstats (http://bioinfo.iconcologia.net/SNPstats).
Furthermore, higher-order gene-gene interactions associated with CGD risk were determined through multifactor dimension-ality reduction (MDR) using software version 2.0 beta8 and classification regression tree analysis (CRT) using SPSS software version 16.0.
Supporting Information
Table S1 The genes and SNPs investigated.
(DOC)
Table S2 Haplotypes association ofESR1gene (age and gender adjusted).
(DOC)
Table S3 Haplotypes analysis of ESR2 gene (age and gender adjusted).
(DOC)
Table S4 Haplotypes analysis ofSLCO1B1gene (age and
gender adjusted).
(DOC)
Table S5 Odds Ratios and 95% CI for Gallstones in Relation to Polymorphisms of Hormonal Pathway after Subdividing on the Basis of Gender.
(DOC)
Author Contributions
Conceived and designed the experiments: BM AS. Performed the experiments: AS RS RR. Analyzed the data: AS AM. Contributed reagents/materials/analysis tools: BM AS. Wrote the paper: AS AM BM NS.
References
1. Everhart JE, Khare M, Hill M, Maurer KR (1999) Prevalence and ethnic differences in gallbladder disease in the United States. Gastroenterology 117: 632–639.
2. Sandler RS, Everhart JE, Donowitz M, Adams E, Cronin K, et al. (2002) The burden of selected digestive diseases in the United States. Gastroenterology 122: 1500–1511.
3. Khuroo MS, Mahajan R, Zargar SA, Javid G, Sapru S (1989) Prevalence of biliary tract disease in India: a sonographic study in adult population in Kashmir. Gut 30: 201–205.
4. Stinton LM, Shaffer EA (2012) Epidemiology of gallbladder disease: cholelithi-asis and cancer. Gut Liver 6: 172–187.
5. Krawczyk M, Wang DQ, Portincasa P, Lammert F (2011) Dissecting the genetic heterogeneity of gallbladder stone formation. Semin Liver Dis 31: 157–172. 6. Katsika D, Grjibovski A, Einarsson C, Lammert F, Lichtenstein P, et al. (2005)
Genetic and environmental influences on symptomatic gallstone disease: a Swedish study of 43,141 twin pairs. Hepatology 41: 1138–1143.
7. Buch S, Schafmayer C, Volzke H, Seeger M, Miquel JF, et al. (2010) Loci from a genome-wide analysis of bilirubin levels are associated with gallstone risk and composition. Gastroenterology 139: 1942–1951 e1942.
8. Katsika D, Magnusson P, Krawczyk M, Grunhage F, Lichtenstein P, et al. (2010) Gallstone disease in Swedish twins: risk is associated with ABCG8 D19H genotype. J Intern Med 268: 279–285.
9. Wang HH, Portincasa P, Wang DQ (2008) Molecular pathophysiology and physical chemistry of cholesterol gallstones. Front Biosci 13: 401–423. 10. Diehl AK (1991) Epidemiology and natural history of gallstone disease.
Gastroenterol Clin North Am 20: 1–19.
11. Jensen KH, Jorgensen T (1991) Incidence of gallstones in a Danish population. Gastroenterology 100: 790–794.
12. Barbara L, Sama C, Morselli Labate AM, Taroni F, Rusticali AG, et al. (1987) A population study on the prevalence of gallstone disease: the Sirmione Study. Hepatology 7: 913–917.
13. Chen A, Huminer D (1991) The role of estrogen receptors in the development of gallstones and gallbladder cancer. Med Hypotheses 36: 259–260.
14. Yoshihara R, Utsunomiya K, Gojo A, Ishizawa S, Kanazawa Y, et al. (2009) Association of polymorphism of estrogen receptor-alpha gene with circulating levels of adiponectin in postmenopausal women with type 2 diabetes. J Atheroscler Thromb 16: 250–255.
15. McLean RC, Hirsch GA, Becker LC, Kasch-Semenza L, Gerstenblith G, et al. (2011) Polymorphisms of the beta adrenergic receptor predict left ventricular remodeling following acute myocardial infarction. Cardiovasc Drugs Ther 25: 251–258.
16. Park SK, Andreotti G, Sakoda LC, Gao YT, Rashid A, et al. (2009) Variants in hormone-related genes and the risk of biliary tract cancers and stones: a population-based study in China. Carcinogenesis 30: 606–614.
17. Srivastava A, Sharma KL, Srivastava N, Misra S, Mittal B (2012) Significant role of estrogen and progesterone receptor sequence variants in gallbladder cancer predisposition: a multi-analytical strategy. PLoS One 7: e40162.
18. Srivastava A, Srivastava N, Choudhuri G, Mittal B (2011) Organic anion transporter 1B1 (SLCO1B1) polymorphism and gallstone formation: High incidence of Exon4 CA genotype in female patients in North India. Hepatol Res 41: 71–78.
19. Srivastava A, Srivastava K, Choudhuri G, Mittal B (2010) Role of ABCG8 D19H (rs11887534) variant in gallstone susceptibility in northern India. J Gastroenterol Hepatol 25: 1758–1762.
21. Lunetta KL, Hayward LB, Segal J, Van Eerdewegh P (2004) Screening large-scale association study data: exploiting interactions using random forests. BMC Genet 5: 32.
22. Liu X, Li Y, Lu X, Wang L, Zhao Q, et al. (2010) Interactions among genetic variants from SREBP2 activating-related pathway on risk of coronary heart disease in Chinese Han population. Atherosclerosis 208: 421–426.
23. de Luis DA, Aller R, Izaola O, Gonzalez Sagrado M, Conde R, et al. (2012) Interaction of -55CT polymorphism of UCP3 gene with Trp64Arg polymor-phism of beta3adrenoreceptor gene on insulin resistance in obese patients. Eur Rev Med Pharmacol Sci 16: 610–616.
24. Baturin AK, Pogozheva AV, Sorokina E, Makurina ON, Tutel’ian VA (2012) [The Trp64Arg polymorphism of beta3-adrenoreceptor gene study in persons with overweight and obesity]. Vopr Pitan 81: 23–27.
25. Meigs JB, Shrader P, Sullivan LM, McAteer JB, Fox CS, et al. (2008) Genotype score in addition to common risk factors for prediction of type 2 diabetes. N Engl J Med 359: 2208–2219.
26. Kathiresan S, Melander O, Anevski D, Guiducci C, Burtt NP, et al. (2008) Polymorphisms associated with cholesterol and risk of cardiovascular events. N Engl J Med 358: 1240–1249.
27. Alvaro D, Alpini G, Onori P, Perego L, Svegliata Baroni G, et al. (2000) Estrogens stimulate proliferation of intrahepatic biliary epithelium in rats. Gastroenterology 119: 1681–1691.
28. Alvaro D, Alpini G, Onori P, Franchitto A, Glaser SS, et al. (2002) Alfa and beta estrogen receptors and the biliary tree. Mol Cell Endocrinol 193: 105–108. 29. Fumino S, Iwai N, Deguchi E, Kimura O, Ono S, et al. (2005) Estrogen receptor
expression in anomalous arrangement of the pancreaticobiliary duct. J Pediatr Surg 40: 1716–1720.
30. Anthony A, Schepelmann S, Guillaume JL, Strosberg AD, Dhillon AP, et al. (1998) Localization of the beta(beta)3-adrenoceptor in the human gastrointes-tinal tract: an immunohistochemical study. Aliment Pharmacol Ther 12: 519– 525.
31. Kimura K, Sasaki N, Asano A, Mizukami J, Kayahashi S, et al. (2000) Mutated human adrenergic receptor (Trp64Arg) lowers the response to beta3-adrenergic agonists in transfected 3T3-L1 preadipocytes. Horm Metab Res 32: 91–96.
32. De Ponti F, Gibelli G, Crema F, Lecchini S (1995) Functional evidence for the presence of beta 3-adrenoceptors in the guinea pig common bile duct and colon. Pharmacology 51: 288–297.
33. Buch S, Schafmayer C, Volzke H, Becker C, Franke A, et al. (2007) A genome-wide association scan identifies the hepatic cholesterol transporter ABCG8 as a susceptibility factor for human gallstone disease. Nat Genet 39: 995–999. 34. Xu HL, Cheng JR, Andreotti G, Gao YT, Rashid A, et al. (2011) Cholesterol
metabolism gene polymorphisms and the risk of biliary tract cancers and stones: a population-based case-control study in Shanghai, China. Carcinogenesis 32: 58–62.
35. Siddapuram SP, Mahurkar S, Duvvuru NR, Mitnala S, Guduru VR, et al. (2010) Hepatic cholesterol transporter ABCG8 polymorphisms in gallstone disease in an Indian population. J Gastroenterol Hepatol 25: 1093–1098. 36. MacDonald FR, Cooperberg PL, Cohen MM (1981) The WES triad – a specific
sonographic sign of gallstones in the contracted gallbladder. Gastrointest Radiol 6: 39–41.