COMPARATIVE STUDY ON THE VOCAL PROFILE
OF PROFESSIONAL THEATER ACTORS
AND STUDENT ACTORS
Estudo comparativo do perfil vocal de atores de teatro profissionais
e atores em fase de formação acadêmica
Priscila Esteves Spagnol(1), Mauriceia Cassol(1)
vocalizations through extreme physical strain or sudden emotional explosions, such as screams, hiccups, and grunts3. In order to have a luent,
efortless vocal emission, actors must know their vocal skills4. The ability to maintain voice quality
throughout their careers5, as well as discovering and
mastering their vocal potential, requires learning techniques to use breathing, voice, articulation, rhythm, and projection, among other skills1. Voice
workers must be more attentive to and careful with their voices and to continuously monitor their voices since it is a tool of their trade. They must realize that good vocal production depends on the correct association between gift and technique6, which can
be achieved with the aid of a speech pathologist not only for improving the voice, but also to prevent voice changes. In order for the guidance to be more
INTRODUCTION
In the century of technology, communication has increasingly more value in reproducing feelings and facing situations. Dramaturgy seeks to stir in the audience a range of feelings, beliefs, and relec
-tions, however, for this phenomenon to take place,
actors need to achieve the best their voices have to
ofer (shades, nuances, voracity, softness) just as a virtuoso keenly plays his or her instrument1.
The need for increasing volume, changing
pitch, and extending the frequency range beyond
the typical conversation indicates that actors require eicient vocal performance2. Actors, both
in rehearsal and during the show, commonly face emotionally challenging behaviors, often producing
ABSTRACT
Purpose: to compare the vocal proile of professional theater actors and of student actors to check
if there are diferences between their voice use patterns. Methods: the sample consisted of 25
professional actors and 25 student actors. The study was carried out by recording and analyzing the subjects’ voices, using the GRBASI scale (auditory-perceptual analysis) and the software Dr. Speech (acoustic analysis). The computerized analysis assessed fundamental voice frequency, jitter, shimmer,
and neutralized noise energy. A questionnaire was applied to measure aspects related to vocal self-image. Results: in the auditory-perceptual analysis, a statistically signiicant diference was found
between the groups regarding roughness (p=0,006) and strain (p=0,02), while the acoustic analysis showed no diference between the groups. The vocal self-image report, in both groups, highlighted the perception of being of-key. Conclusion: when comparing the groups, vocal changes were more
common in professional actors, which suggests this groups experiences vocal overload, which is a warning for the need for developing voice training for actors.
This recording consisted of the emission of sustained vowels, of counting from 1 to 10, and of a report by the subject about his or her voice. After the recording, participants answered a question
-naire to measure aspects related to their vocal self-image14 this was requested that the participant
assigned a score of one to ten to its voice and that marked with an “x” the chosen of eight pairs of descriptive voice, where each pair was composed of two opposites adjectives options terms, denoting a positive or negative opinion about the voice. A speech pathologist specialized in voice and blinded to the sample carried out the auditory-perceptual evaluation (all voice recordings were mingled for the auditory analysis and 10% of the sample were presented again to the evaluator for data reliability). The GRBASI15 scale protocol was used to classify
the voices, where G means the Grade of change; R means Roughness; B means Breathiness; A means Asthenia; S means Strain, and I means Instability. The 4-point GRBASI score was used (0 – normal or absent, 1 – slight, 2 – moderate, and 3 – severe). The sustained vowel “ɛ” (as in “head”) was used for acoustic analysis performed with Dr. Speech
3.0 by Tiger DRS. The parameters jitter, shimmer, neutralized noise energy (NNE), and fundamental frequency (F0) were assessed.
The analyses followed a quantitative and descriptive approach using the SPSS 19.0 for the statistical analysis. For the auditory-perceptual and vocal self-image data analyses, the Chi-squared test was applied. and, when needed, Yates’s correction or Fisher’s Exact test. Student’s t-tests for independent samples were used for comparisons of acoustic measures, after controlling for normal distribution using Kolmogorov-Smirnov test . The statistical signiicance level used was 5% (p= 0.05 or less). Data were tabbed and presented in tables.
RESULTS
Descriptive statistics are presented in Table 1. Of the 50 subjects assessed, 25 (50%) were males and 25 (50%) were females and their ages ranged from 18 to 43 years. In the auditory-perceptual analysis, 13 subjects (26%) had a slight global change in the GRBASI scale. Regarding their vocal character
-istics, strain (S) was the most common vocal quality (n=12) followed by roughness (n=11), as shown in
Table 2.
precisely evaluate vocal quality, with great interest on researching the relationship among self-assessment scales, perception evaluations, and acoustic parameters8. Auditory-perceptual assessment is
considered the gold standard of speech evaluation regarding the voice, whether professional or not, since it enables analysis through hearing vocal quality, variations in pitch, and emphasis resources, among other vocal aspects9,10. Having become a
sizeable aspect in voice assessment over the last decades, computerized acoustic analysis aims to complement auditory-perceptual analysis with more objective data11 by using the acoustic signal
collected by non-invasive tools and analyzing vocal quality quantitatively. In the 9,10 literature, the most
commonly mentioned advantage of using voice analysis software is obtaining standardized data for diferent vocal realities, be them cultural, profes
-sional, or pathological12.
Knowing the perceptual and acoustic diferences between the voices of professional and student stage actors may contribute to a change in focus in both vocal assessment and training, besides providing a customized and eicient vocal program9,13. With
the above in mind, this research aimed to compare the vocal proile of professional and student theater actors to determine if there are diferences in their voice use patterns.
METHODS
This cross-sectional, exploratory quantitative study was approved by the Research Ethics Committee of the Federal University of Healthcare Sciences of Porto Alegre (UFCSPA) under protocol 983/12, and was carried out in the university’s voice laboratory. The participant sample was derived from several theater groups and performing art students. A labor certiicate was the criterion used to consider an actor professional. An experimental group comprising 25 professional theater actors and a control group with 25 student actors were assessed. The only inclusion criterion was the subject being a theater actor – professional or in training. All subjects signed a term of free and informed consent.
First, participants’ voices were recorded using a Sony digital audio recorder coupled to a profes
-sional Shure microphone in a stand. The micro
Table 1 – Descriptive statistics of the studied sample (age, gender and years of experience)
Variables Total Actors p-value
Professionals Students
Age, mean (standart deviation) 23,4 (5,7)
Male 24,0 (6,4) 26,4 (6,7) 19,6 (2,2) 0,007*
Female 22,9 (4,9) 27,3 (3,6) 20,4 (3,5) 0,000*
Gender, n (%) Male
Female
25 (50) 25 (50
16 (64) 9 (36)
9 (36) 16 (64)
0,090
Performance time, n (%) 0,007*
1-3 years 14 (29,2) 6 (26,1) 8 (32,0)
4-6 years 16 (33,3) 4 (17,4) 12 (48,0)**
7-10 years 11 (22,9) 6 (26,1) 5 (20,0)
11 ou + years 7 (14,6) 7 (30,4)** 0 (0,0) Used tests: Age – Chi-squared test and, when needed, Yates’s correction or Fisher’s Exact test; Gender and performance time – T test for independent samples.
* Signiicant association among the variables.
** Analysis of the adjusted standardized residues; associated cells.
Table 2 – Comparison of the GRBASI scale between professional actors and student actors
Variables Total Actors p-value
Professionals Students
Global, n (%) 0,053
Normal or absent 37 (74,0) 15 (60,0) 22 (88,0)
Discreet 13 (26,0) 10 (40,0) 3 (12,0)
Rough, n (%) 0,006*
Normal or absent 39 (78,0) 15 (60,0) 24 (96,0)**
Discreet 11 (22,0) 10 (40,0)** 1 (4,0)
Breath, n (%) 0,609
Normal or absent 46 (92,0) 24 (96,0) 22 (88,0)
Discreet 4 (8,0) 1 (4,0) 3 (12,0)
Asteny, n (%)
Normal or absent 50 (100,0) 25 (100,0) 25 (100,0)
Strain, n (%) 0,020*
Normal or absent 38 (76,0) 15 (60,0) 23 (92,0)**
Discreet 12 (24,0) 10 (40,0)** 2 (8,0)
Instabilidade, n (%) 1,000
Normal or absent 48 (96,0) 24 (96,0) 24 (96,0)
Discreet 2 (4,0) 1 (4,0) 1 (4,0) Chi-squared test and, when needed, Yates’s correction or Fisher’s Exact test.
* Signiicant association among the variables.
The acoustic analysis is presented in Table 3, which shows that the shimmer values found for males are over the limit.
Table 4 shows the answers to the vocal self-image questionnaire.
Table 3 – Comparison of Fundamental Frequency, Jitter, Shimmer and Normalized Noise Energy between professional actors and student actors
Variables Total Actors p-value
Professionals Students
Fundamental frequency, mean (SD) 168,8 (54,9)
Male 123,3 (20,2) 122,0 (24,0) 125,7 (11,5) 0,669
Female 214,3 (37,8) 191,1 (40,5) 227,3 (30,2) 0,018*
Jitter, mean (SD) 0,2 (0,1)
Male 0,2 (0,1) 0,2 (0,1) 0,2 (0,0) 0,797
Female 0,2 (0,1) 0,2 (0,0) 0,2 (0,1) 0,653
Shimmer, mean (SD) 3,2 (1,4)
Male 3,6 (1,7) 3,8 (2,0) 3,2 (0,9) 0,422
Female 2,9 (1,1) 2,9 (1,0) 2,9 (1,1) 0,929
NNE, mean (SD) -12,6 (3,5)
Male -12,0 (3,6) -11,1 (3,3) -13,4 (3,8) 0,132
Female -13,2 (3,2) -13,5 (3,3) -143,0 (3,3) 0,684 T test for independent samples.
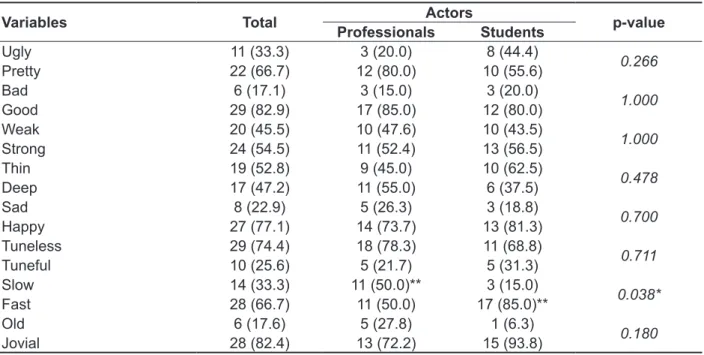
Table 4 – Comparison of vocal self-image between professional actors and student actors
Variables Total Actors p-value
Professionals Students
Ugly 11 (33.3) 3 (20.0) 8 (44.4)
0.266
Pretty 22 (66.7) 12 (80.0) 10 (55.6)
Bad 6 (17.1) 3 (15.0) 3 (20.0)
1.000
Good 29 (82.9) 17 (85.0) 12 (80.0)
Weak 20 (45.5) 10 (47.6) 10 (43.5)
1.000
Strong 24 (54.5) 11 (52.4) 13 (56.5)
Thin 19 (52.8) 9 (45.0) 10 (62.5)
0.478
Deep 17 (47.2) 11 (55.0) 6 (37.5)
Sad 8 (22.9) 5 (26.3) 3 (18.8)
0.700
Happy 27 (77.1) 14 (73.7) 13 (81.3)
Tuneless 29 (74.4) 18 (78.3) 11 (68.8)
0.711
Tuneful 10 (25.6) 5 (21.7) 5 (31.3)
Slow 14 (33.3) 11 (50.0)** 3 (15.0)
0.038*
Fast 28 (66.7) 11 (50.0) 17 (85.0)**
Old 6 (17.6) 5 (27.8) 1 (6.3)
0.180
Jovial 28 (82.4) 13 (72.2) 15 (93.8)
Chi-squared test and, when needed, Yates’s correction or Fisher’s Exact test. * Signiicant association among the variables.
The NNE results both for males (-12 dB) and females (-13.2 dB) were below those found in another study12, but also matched the normal values
suggested by the makers of Dr. Speech, i.e., equal
to or below -10 dB 12.
No signiicant diference was found between the research groups for any of the acoustic analysis variables. The results are comparable to those by Kovacic and Budanovac 22 and Awan23, who
also found no diference in acoustic parameters. However, the subjects of those studies were not taken from the same population, so the results must be compared with caution. It should be pointed out that the acoustic analysis does not prevail over the auditory-perceptual evaluation, but rather comple
-ments it.
The vocal self-image report has been used both in clinical practice and in research since it is able to capture the patients’ perception regarding
their voices24. In the present study, a statistically
signiicant diference was found between the groups regarding slow or fast speech, with the former mentioned more often by professional actors and the latter, by student actors, which can be seen in Table 4. It can be said that, save for obvious exceptions, the essence of voicing for an actor is in “saying the text”25, hence the professional actor is aware that
a fast speech makes it harder for the audience to understand the performance.
Individuals carrying characteristics such as muscle strain, inappropriate vocal range, lack of respiratory coordination, inappropriate use of the vocal register, or imprecise articulation tend to have
tuneless voice26, one of the items that stood out in
the vocal self-image questionnaire particularly by the professional actors. The results indicate the need for including speech pathology into the theater practice since voice tuning can be improved through speciic techniques and exercises.
CONCLUSION
Regarding the values of the GRBASI scale, it
can be seen that the variables roughness and strain
in the perceptual-auditory analysis are signiicantly more prevalent among the professional actors than in the group of students, which shows vocal overload among the former.
The values of Fundamental Frequency, Jitter, Shimmer, and Glottal Noise Energy both among the student actors and the professional ones were within the normal range, except for shimmer among
DISCUSSION
The results of the present study showed difer
-ences in the parameters assessed when profes
-sional actors were compared to student actors (Table 2) . The auditory-perceptual evaluation showed a greater change in the professional actors, statisti
-cally signiicantly so when roughness and strain are considered. That shows that the longer an actor’s or actress’s career, the more he or she will have abused their voice by using it professionally, thus tending to have some change compared to student actors. These indings match the literature in stating that actors are led to overwork during their careers, which indicates a major vocal overload and lower vocal change prevalence in the student population, who perform as amateurs and have shorter times as stage performers16,17. As the present research
shows, being a professional actor is associated with 11+ years performing, while being an amateur actor is associated with performing for 4-6 years.
The computerized acoustic analysis used in this study is in accordance with the current voice research philosophy to seek objective proof, thus contributing to data standardization for diferent vocal realities. Given the broad range of software and acoustic variables employed in research, the data could not be compared with other studies on actors. Therefore, the values found (Table 3) in the present study were compared to Brazilian Portuguese speakers.
The mean F0 result for males was similar to what is found in the literature, which ranged from 113.01 Hz to 127.61 Hz 12,18,19. The average of
this same parameter for females also matched the results in the literature, in which the mean F0 ranged from 205.21 Hz to 215.42 Hz 12,18,19. The
signiicant diference in mean values for F0 between genders was already expected since it is inluenced by the length of the vocal folds, which is longer in males8,18,19.
The mean jitter for both genders was 0.2%, below the value found in the literature12,19,20, which
is inferred to be due to the stability actors have
over their voices since jitter changes mainly due to
the lack of control over vocal fold vibration. Taking into account the values considered normal by the makers of Dr. Speech, i.e., equal to or below
0.5% 21, the result found is within the normal range.
in the literature regarding auditory-perceptual analysis and vocal self-image of stage actors.
Although the sample size is admittedly limited, these initial results call attention to an important population to be worked on since the repercussions of these vocal aspects impact both their work and their quality of life.
regarding slow and fast voice, the former being more reported by professional actors and the latter, by student actors, with tuneless voice standing out in both groups.
Thus, the present study contributes to the knowledge in the overlapping between speech pathology and theater since few studies are available
REFERENCES
1. Oliveira DSF. Voz na Arte: uma contribuição para o estudo da voz falada no teatro. In: Guberfain JC (organizadora). Voz em Cena. Volume 1. Rio de janeiro, Revinter; 2004. p. 1-19
2. Pinczower R, Oates J. Vocal projection in actors: the longterm average spectral features that distinguish comfortable acting voice from voicing with maximal projection in male actors. J Voice.
2005;19:440-53.
3. Roy N, Ryker K, Bless D. Vocal violence in actors: an investigation into its acoustic consequences and the efects of hygienic laryngeal release training. J
Voice. 2000;14:215.
4. Oliveira DSF. A voz e o teatro. In: Valle MGM. Voz: diversos enfoques em fonoaudiologia. Rio de Janeiro, Revinter; 2002. p. 41-58.
5. Walzak P, McCabe P, Madill C, Sheard C: Acoustic changes in student actors’ voices after 12 months of
training. J Voice. 2008;22(3):300-13.
6. Miranda ICC, Ladeira AC, Gouvêia VL, Costa
VR: Auto-análise vocal de alunos do curso de teatro.
Distúrb Comum.2012;24(3):369-78.
7. Aydos B, Hanayama EM. Técnicas de aquecimento vocal utilizadas por professores de
teatro. Rev CEFAC. 2004;6(1):83-8.
8. Cho SW, Yin CS, Park Y-B, Park Y-J. Diferences in self-rated, perceived, and acoustic voice qualities between high- and low-fatigue groups. J Voice.
2011;25(5):544-52.
9. Master S. Análise acústica e perceptivo-auditiva da voz de atores e não atores masculinos: long term
average spectrum e o “formante do ator” [tese]. São
Paulo (SP): UNIFESP; 2005.
10. Ditscheiner ES, Constantini AC, Mourão LF, Ferreira LP: Análise perceptiva e acústica da dublagem de diferentes personagens e atores: estudo de caso. Distúrb Comun. 2012;24(3):395-406. 11. Smits I, Ceuppens P, De Bodt MS: A comparative study of acoustic voice measurements by means of Dr. Speech and Computerized Speech Lab. J Voice.
2005;19:187-96.
RESUMO
Objetivo: comparar o peril vocal de atores de teatro proissionais e de atores em fase de formação
acadêmica para veriicar se existem diferenças entre o padrão de uso de voz. Métodos: a amostra
consistiu de 25 atores proissionais e de 25 atores em fase de formação acadêmica. O estudo foi realizado por meio do registro e análise de vozes dos participantes, utilizando-se a escala GRBASI (análise percepto-auditiva) e o software Dr. Speech (análise acústica). Com relação à análise acús
-tica, foram analisadas as seguintes variáveis: frequência fundamental, Jitter, Shimmer e energia de
ruído glótico. Aplicou-se um questionário para mensurar aspectos relacionados à autoimagem vocal.
Resultados: na análise perceptivo-auditiva, houve diferença estatisticamente signiicante entre gru
-pos nas variáveis rugosidade (p=0,006) e tensão (p=0,02). A análise acústica não demonstrou dife
-renças entre os grupos. Quanto à autoimagem vocal, um item que se destacou em ambos os grupos foi desainação. Conclusão: levando em consideração a comparação realizada entre os grupos estu
-dados, a frequência das alterações vocais foi mais encontrada nos atores proissionais, o que nos aponta para uma sobrecarga vocal nesse grupo, alertando para a necessidade do desenvolvimento de um trabalho de preparação vocal do ator.
19. Araujo SA, Grellet M, Pereira JC. Normatização de medidas acústicas da voz normal. Rev Bras Otorrinolaringol. 2002;68(4):540-4.
20. Spinelli ICP, Behlau M. Estudo comparativo das medidas de frequência fundamental, jitter e shimmer em diferentes sistemas de análise vocal. In: Behlau M. A voz do especialista. vol.1. Rio de Janeiro, Revinter, 2001. p. 265-71.
21. Huang D, Lin S, O´Brien R. User´s guid of Dr. Speech for windows. Version 3.0. Seattle – EUA,
Tiger Eletronics, 2000.
22. Kovacic G, Budanovac A. Acoustic characteristic of adolescent actors’ voices and non-actors’ voices. Folia Phoniatr Logop. 2000;54:125–32.
23. Awan SN. Superimpositon of speaking voice characteristics and phonetograms in untrained and trained vocal groups. J Voice. 1993;7:30-7.
24. Bicalho AD, Behlau M, Oliveira G. Termos descritivos da própria voz: comparação entre respostas apresentadas por fonoaudiólogos e não-fonoaudiólogos. Rev CEFAC.
2010;12(4):543-50.
25. Belo S. A voz na criação cénica – relexões
sobre a vocalidade do actor.
European review of artistic studies. 2011;2(1):17- 44. 26. Sobreira S. Desainação Vocal. Rio de Janeiro, Musimed, 2ª ed, 2003.
12. Siqueira MA, Moraes ZR: Estudo dos valores referencias para as principais variáveis do programa
Doctor Speech em falantes adultos do sul do Brasil.
Rev Soc Bras Fonoaudiol. 2005;10(3):139-46.
13. Barrichelo-Lindstro¨m V, Behlau M. Resonant voice in acting students: perceptual and acoustic correlates of the trained y-buzz by lessac. J Voice.
2009;23(5):603-9.
14. Cassol M, Reppold CT, Ferrão Y, Gurgel LG, Almada CP. Análise de características vocais e de aspectos psicológicos em indivíduos com transtorno obsessivo-compulsivo. Rev. soc. bras. Fonoaudiol.
2010;15(4):491-6.
15. Hirano M. Psycho-acoustic evaluation of voice: GRBAS Scale for evaluating the hoarse voice. Clinical Examination of voice. Springer Verlag, 1981.
16. Navas DM. A voz no teatro. In: Pinho SMR.
Temas em voz proissional. Rio de Janeiro, Revinter, 2007. p. 103-9.
17. Brito MS. Abordagem fonoaudiológica nas escolas de teatro privadas e públicas. Fonoaudiol
Bras. 2000;3(3):8-14.
18. Behlau MS, Tosi O. Determinação da frequência fundamental e suas variações em altura (“jitter”) e intensidade (“shimmer”) para falantes do português brasileiro. Acta AWHO. 1985;4(1):5-10.
Received on: December 19, 2014 Accepted on: April 01, 2015 Mailing address: