Abstract
Introduction: In terms of epidemiologic transition, century-long trend studies may act as subsidies for health management hypotheses.
Objective: Identify mortality rate pattern for Diseases of the Circulatory System (DCS) in Ribeirão Preto, SP (RP-SP), in the period between 1980 and 2004.
Methods: The number of deaths due to DCS were obtained from the Mortality Information System (SIM). Populational estimates for RP-SP – taking gender, age group, and calendar years into account – were obtained from the Brazilian Institute of Geography and Statistics (IBGE). Specific mortality rates were calculated on yearly basis according to gender and age group in 10-year intervals starting at 30 years of age. The trend analysis was conducted through polynomial regression models for time series. Significance level was ≤ 0.05.
Results: Specific mortality rates due to DCS increased with age both among males and females, being higher among males in the 40 to 49-year-old range. After that, figures were comparable, although at 80-year-old age groups data for females showed to be higher than that for males in some years of the series. Along the study period, significant reduction was observed for mortality rates among both males and females, and for all age ranges from those causes (p<0.001).
Conclusions: Mortality rate pattern due to DCS in RP-SP was similar to that found in developed areas, which helped formulate hypotheses on the likely protection factors that may explain the observed decline. (Arq Bras Cardiol 2009; 93(6):589-596)
Key Words: Diseases of the circulatory system/ epidemiology, time series study, mortality information system.
Mailing address: Suzana Alves de Moraes •
Av. Santa Luzia, 440/81 - 14025-090 - Jd. Sumaré - Ribeirão Preto, SP – Brazil
E-mail: [email protected]
Manuscript received June 13, 2008; revised manuscript received December 15, 2008; accepted March 19, 2008
Mortality Rates Due to Diseases of the Circulatory System (DCS) in
Ribeirão Preto - SP, from 1980 to 2004
Suzana Alves de Moraes, Cláudio Shigueki Suzuki, Isabel Cristina Martins de Freitas, Moacyr Lobo da Costa Júnior
Universidade de São Paulo-Escola de Enfermagem de Ribeirão Preto-USP, Rtibeirão Preto, SP – Brazil
Brazil is a limiting component for the formulation of ecologic hypotheses to explain the decline.
In a continental size country as Brazil, regional differences in goods and services distribution as well as health promotion programs interfere in that dynamics. Therefore, not all regions go through the 4th stage of the Epidemiologic Transition9 – when the most marked characteristic is the mortality rates decline due to DCS.
In a study conducted by Souza et al.10 in the period between 1979 and 1996, the authors observed that mortality rates due to DCS showed different trends in the five geographic macro-regions in Brazil. Results pointed towards a decline trend as of 30 years of age in the Southern, Southeastern and Northern Regions, although the opposite trend was observed for the Northeastern and Central-Western Regions.
Having taken into account the regional differences in Brazil, the present study had the objective of identifying mortality trends due to DCS in Ribeirão Preto, SP, based on the time series corresponding to the time period between 1980 and 2004.
Materials and methods
Study Design -The study followed a time series ecological design11, and covered the period between 1980 and 2004.
Introduction
Diseases of the Circulatory System (DCS) have shown to be one of the major causes of death, both in developed and in developing countries. Epidemiological studies that have been conducted in recent decades have reported a reduction in the mortality trend from DCS. In developed countries such as the United States, Canada and Western Europe, mortality rate due to DCS started declining as of late 1960’s. Along the 1980’s annual reduction average of the condition was approximately 3.5% in the United States1,2.
Data Source -The number of deaths from DCS as primary cause, by gender, age, and calendar year were obtained from the Mortality Information System at the Ministry of Health12. For the deaths that occurred between 1980 and 1995 the codes used were those in ICD-9, Chapter 713. For those that occurred between 1996 and 2004, ICD-10, Chapter 914.
Populational estimates for RP-SP based on gender and age groups for the period between 1980 and 2004 were obtained from IBGE demographic censuses.
Specific mortality rates were calculated on yearly basis according to gender and age group in 10-year intervals starting at 30 years of age: (30 to 39; 40 to 49; 50 to 59; 60 to 69; 70 to 79 and 80 and older). Mortality rates were obtained by dividing the number of deaths from DCS in each calendar year by corresponding population on July 1st. Results were presented based on the ratio per 10,000 inhabitants. Information on non-defined causes of death in RP-SP in the study period were obtained from the Mortality Information System at the Ministry of Health12. Proportional mortality was calculated for every calendar year.
Trend Analysis - At a first time and in order to reduce the serial correlation between regression equation terms, the variable “year” was centralized taking in account the mean point in the time series. Therefore, for the period between 1980 and 2004, the term (X-1992) stands for the centralized variable. As a result, the linear model is read as: YT = β0 + β1 (X – 1992), where YT= mortality coefficient; β0= mean coefficient for the time period; β1= mean yearly increment; X=calendar year.
To smoothen the time series – due to point oscillation from the small number of cases at certain populational groups – the white noise was reduced by calculating the 3-and-5-term moving average15. In that process, for the 3-term moving average, the annual smoothed coefficient i (Yai) corresponded to the arithmetic average of previous year coefficients (i-1), current year, (i) and following year (i+1): Yai = Yi-1 + Yi + Yi + 1
3
,
and for the 5-term average the smoothed coefficient was read as: Yai = Yi-2 + Yi-1 + Yi+ Yi+1 + Yi + 2
5
.
DCS mortality rates by calendar year scatter plots were generated using STATA 8.2 software, so as to identify the function that would best adapt to process development for males and females, and for age groups. Compliance to the normal distribution of those mortality rates was tested by a STATA 8.2 specific commands.
The trend study was conducted using polynomial regression models for time series16, with dependent variable being represented by mortality rates due to DCS (Y), with 5-term moving average, and independent variable by centralized year (X). Due to their easier formulation and interpretation of results, the trend study was conducted by using regression models in order to identify the regression equation that would best describe the relationship between dependent (Y) and independent (X) variables. Significance level was defined as α = 0.05.
Linear regression was the technique used for modeling using STATA 8.2 software, starting by the lower order model (Y=β0+β1X), followed by more complex models, such as the second order models (Y=β0+β1X+ β2X2), and third order models (Y=β0+β1X+ β2X2+ β
3X
3). Those three stages were
originally generated for each age group and gender. The total number of models was 36.
The choice for the best model was based on the following: scatter plots analysis; “p” values for F statistics; adjusted coefficient of determination (Ra2), and residual analysis that should present normal distribution and constant variance (homocedasticity)15,16. Based on that, whenever possible the choice was made for lower order models.
Percentual calculation of annual reduction average (% ARA) was obtained through the following expression: %ARA=
xi
0
)
(
x100.Results
Table 1 shows mortality rates along the 25 years of the series according to gender and age group. Specific mortality rates due to DCS increased with age both among males and females, being higher among males when compared to females as late as the 70 to 79-year-old range. In 80 years-old and older range some of the cases showed higher magnitude of mortality rates among females when compared to males.
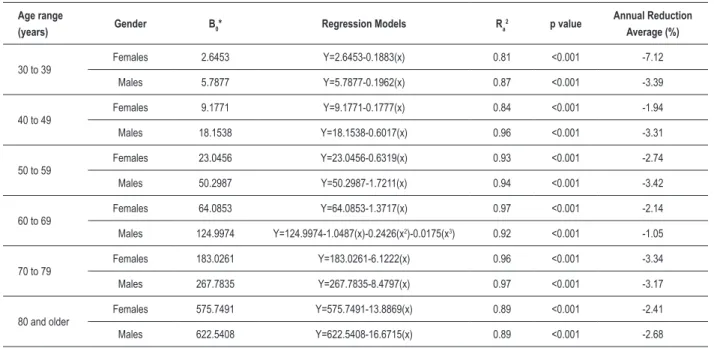
Table 2 shows regression models for estimated mortality rates coefficients from DCS (Y) in the series under study, with gender and age groups having been taken into account. For all age groups and both males and females, the models that best adjusted to the data were those of first order, except in the 60 to 69-year-old range (males), where the best adjustment was reached in a third order model. Those models presented statistic significance (“p” values for F statistic <0.001) and high magnitude for adjusted determination coefficients (Ra2) oscillating between 0.81 and 0.97. Residual analysis for all models that were chosen has shown no homocedasticity violation. Angular coefficients presented negative values both for males and females and for all age ranges, thus showing DCS mortality rates decline along the time period. Table 2 also shows the annual proportional average reduction that was higher in the 30 to 39-year-old range among females.
With the purpose to standardize the ordinates axis scales, estimated values for mortality rates due to DCS in all age groups as well as in the study series were changed to natural logarithms (Graph 1). Significant decline trends for mortality rates due to DCS could be observed both among males and females, and in all age ranges (p<0.01). In the 60 to 69-year-old range (males) a slight decline was observed early in the series, followed by rates stability period up to 1999, when a new decline- then more marked - was reported. As of the 40 to 49-year-old range, estimated mortality rates showed to be closer in magnitude, among males and females along the study time period.
Proportional Mortality from non-defined causes of death (Graph 2) presented some oscillation between 0 and 5.9%, with highest peaks early in the series in the 30 to 39, 40 to 49 and 80 and older age ranges.
Discussion
for practically all age ranges. As age advanced, rates were more even. In the 80 years-old and older some of the cases showed higher magnitude of mortality rates among females when compared to males. In the Northern Brazilian Region and in Pará State, Souza et al.10 and Mansur et al.17, respectively, have reported similar results with higher mortality rates among females when compared to males as of 70 years of age and from then on.
The decline of mortality rates due to DCS in RP-SP in the period under study followed a trend that was similar to that observed in the 1960’s in countries as the United States,
Canada and Australia, and in the 1970’s in Western European countries18.
Studies conducted in Brazil have shown a trend towards a decline in DCS mortality rates, although varying, according to gender, age group, and especially regional development level. While comparing the 5 Brazilian macro regions in the period between 1980 and 1999, Mansur et al.17 and Oliveira et al.19 reported that the most developed regions also presented DCS mortality rate decline, with Southern and Southeastern Regions in a more marked fashion. The Northern Region showed a stability trend, with some age groups reporting Table 1 – Mortality Rates from diseases of the circulatory system (10,000 inhabitants), according to gender and age range. Ribeirão Preto, SP – 1980 to 2004
Age
(years) Gender 1980 1981 1982 1983 1984 1985 1986 1987 1988 1989 1990 1991 1992
30 to 39 M 8.3 7.4 7.0 9.1 6.3 7.1 7.5 7.9 8.5 5.4 7.6 5.6 4.1
F 3.6 6.4 6.5 3.4 4.7 5.2 4.9 3.2 3.9 3.8 4.5 1.9 3.7
40 to 49 M 22.6 29.7 23.9 20.8 24.9 20.4 25.8 26.4 24.7 21.2 17.1 19.2 18.4
F 13.5 12.5 10.3 7.8 8.0 15.0 13.0 9.9 7.0 12.7 9.9 9.9 9.0
50 to 59 M 64.2 69.6 64.9 69.2 64.8 65.2 83.7 66.6 55.9 61.9 53.2 52.5 44.7
F 26.7 32.9 24.1 29.1 35.1 24.4 28.9 28.6 34.0 18.0 32.2 25.0 23.9
60 to 69 M 149.3 138.9 126.5 132.6 115.2 134.6 137.3 120.9 120.8 140.6 126.0 114.7 108.7
F 78.0 87.0 69.8 98.4 63.3 84.7 82.1 70.5 64.3 64.6 76.6 63.4 68.1
70 to 79 M 413.1 361.0 333.1 366.0 390.9 356.9 336.1 332.0 321.1 280.4 313.4 258.8 238.2
F 321.6 338.6 250.0 268.1 210.6 230.9 251.3 189.3 240.1 187.1 229.8 186.2 167.4
80 or more M 1079.7 749.4 884.4 905.3 776.0 773.5 771.9 680.9 700.9 697.8 759.4 466.2 571.6
F 934.5 871.0 674.6 688.7 812.2 618.9 672.0 683.6 755.9 608.3 544.1 510.2 511.5
Age
(years) Gender 1993 1994 1995 1996 1997 1998 1999 2000 2001 2002 2003 2004
30 to 39 M 9.1 6.2 7.2 4.2 6.3 5.7 3.8 2.9 5.9 2.5 3.3 3.7
F 2.6 0.8 0.8 1.5 2.0 2.2 1.5 1.7 1.9 2.8 2.5 2.3
40 to 49 M 19.8 22.0 15.1 13.2 18.4 15.3 19.1 11.3 16.0 10.4 13.5 11.9
F 11.2 6.5 12.0 7.3 9.8 8.4 9.0 6.4 7.4 7.6 7.5 7.9
50 to 59 M 55.2 48.3 45.7 46.4 39.9 57.2 48.1 28.7 35.5 36.5 39.8 46.8
F 20.4 26.0 18.2 20.9 21.1 21.8 21.1 20.8 14.6 17.3 22.3 14.4
60 to 69 M 130.0 143.8 117.0 139.0 113.0 107.4 123.1 109.5 84.9 81.6 101.7 95.1
F 66.1 64.3 61.9 62.3 63.6 55.1 60.7 59.0 52.4 54.2 46.2 44.4
70 to 79 M 291.5 295.5 274.6 239.7 240.2 248.8 247.9 180.9 192.3 208.8 230.3 208.9
F 188.1 185.2 194.4 187.6 159.4 157.6 153.2 164.5 122.4 125.0 134.3 135.5
80 or more M 628.7 606.1 698.9 645.2 619.3 539.3 661.1 513.2 425.3 433.8 504.5 453.3
slight decline. The Northeastern and Central-Western Regions reported a trend towards rising rates. In the authors’ opinion, rising mortality rates due to those causes was a result of: a) low schooling; b) urbanization expansion; c) changes in the social and economic status, and d) more efficient diagnosis of the causes of death, resulting in the number of deaths reduction from non-defined causes – down from 19% to 16% among females, and from 23% down to 18% among males in the given time period.
While addressing the relevance of information reliability obtained from mortality rate studies, Lolio20 recommends that death proportions from non-defined causes must not exceed 10%. In Ribeirão Preto, death proportions due to the non-defined causes did not exceed 6% along the series under study, which was also lower than the findings by Souza et al.10 in a study conducted in the Southeastern Region (11%) between 1979 and 1996. In the period under study, proportional mortality estimates due to non-defined causes of death in Ribeirão Preto revealed that the observed trends for DCS mortality rates were not impacted by the number of deaths from unknown causes– which emphasizes the internal validity of the present study.
Studies conducted in the United States and in Europe have reported that the mortality rates decline due to DCS is on one hand due to incidence rate reduction, and on the other hand to case-fatality rates reduction from those causes. In the authors’ view, incidence reduction mirrors the effects of primary prevention actions such as less common smoking habits, and lower cholesterol and blood pressure levels in the population. Case-fatality reduction, in its turn, mirrors the effects of secondary prevention – specific treatments such as
Age range
(years) Gender Β0* Regression Models Ra
2 p value Annual Reduction Average (%)
30 to 39 Females 2.6453 Y=2.6453-0.1883(x) 0.81 <0.001 -7.12
Males 5.7877 Y=5.7877-0.1962(x) 0.87 <0.001 -3.39
40 to 49 Females 9.1771 Y=9.1771-0.1777(x) 0.84 <0.001 -1.94
Males 18.1538 Y=18.1538-0.6017(x) 0.96 <0.001 -3.31
50 to 59 Females 23.0456 Y=23.0456-0.6319(x) 0.93 <0.001 -2.74
Males 50.2987 Y=50.2987-1.7211(x) 0.94 <0.001 -3.42
60 to 69 Females 64.0853 Y=64.0853-1.3717(x) 0.97 <0.001 -2.14
Males 124.9974 Y=124.9974-1.0487(x)-0.2426(x2)-0.0175(x3) 0.92 <0.001 -1.05
70 to 79 Females 183.0261 Y=183.0261-6.1222(x) 0.96 <0.001 -3.34
Males 267.7835 Y=267.7835-8.4797(x) 0.97 <0.001 -3.17
80 and older Females 575.7491 Y=575.7491-13.8869(x) 0.89 <0.001 -2.41
Males 622.5408 Y=622.5408-16.6715(x) 0.89 <0.001 -2.68
Table 2 – Regression models for the mortality rates from diseases of the curculatory system, and annual average reduction according to gender and age range. Ribeirão Preto, SP – 1980 to 2004.
*Mortality Rates Average in the Time Period.
angioplasty, myocardial revascularization surgeries, and the use of latest generation drugs21,22.
Between 1975 and 1994, 50% of DCS mortality rates reduction in Scotland was due to primary prevention23; between 1981 and 2000, the reduction was as high as 58% in England and Wales24; and between 1985 and 2000 Ireland reported a 2/3 reduction from primary prevention as compared to baseline25. Secondary prevention has also been appointed by some authors as responsible for mortality rates decline. The estimated decline in Auckland, New Zealand, was 40% (1974 to 1981)26, having risen to 48% (1982 to 1993)27; The Netherlands reported a 46% decline (1978 to 1985)28; The United States, 43% (1980 to 1990)29, and Finland, 23% (1982 to 1997)22. The major cause for mortality rates decline in Taiwan was tertiary prevention resulting from intense investments in cardiac rehabilitation units combined with specific treatments30.
In Brazil, although quite a number of studies have confirmed DCS mortality rates decline, the hypotheses to explain the phenomenon in some parts of the country are based on results reported in international studies. The major determinants for such decline cannot, therefore, be pinned down. Those hypotheses include better access to medical assistance by the population in general, scientific and technological advance in DCS diagnosis, and better understanding of the pathophysiology of these conditions
6-8,10,17,19 . The lack of data for the development of time series
Graph 1 - Mortality Rates Trends from Diseases of the Circulatory System according to gender and age range. Ribeirão Preto. SP – 1980 to 2004. -1 0 1 2 3 4 5 6 7 8 M o rt al it y R at es /1 0, 00 0 (I n )
1980 1981 1982 1983 1984 1985 1986 1987 1988 1989 1990 1991 1992 1993 1994 1995 1996 1997 1998 1999 2000 2001 2002 2003 2004
year
Males
Females
(a) 30 to 39 years old
-1 0 1 2 3 4 5 6 7 8
1980 1981 1982 1983 1984 1985 1986 1987 1988 1989 1990 1991 1992 1993 1994 1995 1996 1997 1998 1999 2000 2001 2002 2003 2004
Males Females M o rt al it y R at es /1 0, 00 0 (I n ) year
(b) 40 to 49 years old
-1 0 1 2 3 4 5 6 7 8
1980 1981 1982 1983 1984 1985 1986 1987 1988 1989 1990 1991 1992 1993 1994 1995 1996 1997 1998 1999 2000 2001 2002 2003 2004
Males Females M o rt al it y R at es /1 0, 00 0 (I n ) year
(c) 50 to 59 years old
-1 0 1 2 3 4 5 6 7 8
1980 1981 1982 1983 1984 1985 1986 1987 1988 1989 1990 1991 1992 1993 1994 1995 1996 1997 1998 1999 2000 2001 2002 2003 2004
Males Females M o rt al it y R at es /1 0, 00 0 (I n ) year
(d) 60 to 69 years old
-1 0 1 2 3 4 5 6 7 8
1980 1981 1982 1983 1984 1985 1986 1987 1988 1989 1990 1991 1992 1993 1994 1995 1996 1997 1998 1999 2000 2001 2002 2003 2004
Males Females M o rt al it y R at es /1 0, 00 0 (I n ) year
(e) 70 to 79 years old
-1 0 1 2 3 4 5 6 7 8
1980 1981 1982 1983 1984 1985 1986 1987 1988 1989 1990 1991 1992 1993 1994 1995 1996 1997 1998 1999 2000 2001 2002 2003 2004
Males Females M o rt al it y R at es /1 0, 00 0 (I n ) year
While studying DCS mortality rate trends in Olmsted County, Minnesota, U.S.A., in the period between 1979 and 2003, Gerber et al.31 observed that although age-adjusted mortality had proven to be higher among males, the difference – in magnitude – was reduced in time when compared to females as a result of a more marked reduction among males than among females. Annual Reduction Average (ARA) among males was 3.3% (CI95%: 2.8 – 3.8); and among females, it was 2.5% (CI95%: 2.0 – 3.0) and DCS mortality relative risk in 2003 was 0.45 (CI95%: 0.40-0.50) when compared to 1979 among males and 0.54 (CI95%: 0.49-0.61) among females. Studies conducted by Roger et al.32,33 at the same location have reported that in the period between 1979 and 1994 atherosclerosis prevalence and myocardial infarction incidence were shown to have decreased among males, but were kept stable - or even significantly increased – among females.
Results published by Vaccarino et al.34 have reported that in the period between 1994 and 1998, younger women had higher hospital case-fatality rates than males in the same age range after having been diagnosed for myocardial infarction in the United States. The authors have pointed out that after the first symptoms, women with myocardial infarction would take longer to look for medical care as compared to men.
While studying cardiovascular potential risk factors focusing a century trend in Austria (1985 to 2005) and involving males and females in the 20 to 79-year-old range, Ulmer et al.35 identified cholesterol, triglycerides and both systolic and diastolic blood pressure levels to have been significantly reduced in all cohorts both among males and females as age advanced (age effect). On the other hand, fasting blood glucose mean level showed a strong trend towards increase (between 4 and 15mg/dl), among same age individuals in younger cohorts (cohort effect).
While analyzing the trends of specific mortality rates from cardiovascular diseases in the São Paulo metropolitan area in the period between 1970 and 1983, Lolio et al.4 found a statistically significant decline (p<0.01) for all age ranges from the 50-year-old range and older both among males and females. While studying the trends for mortality rates from ischemic heart diseases in Goiânia, GO, metropolitan area, in the period between 1980 and 1994, Moraes et al.6 reported a statistically significant decline (p<0.05) for more advanced age groups both among males and females. Such decline was observed in the 75-year-old group and older, whereas in the 65 to 74-year-old group the decline was reported among females only.
Ribeirão Preto social and economic status, and its high Human Development Index, and higher access to more complex medical assistance by the population as a whole are likely to be the best “explanation” for mortality rate decline from DCS in that city. The results are consistent with those reported by authors elsewhere who have reported an association between high social and economic status and DCS morbidity and mortality rates decline7,8,10,17. The identification of a decline in mortality rates from DCS, in its turn, helps ranking Ribeirão Preto among developed regions going through the 4th stage of the Epidemiological Transition9. Annual reduction average from DCS in Ribeirão Preto was more prominent among females in the 30 to 39-year-old range (-7,12%). It is possible to assume that those in the cohorts of more recent birthday dates – especially as of the 1970’s – were the ones to have most benefited from healthier habits such as reduction in smoking habits, physical activity on a regular basis, and obesity control, thus contributing to the observed decline.
Ecological studies based on time series help formulating hypotheses related to the determinants of chronic outcomes. In Brazil, however, the lack of periodic data collection on the Graph 2 – Proportional Mortality from non-deined causes of death according to age range. Ribeirão Preto. S.P. - 1980 – 2004
1980 1981 1982 1983 1984 1985 1986 1987 1988 1989 1990 1991 1992 1993 1994 1995 1996 1997 1998 1999 2000 2001 2002 2003 2004 0
%
30-39
40-49
50-59
60-69
70-79
80 years old and older 1
potential risk or protection factors for DCS, associated to the scarce analytical epidemiological studies on mortality rates from the described causes do limit the confirmation of the hypotheses on major determinants for the observed decline, which could act as subsidies for rational public policies for health promotion and prevention.
Acknowledgements
To CNPq for the PhD Fellowship granted to Cláudio Shigueki Suzuki (Processo Nº 142653/2007-1) and Isabel Cristina Martins de Freitas (Processo Nº 141102/2007-1).
Potential Conflict of Interest
No potential conflict of interest relevant to this article was reported.
Sources of Funding
There were no external funding sources for this study.
Study Association
This study is not associated with any post-graduation program.
References
1. McGovern PG, Pankow JS, Shahar E, Doliszny KM, Folsom AR, Blackburn H, et al. Recent trends in acute coronary disease: mortality, morbidity, medical care, and risk factors. N Engl J Med. 1996; 334 (14): 884-90.
2. Ford ES, Capewell S. Coronary heart disease mortality among young adults in the U.S. from 1980 through 2002: concealed leveling of mortality rates. J Am Coll Cardiol. 2007; 27 (50): 2128-32.
3. Lotufo PA, Lolio CA. Mortality trends in ischemic heart disease in São Paulo State: 1970-1989. Arq Bras Cardiol. 1993; 61 (3): 149-53.
4. Lolio CA, Souza JMP, Laurenti R. Decline in cardiovascular disease mortality in the city of São Paulo, Brazil, 1970 to 1983. Rev Saúde Pública. 1986; 20 (6): 454-64.
5. Passos LCS, Lopes AA, Lessa I, Sanches A, Santos-Jesus R. Mortality attributed to myocardial infarction in the male and female population of Salvador, BA, between 1981 and 1996. Arq Bras Cardiol. 2000; 74 (4): 332-4.
6. Moraes SA, Rezende MHV, Freitas ICM. Trends in mortality due to ischemic heart disease in the municipality of Goiania, Brazil, during the years between 1980 and 1994. Arq Bras Cardiol. 2000; 74 (6): 498-502.
7. Mansur AP, Favarato D, Souza MFM, Avakian SD, Aldrighi JM, César LAM, et al. Trends in death from circulatory diseases in Brazil between 1979 and 1996. Arq Bras Cardiol. 2001; 76 (6): 504-10.
8. Souza MFM, Alencar AP, Malta DC, Moura L, Mansur AP. Análise de séries temporais da mortalidade por doenças isquêmicas do coração e cerebrovasculares, nas cinco regiões do Brasil, no período de 1981 a 2001. Arq Bras Cardiol. 2006; 87 (6): 735-40.
9. Omran AR. The epidemiology transition in the Americas. PAHO. Washington: The University of Maryland; 1996.
10. Souza MFM, Timerman A, Serrano CV Jr, Santos RD, Mansur AP. Trends in the risk of mortality due to cardiovascular diseases in five Brazilian geographic regions from 1979 to 1996. Arq Bras Cardiol. 2001; 77 (6): 569-75.
11. Hennekens CH, Buring JE. Epidemiology in medicine. Boston: Little Brown and Co; 1987.
12. Brasil. Ministério da Saúde. Datasus. Sistema de Informação sobre mortalidade (1980-2004). [Acesso em 2007 Dez 21]. Disponível em http:// www.datasus.gov.br - Informação direta, 2007.
13. Organização Mundial de Saúde-OMS. Manual de classificação estatística internacional de doenças, lesões e causas de óbitos (9ª Revisão). São Paulo: Centro Colaborador da OMS para Classificação das Doenças em Português; 1980.
14. Organização Mundial de Saúde-OMS. Classificação estatística internacional de doenças e problemas relacionados à saúde (10ª Revisão). São Paulo: Centro Colaborador da OMS para Classificação das Doenças em Português; 1995.
15. Morettin PA, Toloi CMC. Análise de séries temporais. São Paulo: Editora Edgar Blücher; 2006.
16. Kleinbaum DG, Kupper LL, Muller KE, Nizam A. Applied regression analysis and other multivariable methods. Pacific Grove: Duxbury Press; 1998.
17. Mansur AP, Souza MFM, Timerman A, Avakian SD, Aldrighi JM, Ramires JAF. Tendência do risco de morte por doenças circulatórias, cerebrovasculares e isquêmicas do coração em treze estados do Brasil, de 1980 a 1998. Arq Bras Cardiol. 2006; 87 (6): 641-8.
18. Thorn TJ. International mortality from heart disease: rates and trends. Int J Epidemiol. 1989; 18 (Suppl 1): S20-S28.
19. Oliveira GMM, Souza e Silva NA, Klein CH. Mortalidade compensada por doenças cardiovasculares no período de 1980 a 1999-Brasil. Arq Bras Cardiol. 2005; 85 (5): 305-13.
20. Lolio CA. Mortalidade por doenças do aparelho circulatório em capitais de regiões metropolitanas do Brasil, 1979-1989 [Livre Docência]. São Paulo: Faculdade de Saúde Pública da Universidade de São Paulo; 1994.
21. Ergin A, Muntner P, Sherwin R, He J. Secular trends in cardiovascular disease mortality, incidence, and case fatality rates in adults in the United States. Am J Med. 2004; 117: 219-27.
22. Laatikainen T, Critchley J, Vartiainen E, Salomaa V, Ketonen M, Capewell S. Explaining the decline in coronary heart disease mortality in Finland between 1982 and 1997. Am J Epidemiol. 2005; 162: 764-73.
23. Capewell S, Morrison CE, McMurray JJ. Contribution of modern cardiovascular treatment and risk factor changes to the decline in coronary heart disease mortality in Scotland between 1975 and 1994. Heart. 1990; 81: 380-6.
24. Unal B, Critchley JA, Capewell S. Modelling the decline in coronary heart disease deaths in England and Wales, 1981-2000: comparing contributions from primary prevention and secondary prevention. BMJ. 2005; 331: 614-20.
25. Kabir Z, Bennett K, Shelley E, Unal B, Crichley JA, Capewell S. Comparing primary prevention with secondary prevention to explain decreasing coronary heart disease death rates in Ireland, 1985-2000. BMC. 2007; 7: 117-24.
26. Beaglehole R. Medical management and the decline in mortality from coronary heart disease. BMJ. 1986; 292: 33-5.
27. Capewell S, Beaglehole R, Seddon M, McMurray J. Explanation for the decline in coronary heart disease mortality rates in Auckland, New Zealand, between 1982 and 1993. Circulation. 2000; 102: 1511-6.
28. Bots ML, Grobbee DE. Decline of coronary heart disease mortality in the Netherlands from 1978 to 1985: contribution of medical care and changes over time in presence of major cardiovascular risk factors. J Cardiovasc Risk. 1996; 3: 271-6.
30. Cheng Y, Chen KJ, Wang CJ, Chan SH, Chang WC, Chen JH. Secular trends in coronary disease mortality, hospitalization rates, and major cardiovascular risk factors in Taiwan, 1971-2001. Int J Cardiol. 2005; 100: 47-52.
31. Gerber Y, Jacobsen SJ, Frye RL, Weston AS, Killian JM, Roger VL. Secular trends in deaths from cardiovascular diseases: a 25-year community study. Circulation. 2006; 113: 2285-92.
32. Roger VL, Weston SA, Killian JM, Pfeifer EA, Belau PG, Kottke TE, et al. Time trends in the prevalence of atherosclerosis: a population-based autopsy study. Am J Med. 2001; 110: 267-73.
33. Roger VL, Jacobsen SJ, Weston SA, Goraya TY, Killian J, Reeder GS, et al. Trends in the incidence and survival of patients with hospitalized myocardial infarction, Olmsted County, Minnesota, 1979 to 1994. Ann Intern Med. 2002; 136 (5): 341-8.
34. Vaccarino V, Parsons L, Every NR, Barron HV, Krumholz HM. Sex-based differences in early mortality after myocardial infarction. N Engl J Med. 1999; 341: 217-25.