FREE THEMES
1 Instituto Fernandes Figueira, Fiocruz. Av. Rui Barbosa 716, Flamengo. 22250-020 Rio de Janeiro RJ Brasil. [email protected]
Perceptions about men’s health in a gender relational perspective,
Brazil, 2014
Abstract The goal of this article is to assess the perception of male health from the viewpoint of men and women. The study drew from a ran-dom sample of men aged 20 to 59 who were SUS (Unified Healthcare System) users and resided in the capitals of Brazilian states and the Federal District. Participants were interviewed by phone. Sociodemographic variables and variables related to perception of healthcare services, health status and health care were recorded. Logistic regression was used to assess failure to seek service and good and very good self-care. The majority of the study population considers it has no health problem, es-pecially men. The main reason for failure to seek treatment is no access to services, although both men and women claim the healthcare services receive them adequately. Over 40% of men and almost 30% of women self-medicate. Men believe they are taking good care of their health, while women have a different perception of this. Percep-tions differ when we take into consideration age, years of schooling, ethnicity and occupation.
Key words Men’s health, Gender, Interviews, Telephone, Brazil
Erly Catarina de Moura 1
Romeu Gomes 1
M
our
a EC
Introduction
The first studies of men’s health emerged in the US last century, in the late 1970s. Most of these
studies centered on health risks1. In the nineties,
the topic gained new approaches, among them an attempt to focus on male health and disease
from a gender relational point of view2,3.
In the field of knowledge produced on this theme, we call attention to the review by
McKin-lay4, in New Zealand. In this study gender
dif-ferences regarding morbidity, mortality and life expectancy were explained based on the biolog-ical-genetic specificities of men and women, on social differences and inequalities, on different social expectations on the part of men and wom-en, on the search and use of healthcare services and professional healthcare focused on men.
Looking at the literature on this topic pro-duced in Brazil, the milestone would be the spe-cial issue of Ciência & Saúde Coletiva (Science and Group Health) published in 2005. The edi-torial of this number stated that promoting the health of both men and women required a deep-er exploration of the hegemonic ideologies of
masculinity and the health-disease process5.
The important milestone in Brazil was the National Policy for Integrated Healthcare for Men, created by the Ministry of Health to pro-mote health activities focusing on the unique sit-uation of men in the different sociocultural and
political contexts6.
In a discussion about men’s health, there are studies that focus on the need to address the
top-ic from a gender relational perspective5,7. This
means that gender models are built using an in-ter-relation, just as what is culturally viewed as “male” only makes sense from the female
per-spective, and vice-versa8. The adjective
“relation-al” is different from “complementary”. This
cate-gory creates and reproduces power asymmetries7.
Perceptions of men’s health may be viewed as a synthesis of the interactions between the male and female perceptions in a context of asymme-tries.
Perceptions regarding health - understood here as subject interpretations of their own health - have been used in long-term studies. These have been taken as an important indicator for, among other purposes, understanding how
individuals perceive their well-being9 and
under-stand the health situation of the populations10.
Individual perceptions have also been associated
with health self-assessment studies11.In
epidemi-ological terms, these studies have predictive
pow-er on the mortality of diffpow-erent socioeconomic groups, despite being limited, especially in terms
of measurements12.
Based on these initial considerations, this study attempts to analyze the male and female perceptions of men’s health and their access to healthcare services. Analysis of the differences and convergences in the perceptions of men and women may provide subsidies for expanded un-derstanding of male health, from a gender rela-tional perspective.
Method
This cross-sectional study was performed in 2014 on a random sample of men aged 20 to 59 who were SUS (Unified Healthcare System) users and resided in the capitals of Brazilian states and the Federal District. Participants were interviewed by phone.
The sample size was calculated using as a pa-rameter the fact that 45.7% of fathers are present
during delivery13 (5% error and 95% confidence
interval). This determined a total of 3,810 inter-views in Brazilian state capitals and the Federal District, which concentrate the majority of the adult population.
Because the survey was done by phone, the informed consent form was replaced by verbal consent obtained from the interviewees during the telephone conversation. The study entitled “Male Care Focused on Sexual Health, Repro-duction and Paternity from the Gender Relation-al Perspective” (in Portuguese Os cuidados mas-culinos voltados para a saúde sexual, a reprodução e a paternidade a partir da perspectiva
relacion-al de gênero)14 was approved by the Ministry of
Health, Fernandes Figueira National Institute of Women’s Children’s and Adolescent Health Eth-ics Committee for Research with Human Beings. This institute is part of the Osvaldo Cruz founda-tion in Rio de Janeiro.
This study used sociodemographic variables, and perception of healthcare services, health sta-tus and health care.
Sociodemographic variables were region of residence, age, schooling, ethnicity, religion, mar-ital status and employment status. Regions were North, Northeast, Southeast, South and Middle West. Age was split into four groups: 20 to 29, 30 to 39, 40 to 49 and 50 to 59; years of schooling
were split as follows: < 9, 9 to 11 and ≥ 12 years
aúd
e C
ole
tiv
a,
22(1):291-300,
2017
union or stable union; employment status could be yes or no.
Health variables were perception among the priority population of the primary healthcare units, presence of any disease or health problem, incidence and location of treatment, reason for not seeking treatment. Responses were subse-quently opened and encoded. We also analyzed perceptions of how Healthcare Services service men and self-care among men. In both cases the options were very well/very good, well/good, fair, bad/poor and very bad/very poor.
We also explored the association between sociodemographic (independent) variables and failure to seek treatment (dependent variable) in the presence of a health issue among men and women, and between sociodemographic (inde-pendent) variables and good and very good self-care (dependent variable) from the viewpoint of men. We used Poisson’s regression to calculate the gross and adjusted prevalence ratios.
Estimates were calculated bearing in mind the complex nature of the sample, using two post-stratification weighting factors. The first factor (ratio) was the ratio between the rela-tive frequency of individuals found in the 2010 Demographic Census, and the relative frequen-cy found in this study using the 24 categories of gender (male and female), age (20-29, 30-39, 40-49 and 50-59 years of age) and years of
schooling (<9, 9-11 and ≥ 12). The purpose was
to achieve an even sociodemographic composi-tion. The second factor (sample fraction) was the ratio between the total number of adults living in each region and the total in this study, to cor-rect any differences between the population of each region and the study population. The final weighting factor for the total population was the product of these two factors, and for each region only the ratio. Thus, the data was expanded to represent approximately 12 million men and 14 million women living in the study locations.
Data was processed using Stata, bearing in mind the specificities of men and women, and a significance level of 4% (p < 0.05), and the 95%
Confidence interval (CI95%) for comparing
gen-ders, as well as the representativeness of each in-terviewee in the adult population assessed.
Results
We completed 3,885 interviews, 1,894 with men and 1,991 with women, and found no difference in the majority of the sociodemographic
charac-teristics we looked at (Table 1). Differences were found only in religion and employment status, women are more religious and more men are employed.
In general, both men and women feel that primary healthcare services focus on everyone, regardless of gender, age, social status or health, with a larger percentage of women than men sharing this view (Table 2). Among the men, 14.1% claimed that, at the time of the interview, they had some disease or health problem, slight-ly more than half the corresponding percentage among women. Of these, most were being treat-ed, most often with self-medication, in particu-lar among men (42.1%). Among the women, we found an equal prevalence of healthcare services (private or primary care unit) and self-medica-tion. The men who claimed not to be in treat-ment reported not having access to care or the problem not being important as the reasons for not seeking treatment. In the case of women, no access to care was the reason given most often.
Figure 1 shows the health problems men-tioned by men and women. We find that the three main groups in both genders mentioned circulatory system disorders, osteomuscular sys-tem and connective tissue disorders, blood disor-ders, disorders of the hematopoietic organs and a number of immune disorders. Neoplasias and endocrine, nutritional and metabolic diseases were more frequent among women.
Regarding male perception of the quality of health provided by primary healthcare units, most of the men or women claimed it is good or fair, with fair being mentioned most often by the men in the study (Table 2). Almost twice the number of women as men claimed they did not know. When we asked how men care for their own health, the answers given by men and wom-en matched. However, mwom-en were more likely to answer good or very good, and women more likely than men to answer bad and very bad.
M
our
a EC
(28.0%). We observed the same trend among men for these variables, although with overlap-ping confidence intervals.
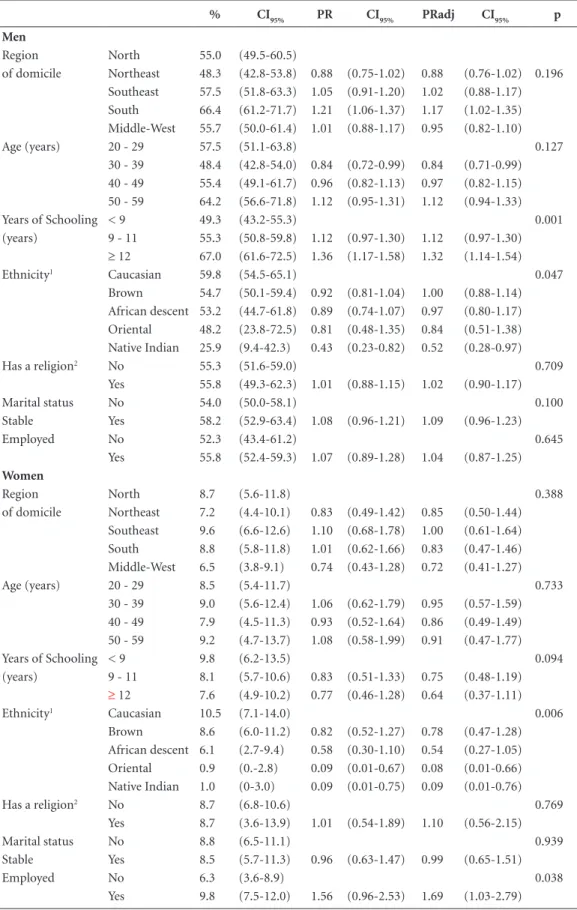
From the viewpoint of men (Table 4), health-care self-assessment is directly linked to years of schooling, with the group having more education being 32% more likely to consider care as good or very good, compared to the groups with fewer years of schooling. Native Indian men have more than a 50% chance of considering their health-care as fair, poor or very poor. From the view-point of the women in this study, women of Ori-ental or native Indian ethnicity believe the chance that men take care of themselves well or very well is higher (by as much as 90%) than it is among other women. Employment is associated with a more positive vision of male self-care among women. They are 69% more likely to consider male self-care as good or very good than women
who are not part of the job market. We point out that among almost all categories of women, the prevalence of male self-care of health as good or very good did not exceed 10%, remaining always below how men assess themselves.
Discussion
Internal validation of the results may be analyzed during the course of the project, from training the teams through statistical data analysis. The sample plan was designed to include all locations, and phone numbers were drawn at random. Suc-cess rate was 76.2% and the interviewers report-ed no problem identifying eligible subjects.
External validation of this study is primari-ly through the comparison of the distribution
Table 1. Distribution* and 95% Confidence Interval (CI
95%) of men and women by sociodemographic
characteristics. Brazil, 2014.
Men Women
Sociodemographic characteristics % 95%CI n 95%CI
Region North 9.9 (8.8-11.1) 8.3 (7.4-9.3)
of domicile Northeast 25.1 (22.6-27.6) 22.7 (20.4-25.0) Southeast 48.4 (45.2-51.7) 53.7 (50.7-56.7)
South 7.3 (6.4-8.2) 6.9 (6.1-7.7)
Middle-West 9.2 (8.1-10.3) 8.4 (7.4-9.3) Age (years) 20 - 29 27.4 (24.5-30.3) 27.0 (24.3-29.8)
30 a 39 30.1 (27.2-33.0) 28.8 (26.1-31.5) 40 a 49 24.3 (21.6-27.1) 24.0 (21.4-26.5) 50 a 59 18.1 (15.5-20.7) 20.2 (17.5-22.9) Years of Schooling < 9 39.7 (36.4-43.1) 37.9 (34.6-41.1)
(years) 9 a 11 38.5 (35.5-41.5) 40.5 (37.6-43.5)
≥ 12 21.7 (19.4-24.1) 21.6 (19.5-23.8) Ethnicity1 Caucasian 31.9 (29.0-34.8) 34.8 (31.8-37.7)
Brown 51.6 (48.4-54.8) 47.4 (44.3-50.5) African descent 12.8 (10.8-14.9) 14.6 (12.5-16.7) Oriental 1.5 (0.8-2.3) 2.1 (1.1-3.1) Native Indian 2.1 (1.1-3.1) 1.1 (0.4-1.9) Has a religion2 Yes 76.1 (73.3-78.8) 85.7 (83.5-88.0)
Marital status No 34.8 (31.7-37.8) 39.6 (36.6-42.6)
Stable Yes 65.2 (62.2-68.3) 60.4 (57.4-63.4)
Occupation (job/ No 12.6 (10.5-14.7) 34.0 (31.0-36.9) of schooling) Yes 87.4 (85.3-89.5) 66.0 (63.1-69.0)
Employed No 10.6 (8.8-12.4) 31.4 (28.5-34.3)
Yes 89.4 (87.6-91.2) 68.6 (65.7-71.5)
aúd
e C
ole
tiv
a,
22(1):291-300,
2017
of the sociodemographic categories of the study population, which does not differ from official estimates based on census data by more than
10%15. Specifically regarding the variables that in
this study differ among men and women, 24% of
the men and 14% of the women claimed to have no religion. This ratio (1.7) is close to the ratio obtained in the 2010 census (1.4 in rural areas and 1.5 in urban areas). This small difference may be explained as the study population lives
Table 2. Distribution* and (% and 95% Confidence Interval) of male and female perception of healthcare services,
health status and health care. Brazil, 2014.
Men Women
% CI95% % CI95%
Activities and services that are the focus of the primary care unit
all 67.2 (64.2-70.2) 73.3 (70.7-75.9) Elderly 9.5 (7.5-11.5) 6.2 (4.7-7.6)
Women 4.2 (3.1-5.4) 3.7 (2.7-4.7)
Children 5.1 (3.7-6.5) 4.0 (2.8-5.3) Elderly and children 3.3 (2.3-4.4) 3.2 (2.3-4.1) Women and children 1.1 (0.6-1.6) 1.3 (0.7-1.8)
men 0.4 (0.1-0.8) 0
patients 2.5 (1.7-3.4) 2.4 (1.6-3.3)
needy 0.6 (0.0-1.1) 0.2 (0.0-0.4)
does not know 3.7 (2.6-4.9) 2.4 (1.6-3.3)
nobody 2.3 (1.5-3.1) 3.3 (2.2-4.3)
Has a disease or healthcare problem
No 85.9 (83.6-88.2) 74.5 (71.7-77.2) Yes 14.1 (11.8-16.4) 25.5 (22.8-28.3) In treatment1 No 24.0 (16.2-31.8) 20.8 (15.4-26.1)
Yes 76.0 (68.2-83.8) 79.2 (73.9-84.6) Where1 Private Care 36.1 (26.3-46.0) 30.4 (24.1-36.6)
Primary Healthcare Unit 20.4 (12.4-28.5) 40.7 (33.4-48.0) Public Hospital 0.8 (0-1.7) 0.7 (0-1.5) Self-medication 42.1 (32.1-52.2) 28.1 (22.3-34.0)
Other 0.5 0-1.4) 0.1 (0-0.3)
Why not in treatment2
no access to service 49.8 (30.9-68.6) 75.8 (63.5-88.2) not important 37.7 (18.1-57.3) 16.7 (5.3-28.1)
no access to drugs 0 1.9 (0-5.0)
self-medication 3.1 0-7.5) 3.3 (0-8.0) side-effects 9.5 (0.8-18.2) 2.3 (0-5.2) Healthcare service reception
of men
Very good 6.9 (5.1-8.7) 4.0 (2.8-5.2) Good 28.9 (26.0-31.8) 31.4 (28.5-34.2) Fair 37.3 (34.2-40.4) 28.5 (25.7-31.3)
Poor 9.9 (7.9-11.8) 7.7 (6.0-9.4)
Very poor 10.8 (8.9-12.6) 10.8 (8.9-12.8) Does not know 6.3 (4.7-7.8) 17.6 (15.2-20.0) How men care for their
health
Very well 17.3 (14.9-19.7) 1.9 (1.0-2.8) Well 38.2 (35.1-41.3) 6.8 (5.2-8.4) Fair 36.1 (33.0-39.3) 38.7 (35.7-41.7) Poor 4.8 (3.4-6.2) 25.6 (23.0-28.3) Very poor 3.5 (2.3-4.6) 24.0 (21.4-26.5) Does not know 0.1 (0.0-0.3) 3.1 (1.9-4.3)
M
our
a EC
in state capitals and the Federal District, where there may be a higher frequency of people with no religion. Regarding employment, the census also shows more men than women are employed, in a ratio of 1.4, similar to that found in this study (1.3).
In other national studies, data comparison is hindered by differences in methods, from the study population through analyses. Nevertheless, some analogy is possible, as shown below.
A study conducted in the south of Brazil16
shows that women over the age of 14 are three times as likely to mention some health problem in the past two months than are men of the same age group. This corroborates the estimates in this study, which indicate that almost twice the num-ber of women mentioned some health problem. However, these statements must be put into con-text, as the survey population is of a different age, and the period of study is also different.
Regarding the healthcare problems reported, the data coincides with that obtained during the
study conducted in Minas Gerais17, in which
dis-eases of the circulatory system were mentioned most often, followed by osteomuscular and con-nective tissue disorders. However, the third cause differs. As the third cause, our survey found
dis-orders of the blood and hematopoietic organs, as well as some immune disorders, while the Minas Gerais study listed endocrine, nutritional and metabolic disorders among men, and respirato-ry system disorders among women. These dif-ferences may be explained by the difference in age, region and especially study population, as the Minas Gerais study was limited to healthcare workers.
A study conducted in the South16 of the
country also shows a higher risk (1.78) of poor perception of risk among women. Although not within the scope of this study, it is possible to draw a parallel with the answers about male care of their own health, where most men considered their self-care to be good or very good, and wom-en believe it to be poor or very poor. This percep-tion may explain why men menpercep-tion fewer health problems and thus seek healthcare services less frequently, which is in line with their view of fair service at healthcare units. However, several stud-ies have mentioned that men are more likely to engage in risky behavior than women, and have
worse biochemical indicators18,19.
A systematic review estimates the prevalence of self-medication among the adult Brazilian
population as 35%20, with no gender specified,
Figure 1. Distribution* (% and 95% Confidence Interval) among men and women according to the
International Classification of Diseases (ICD-10). Brazil, 2014.
*weighted to represent the male and female population aged 20 to 59 living in state capitals and the Federal District.
0 = does not know; 1=some infectious and parasite disorders; 2 = neoplasias; 3 = blood and hematopoietic organ disorders and some immune disorders; 4 = endocrine, nutritional and metabolic disorders; 5 = mental and behavioral disorders; 6 = nervous system disorders; 7 = eye and related disorders; 8 = ear and mastoid apophysis disorders; 9 = circulatory system disorders; 10 = respiratory system disorders; 11 = digestive system disorders; 12 = skin and subcutaneous tissue disorders; 13 = osteomuscular and connective tissue disorders; 14 = genitorurinary disorders; 15 = pregnancy, delivery and puerperium; 17 = congenital malformations, deformities and chromosomal anomalies; 19 = lesions, poisonings and other consequences of external causes.
0 1 2 3 4 5 6 7 8 9 10 11 12 13 14 15 17 19 35
30 25 20 15 10 5 0 %
aúd
e C
ole
tiv
a,
22(1):291-300,
2017
Table 3. Prevalence, prevalence ratio (PR), adjusted prevalence ratio (PRadj) for all variables and their respective
95% confidence interval (CI95%) for the reasons given by men and women for not seeking healthcare in the
presence of a health problem. Brazil, 2014.
% CI95% PR 95%CI PRadj CI95% p
Men
Region of domicile North 33.5 (19.3-47.8) 1 1 0.077 Northeast 30.0 (15.6-44.4) 0.97 (0.83-1.13) 0.99 (0.84-1.16) Southeast 21.1 (8.2-34.0) 0.91 (0.78-1.05) 0.93 (0.79-1.08) South 17.9 (7.3-28.6) 0.88 (0.77-1.02) 0.89 (0.75-1.04) Middle-West 22.8 (8.6-36.9) 0.92 (0.79-1.08) 0.89 (0.75-1.06)
Age (years) 20 - 29 40.4 (12.2-68.5) 1 1 0.002
30 - 39 34.4 (17.0-51.7) 0.96 (0.75-1.21) 0.98 (0.79-1.23) 40 - 49 29.7 (13.4-46.0) 0.92 (0.73-1.17) 0.93 (0.75-1.16) 50 - 59 11.6 (3.3-20.0) 0.80 (0.64-0.98) 0.78 (0.63-0.96) Years of Schooling < 9 33.4 (19.0-47.9) 1 1 0.003 (years) 9 - 11 17.5 (8.7-26.3) 0.88 (0.77-1.00) 0.82 (0.71-0.94)
≥ 12 14.5 (4.2-24.7) 0.86 (0.75-0.99) 0.84 (0.73-0.96)
Ethnicity Caucasian 21.4 (6.6-36.1) 1 1 0.098
Brown 27.5 (16.0-39.1) 1.05 (0.90-1.22) 1.01 (0.89-1.15) African descent 20.3 (6.7-33.9) 0.99 (0.84-1.17) 0.95 (0.82-1.10) Oriental - - 0.82 (0.73-0.93) 0.78 (0.67-0.91) Native Indian - - 0.82 (0.73-0.93) 0.81 (0.69-0.95)
Has a religion No 23.5 (13.9-33.0) 1 1 0.740
Yes 25.5 (13.1-37.9) 1.02 (0.85-1.23) 0.97 (0.82-1.14)
Marital status No 27.5 (7.8-47.3) 1 1 0.799
Stable Yes 23.4 (15.0-31.8) 1.02 (0.90-1.15) 1.03 (0.93-1.15)
Employed No 33.5 (19.3-47.8) 1 1 0.819
Yes 30.0 (15.6-44.4) 0.97 (0.82-1.15) 1.03 (0.90-1.17)
Women
Region North 18.1 (10.1-26.0) 1 1 0.188
of domicile Northeast 33.3 (23.2-43.5) 1.13 (1.02-1.25) 1.09 (0.98-1.21) Southeast 15.9 (7.0-24.8) 0.98 (0.89-1.09) 0.96 (0.88-1.06) South 16.9 (9.0-24.9) 0.99 (0.90-1.09) 0.99 (0.89-1.10) Middle-West 18.8 (9.1-28.6) 1.01 (0.91-1.12) 1.04 (0.93-1.15)
Age (years) 20 - 29 40.8 (22.0-59.7) 1 1 0.000
30 - 39 20.6 (10.4-30.8) 0.86 (0.73-1.00) 0.88 (0.76-1.02) 40 - 49 25.1 (16.5-33.7) 0.89 (0.76-1.03) 0.86 (0.75-0.98) 50 - 59 7.3 (2.6-12.0) 0.76 (0.66-0.88) 0.76 (0.66-0.87) Years of Schooling < 9 28.0 (18.8-37.1) 1 1 0.000 (years) 9 - 11 14.9 (8.8-21.0) 0.90 (0.82-0.98) 0.88 (0.82-0.96)
≥ 12 9.2 (3.5-14.9) 0.85 (0.78-0.93) 0.85 (0.78-0.92)
Ethnicity Caucasian 16.7 (8.5-24.8) 1 1 0.682
Brown 21.0 (13.5-28.5) 1.04 (0.94-1.14) 0.99 (0.92-1.08) African descent 27.7 (9.8-45.7) 1.09 (0.94-1.28) 0.95 (0.84-1.08) Oriental 20.1 0-43.6) 1.03 (0.84-1.27) 0.91 (0.72-1.16) Native Indian 57.1 (9.4-100) 1.35 (0.99-1.84) 1.24 (0.97-1.59)
Has a religion No 18.9 (11.7-26.0) 1 1 0.016
Yes 23.4 (15.4-31.5) 1.20 (1.01-1.42) 1.20 (1.02-1.40)
Marital status No 27.2 (16.6-37.8) 1 1 0.067
Stable Yes 17.4 (11.5-23.3) 1.04 (0.95-1.13) 1.07 (0.99-1.15)
Employed No 18.1 (10.1-26.0) 1 1 0.076
Yes 33.3 (23.2-43.5) 0.92 (0.84-1.02) 0.93 (0.86-1.00)
M
our
a EC
Table 4. Prevalence, (prevalence ratio PR), adjusted prevalence ratio (PRadj) for all variables and their respective
95% confidence interval (CI95%) of good and very good self-care from the viewpoint of men. Brazil, 2014.
% CI95% PR CI95% PRadj CI95% p
Men
Region North 55.0 (49.5-60.5)
of domicile Northeast 48.3 (42.8-53.8) 0.88 (0.75-1.02) 0.88 (0.76-1.02) 0.196 Southeast 57.5 (51.8-63.3) 1.05 (0.91-1.20) 1.02 (0.88-1.17) South 66.4 (61.2-71.7) 1.21 (1.06-1.37) 1.17 (1.02-1.35) Middle-West 55.7 (50.0-61.4) 1.01 (0.88-1.17) 0.95 (0.82-1.10)
Age (years) 20 - 29 57.5 (51.1-63.8) 0.127
30 - 39 48.4 (42.8-54.0) 0.84 (0.72-0.99) 0.84 (0.71-0.99) 40 - 49 55.4 (49.1-61.7) 0.96 (0.82-1.13) 0.97 (0.82-1.15) 50 - 59 64.2 (56.6-71.8) 1.12 (0.95-1.31) 1.12 (0.94-1.33) Years of Schooling < 9 49.3 (43.2-55.3) 0.001 (years) 9 - 11 55.3 (50.8-59.8) 1.12 (0.97-1.30) 1.12 (0.97-1.30)
≥ 12 67.0 (61.6-72.5) 1.36 (1.17-1.58) 1.32 (1.14-1.54)
Ethnicity1 Caucasian 59.8 (54.5-65.1) 0.047
Brown 54.7 (50.1-59.4) 0.92 (0.81-1.04) 1.00 (0.88-1.14) African descent 53.2 (44.7-61.8) 0.89 (0.74-1.07) 0.97 (0.80-1.17) Oriental 48.2 (23.8-72.5) 0.81 (0.48-1.35) 0.84 (0.51-1.38) Native Indian 25.9 (9.4-42.3) 0.43 (0.23-0.82) 0.52 (0.28-0.97)
Has a religion2 No 55.3 (51.6-59.0) 0.709
Yes 55.8 (49.3-62.3) 1.01 (0.88-1.15) 1.02 (0.90-1.17)
Marital status No 54.0 (50.0-58.1) 0.100
Stable Yes 58.2 (52.9-63.4) 1.08 (0.96-1.21) 1.09 (0.96-1.23)
Employed No 52.3 (43.4-61.2) 0.645
Yes 55.8 (52.4-59.3) 1.07 (0.89-1.28) 1.04 (0.87-1.25)
Women
Region North 8.7 (5.6-11.8) 0.388
of domicile Northeast 7.2 (4.4-10.1) 0.83 (0.49-1.42) 0.85 (0.50-1.44) Southeast 9.6 (6.6-12.6) 1.10 (0.68-1.78) 1.00 (0.61-1.64) South 8.8 (5.8-11.8) 1.01 (0.62-1.66) 0.83 (0.47-1.46) Middle-West 6.5 (3.8-9.1) 0.74 (0.43-1.28) 0.72 (0.41-1.27)
Age (years) 20 - 29 8.5 (5.4-11.7) 0.733
30 - 39 9.0 (5.6-12.4) 1.06 (0.62-1.79) 0.95 (0.57-1.59) 40 - 49 7.9 (4.5-11.3) 0.93 (0.52-1.64) 0.86 (0.49-1.49) 50 - 59 9.2 (4.7-13.7) 1.08 (0.58-1.99) 0.91 (0.47-1.77)
Years of Schooling < 9 9.8 (6.2-13.5) 0.094
(years) 9 - 11 8.1 (5.7-10.6) 0.83 (0.51-1.33) 0.75 (0.48-1.19)
≥ 12 7.6 (4.9-10.2) 0.77 (0.46-1.28) 0.64 (0.37-1.11)
Ethnicity1 Caucasian 10.5 (7.1-14.0) 0.006
Brown 8.6 (6.0-11.2) 0.82 (0.52-1.27) 0.78 (0.47-1.28) African descent 6.1 (2.7-9.4) 0.58 (0.30-1.10) 0.54 (0.27-1.05) Oriental 0.9 (0.-2.8) 0.09 (0.01-0.67) 0.08 (0.01-0.66) Native Indian 1.0 (0-3.0) 0.09 (0.01-0.75) 0.09 (0.01-0.76)
Has a religion2 No 8.7 (6.8-10.6) 0.769
Yes 8.7 (3.6-13.9) 1.01 (0.54-1.89) 1.10 (0.56-2.15)
Marital status No 8.8 (6.5-11.1) 0.939
Stable Yes 8.5 (5.7-11.3) 0.96 (0.63-1.47) 0.99 (0.65-1.51)
Employed No 6.3 (3.6-8.9) 0.038
aúd
e C
ole
tiv
a,
22(1):291-300,
2017
further corroborating the data from this study, which estimates that the percent of men who self-medicate is over 40%, compared to 30% of the women. Here we point out that although the percentage is high, these people consider themselves to be under treatment for an existing health problem. Among those mentioning this practice as non-treatment and a reason for not seeking healthcare, the percent self-medication is small (about 3%).
In the domestic literature21-25, it is clear that
men seek out healthcare services less than women. Reasons for not seeking healthcare, even though they have a health problem, men mentioned not having access to healthcare and non-importance of the problem as the main reasons, and women claimed lack of access to care. Among the general
population, in 200826 the main reason given was
not having money to pay for healthcare, followed by difficult access and delays. This data puts in question the role of SUS, in that a large percent-age (20.5%) of the population sampled in 2008 considered private care as the location they go in search of care. This study differed, to the extent that one of the selection criteria was the use of primary services provided by SUS, with univer-sality being mentioned as one of the characteris-tics of service.
As mentioned by Aquino et al.27 three decades
ago, men continue displaying the same health characteristics, showing that in spite of the SUS, little progress has been made in terms of men’s healthcare and expanded service for this
popula-Collaborations
EC Moura helped conceive the project, analyze and interpret the data, write the article, and was responsible for all aspects of the work and for ensuring the accuracy and integrity of the entire work. R Gomes helped interpret the data, draft the article and with the final approval. GMC Pereira helped with a critical review of the intel-lectual content and final approval.
tion. The situation is even worse when we realize that self-medication is a common practice, and can be considered an indicator of not having ac-cess to primary healthcare services.
In general, study data serves to underlie dis-cussions about cultural gender models in health-care. These models may influence the percep-tions men and women have, and their search for Healthcare Services. To this end, perhaps because of the common association between men and strength, women and weakness, influenced our male subjects, leading them to see themselves as healthier than women. The same argument ap-plies in terms of the search for healthcare services. Our data also reinforces the need to, beyond cultural gender models, take into consideration other aspects such as age, years of schooling and socioeconomic situation. The influence of these models may take on different tones when these aspects are included. Another aspect that should be further explored is the relationship between gender and ethnicity, as the perceptions of the na-tive Indian men we interviewed are different, as are those of Oriental and native Indian women.
This topic deserves further study, as there are few population studies in Brazil that look into the different perceptions of health among men and women.
M
our
a EC
References
1. Courtenay WH, Keeling R. Men, gender, and health: toward an interdisciplinary approach. J Am Coll Health 2000; 48(6):243-246.
2. Courtenay WH. Constructions of masculinity and their influence on men’s well-being: a theory of gender and health. Soc Sci Med 2000; 50(10):1385-1401. 3. Schraiber LB, Gomes R, Couto MT. Homens na pauta
da saúde coletiva. Cien Saude Colet 2005; 10(1):7-17. 4. Mckinlay E. Men and health: a literature review.
Wel-lington: Wellington School of Medicine and Health Sciences; 2005.
5. Gomes R, Schraiber LB, Couto MT. O homem como foco da saúde pública. Cien Saude Colet 2005; 10(1):4. 6. Brasil. Ministério da Saúde (MS). Política nacional de
atenção integral à saúde de homens: princípios e diretri-zes. Brasília: MS; 2009.
7. Couto MT, Gomes R. Homens, saúde e políticas públi-cas: a equidade de gênero em questão. Cien Saude Colet 2012; 17(10):2569-2578.
8. Gomes R. Sexualidade masculina, gênero e saúde. Rio de Janeiro: Fiocruz; 2008.
9. Szwarcwald CL, Souza-Júnior PRB, Esteves MAP, Da-macena GN, Viacava F. Socio-demographic determi-nants of self-rated health in Brazil. Cad Saude Publica 2005; 21(Supl. 1):S54-64.
10. Traebert J, Bortoluzzi MC, Kehrig RT. Auto-percepção das condições de saúde da população adulta, Sul do Brasil. Rev Saude Publica 2011; 45(4):789-793. 11. Peres MA, Masiero AV, Longo GZ, Rocha GC, Matos
IB, Najnei K, Oliveira MC, Arruda MP, Peres KG. Au-to-avaliação da saúde em adultos no Sul do Brasil. Rev Saude Publica 2010; 44(5):901-911.
12. Quesnel-Vallée A. Self-rated heatlh: caught in the crossfire of the quest for “true” health? Int J Epidemiol 2007; 36(6):1161-1164.
13. Brasil. Ministério da Saúde (MS). Relatório da pesquisa de satisfação dos usuários do SUS quanto aos aspectos de acesso e qualidade percebida na atenção à saúde median-te inquérito amostral. Brasília: MS; 2012.
14. Gomes R. Os cuidados masculinos voltados para a saúde sexual, a reprodução e a paternidade a partir da perspec-tiva relacional de gênero. Rio de Janeiro: Fiocruz; 2013. 15. Instituto Brasileiro de Geografia e Estatística (IBGE).
Censo demográfico 2010. Rio de Janeiro: IBGE; 2015. 16. Mendoza-Sassi RA, Béria JU. Gender differences in
self-reported morbidity: evidence from a popula-tion-based study in southern Brazil. Cad Saude Publica 2007; 23(2):341-346.
17. Pereira IVS, Rocha MJL, Silva VM, Caldeira A.P. Mor-bidade autorreferida por trabalhadores das Equipes de Saúde da Família. Cien Saude Colet 2014; 19(2):461-468.
18. Laurenti R, Jorge MHPM, Gotlieb SLD. Perfil epidemi-ológico da morbi-mortalidade masculina. Cien Saude Colet 2005; 10(1):35-46.
19. Marcopito LF, Rodrigues SSF, Pacheco MA, Shirassub MM, Goldfeder AJ, Moraes MA. Prevalência de alguns fatores de risco para doenças crônicas na cidade de São Paulo Rev Saude Publica 2005; 39(5):738-745. 20. Domingues PHF, Galvão TF, Andrade KRC, Sá PTT,
Silva MT, Pereira MG. Prevalência da automedicação na população adulta do Brasil: revisão sistemática. Rev Saude Publica 2015; 49:36.
21. Barata RB. Acesso e uso de serviços de saúde: conside-rações sobre os resultados da pesquisa de condições de vida 2006. São Paulo em perspectiva 2008; 22(2):19-29. 22. Capilheira MF, Santos IS. Fatores individuais
associa-dos à utilização de consultas médicas por adultos. Rev Saude Publica 2008; 40(3):436-443.
23. Dias-da-Costa JS, Gigante DP, Horta BL, Barros FC, Victora CG. Utilização de serviços de saúde por adultos da coorte de nascimentos de 1982 a 2004-5, Pelotas, RS. Rev Saude Publica 2008; 42(Supl. 2):51-59.
24. Fernandes LCL, Bertoldi AD, Barros AJD. Utilização dos serviços de saúde pela população coberta pela Es-tratégia de Saúde da Família. Rev Saude Publica 2009; 43(4):595-603.
25. Travassos C, Viacava F, Pinheiro R, Brito A. Utilização dos serviços de saúde no Brasil: gênero, características familiares e condição social. Rev Panam Salud Publica 2002; 11(5/6):365-373.
26. Instituto Brasileiro de Geografia e Estatística (IBGE). Pesquisa nacional de amostra domiciliar: um panorama da saúde no Brasil. Acesso e utilização dos serviços, con-dições de saúde e fatores de risco e proteção à saúde, 2008. Rio de Janeiro: IBGE; 2010.
27. Aquino EML, Menezes GMS, Amoedo MB. Gênero e saúde no Brasil: considerações a partir da Pesquisa Na-cional por Amostra de Domicílios. Rev Saude Publica 1992; 26(3):195-202.
Article submitted 14/9/2015 Approved 22/10/2015