DECISION SUPPORT SYSTEMS FOR RAINWATER
HARVESTING AND RUNOFF CONTROL IN
WATERSHEDS
Tese de Doutoramento em Ciências Agronómicas e Florestais
Daniela Patrícia Salgado Terêncio
Orientador: Prof. Doutor Luís Filipe Sanches Fernandes Coorientador: Prof. Doutor Fernando António Leal Pacheco
Coorientador: Prof. Doutor Rui Manuel Vitor Cortes
O trabalho foi realizado no âmbito da bolsa BI/UTAD/INTERACT/BEST/212/2016 financiada pelo projeto INTERACT – Integrative Research in Environmental, Agro-Chain and Technology, nº da operação NORTE-01-0145-FEDER-000017, na sua linha de investigação intitulada BEST, co-financiado pelo Fundo Europeu de Desenvolvimento Regional (FEDER) através do NORTE 2020 (Programa Operacional Regional do Norte 2014/2020). O autor deste trabalho é membro do CITAB - Centre for the Research and Technology of Agro-Environmental and Biological Sciences, financiado por Fundos Nacionais através da FCT – Fundação para a Ciência e a Tecnologia, no âmbito do projeto UIDB/04033/2020.
As doutrinas apresentadas nesta Tese de Doutoramento são da inteira responsabilidade do autor. Esta Tese de Doutoramento atende as normas técnicas e científicas exigidas pelos regulamentos em vigor da Universidade de Trás-os-Montes e Alto Douro.
“Water is the driving force of all nature”
Leonardo da Vinci
Agradecimentos
Muitas foram as pessoas que, científica e pessoalmente, contribuíram para a realização desta tese. Por isso, gostaria de lhes deixar o meu mais sincero agradecimento.
Ao Magnífico Reitor da Universidade de Trás-os-Montes e Alto Douro, Professor Catedrático António Augusto Fontainhas Fernandes, por permitir a realização desta tese.
Ao INTERACT pelo financiamento da minha bolsa de investigação, no qual esta tese se enquadra.
Ao Professor Doutor Luís Filipe Sanches Fernandes agradeço ter-me proporcionado a oportunidade de iniciar este percurso científico e incentivado a continuá-lo. Agradeço ainda a confiança que em mim depositou e todo o apoio que me deu ao longo destes anos.
Ao Professor Doutor Fernando Pacheco agradeço todo o incentivo, o enorme apoio, ajuda e todo o conhecimento transmitido, pois sem esse acompanhamento a realização deste trabalho não seria possível. Além disso, agradeço-lhe também pela sua amizade.
Ao Professor Doutor Rui Cortes pelo seu conhecimento, pela orientação deste trabalho, profissionalismo, competência, e por toda a ajuda e disponibilidade, muito obrigada.
Ao Professor Doutor José Lousada, agradeço a disponibilidade e prontidão com que sempre respondeu às minhas questões, pelos conselhos, pelo apoio e incentivo que me deu ao longo destes anos.
Ao Professor Doutor José Tadeu Aranha agradeço toda a disponibilidade e conhecimentos transmitidos que foram essenciais para a elaboração deste trabalho.
Aos meus amigos de Mirandela e de Vila Real. O meu mais sincero obrigada. Obrigada pela presença constante pelo enorme apoio e amizade, sem vocês teria sido muito mais difícil.
Por último, à minha família, a Salgado Terêncio e a Alves Rebelo, por todo o amor, apoio e paciência prestados que mesmo nos piores momentos nunca deixaram de
me consolar. Em especial ao meu Daniel e aos meus gatinhos por todo o carinho, amor, companheirismo e apoio incondicional que sempre me ofereceram.
E a todos os que de algum modo contribuíram para o sucesso deste trabalho, e que devido a possíveis lapsos não estão aqui referidos, sendo igualmente merecedores do meu reconhecimento.
Abstract
Pressure on water resources have been increasing over time, due to external forces such as population growth, irregular distribution, water waste, aquifer contamination and also climate change. Global climate change is expected to intensify current and future tensions over water resources and will increase the frequency and intensity of droughts and floods. Thus, in addition to extreme events such as floods and droughts, water quality and forest fire problems are also a concern. Therefore, some methodologies have been tested to improve, mitigate or help better management and planning of water and thus combat these water-related problems.
In Chapter 1, a brief introduction is made about pressures on the water resources and their consequences for the environment and society, while some solutions are suggested.
An improved framework model to allocate optimal rainwater harvesting sites in small watersheds for agro-forestry uses is presented in Chapter 2. The developed model aims to select optimal RWH sites based on a multi-criteria analysis involving physical, socio-economic and ecologic parameters. The choice of specific socio-socio-economic parameters allowed the selection of optimal places away from urban centres or large farming areas, which prevent the use of stream water with excessive anthropogenic nutrients in irrigation that may cause accumulation of nitrosamines in the food chain with severe consequences to human health.
Chapter 3 discusses rainwater harvesting in catchments for agro-forestry uses: A study focused on the balance between sustainability values and storage capacity. This model follows the line of the previous chapter, but was significantly improved. In this case, attention was paid to the balance between sustainability values and storage capacity of RWH systems. The study aimed at ranking 384 rainfall collection sub-catchments as regards installation of RWH sites for crop irrigation and forest fire combat. The practice of RWH at the catchment scale is frequently concerned with ecological sustainability values, namely through the aesthetic landscape enhancement. To naturally cope with these values, RWH infrastructure (dam wall) heights must not exceed ≈3 m. The results showed that more engineered dams may not always ensure all sustainability values but warrant much better storage.The limiting parameter was the dam wall height, because
217 sub-catchments were found to drain enough water for irrigation and capable to store it if proper dam wall heights were used.
Chapter 4 argue about flood risk attenuation in critical zones of continental Portugal using sustainable detention basins. Within the framework of Directive 60/2007/EC (Floods Directive), Flood Risk Management Plans were developed for 23 critical flood risk zones identified in Portugal, capable to eliminate the high and very high flood risk areas instead of attempting to ensure full control of the flood in all potentially threatened areas. The results showed that the number of sustainable detention basins is reduced by about 30% when the full flood control model is used. Although the results indicate the possibility of installing more unsustainable than sustainable detention basins, in all critical areas, only three do not provide sustainable solutions. Therefore, in these critical areasthe construction of highly designed structures would be mandatory.
“Can Land Cover Changes Mitigate Large Floods? A Reflection Based on Partial Least Squares-Path Modeling” was a question we tried to answer in Chapter 5. The aim was to verify, using a Partial least Squares-Path Model (PLS-PM), if changes in specific catchment variables, such as forest occupation or imperviousness of urban areas, would result in lower dam heights. In some realistic scenarios, the forecasted changes comprised 30% increase in forest areas or 30% decrease in impervious urban areas. Other purely academic scenarios were also tested, comprehending, for example, the duplication of forest areas or the reduction of catchment slope. In all cases, however, the dam wall heights did not fall significantly and remained very high. Therefore, the answer to the initial question is that non-structural measures may not always be an efficient way to reduce stream flows in a manner that flood detention can be achieved through construction of sustainable dam structures.
Finally, in Chapter 6, the general conclusions and future perspectives were presented.
Keywords: Rainwater harvesting; Geographic Information System; Spatial multi criteria analysis; Agro-forestry uses; Storage; Flood risk attenuation; Detention basin; Watershed management; PLS-SEM; Landscape change.
Resumo
As pressões sobre os recursos hídricos têm aumentado ao longo do tempo, devido a forças externas como crescimento populacional, distribuição irregular, desperdício de água, contaminação de aquíferos e também devido às alterações climáticas. Estas alterações, a nível mundial tendem a intensificar as tensões atuais e futuras sobre os recursos hídricos e aumentar a frequência e a intensidade de secas e inundações. Assim, além destes eventos extremos, a qualidade da água e os problemas com incêndios florestais também são uma preocupação. Portanto, algumas metodologias foram testadas para mitigar ou melhorar a gestão e planeamento hídrico e, assim, combater esses problemas relacionados à água.
No capítulo 1, é feita uma breve introdução relacionada com as pressões exercidas sobre os recursos hídricos e suas consequências para o meio ambiente e a sociedade, enquanto algumas soluções são sugeridas.
Um modelo que permite encontrar locais ótimos para aproveitamento de água da chuva em pequenas bacias hidrográficas para usos agroflorestais é apresentado no Capítulo 2. O modelo desenvolvido visa selecionar locais ótimos de Aproveitamento de Águas Pluviais (AAP) com base numa análise multicritério através de parâmetros físicos, socioeconómicos e ecológicos. A escolha de parâmetros socioeconómicos específicos permitiu a seleção de locais ótimos fora dos centros urbanos ou grandes áreas agrícolas, que impedem o uso de água com excesso de nutrientes de origem antropogénica na irrigação, que podem causar acumulação de nitrosaminas na cadeia alimentar, com graves consequências para a saúde humana.
O capítulo 3 discute a captação de água da chuva em bacias hidrográficas para uso agroflorestal: um estudo focado no equilíbrio entre valores de sustentabilidade e capacidade de armazenamento. Este modelo segue a linha do capítulo anterior, mas foi significativamente aprimorado. Nesse caso, foi dada atenção ao equilíbrio entre os valores de sustentabilidade e a capacidade de armazenamento dos sistemas de AAP. O estudo teve como objetivo classificar 384 sub-bacias de captação de precipitação no que diz respeito à instalação de locais de AAP para irrigação de culturas e combate a incêndios florestais. A prática de AAP à escala da bacia hidrográfica preocupa-se frequentemente com os valores da sustentabilidade ecológica, nomeadamente através da melhoria da
paisagem envolvente. Para lidar naturalmente com esses valores, as alturas das infraestruturas de AAP (altura do paramento da represa) não devem exceder ≈3 m. Os resultados mostraram que barragens maiores nem sempre garantem todos os valores de sustentabilidade, mas garantem um armazenamento muito melhor. O parâmetro limitante foi a altura da represa, porque 217 sub-bacias captavam água suficiente para irrigação e eram capazes de armazená-la desde que fossem selecionadas as alturas adequadas da infraestrutura.
O capítulo 4 discute a atenuação do risco de inundação em zonas críticas de Portugal continental, usando bacias de retenção sustentáveis. No âmbito da Diretiva 60/2007 / CE (Diretiva de Inundações), foram desenvolvidos Planos de Gestão de Risco de Inundação para 23 zonas críticas de risco de inundação identificadas em Portugal, capazes de eliminar as áreas de alto e muito alto risco de inundação, em vez de tentar garantir o controle total de inundação em todas as áreas potencialmente ameaçadas. Os resultados mostraram que o número de bacias de retenção sustentável é reduzido em cerca de 30% quando o modelo completo de controle de inundação é usado. Embora os resultados indiquem a possibilidade de instalar mais bacias de retenção não-sustentáveis do que sustentáveis, em todas as zonas críticas, apenas três não fornecem soluções sustentáveis. Portanto, nessas zonas críticas, a construção de infraestrutura altamente projetadas seria a única solução.
“As alterações do uso do solo podem atenuar grandes inundações? Uma reflexão baseada na modelação de PLS-PM” foi uma pergunta que tentamos responder no capítulo 5. O objetivo era verificar, se alterações em variáveis específicas da bacia hidrográfica, como ocupação florestal ou impermeabilização de áreas urbanas, resultaria em menores alturas de barragens, utilizando um modelo de PLS-PM (Partial Least Square - Path Modeling). Em alguns cenários realistas, as alterações previstas incluíram aumento de 30% nas áreas florestais ou redução de 30% nas áreas urbanas impermeáveis. Também foram testados outros cenários puramente académicos, compreendendo, por exemplo, a duplicação de áreas florestais ou a redução do declive da bacia hidrográfica. Em todos os casos, no entanto, a altura da represa não desceu significativamente, permanecendo muito alta. Portanto, a resposta para a pergunta inicial é que as medidas não estruturais nem sempre podem ser uma resposta eficiente na redução dos escoamentos, assim sendo, a retenção da água que provoca inundações pode ser feita através da construção de barragens sustentáveis.
Finalmente, no capítulo 6, foram apresentadas as conclusões gerais e as perspetivas futuras.
Palavras-chave: Aproveitamento de águas pluviais; Sistemas de Informação
Geográfica; Análise espacial multicritério; Utilizações agroflorestais; Armazenamento; Atenuação do risco de inundação; Bacia de retenção; Gestão de bacias hidrográficas; PLS-SEM; Mudança de paisagem.
Table of Contents
Agradecimentos ... i
Abstract ... iii
Resumo ... v
List of Acronyms and Abbreviations ... xvii
Chapter 1 - General Introduction and Objectives ... 1
1.2. Water availability ... 3
1.3. Water demand and use ... 5
1.4. Pressures on water resources ... 9
1.4.1. Water quality pressures ... 10
1.4.2. Hydromorphological pressures ... 11
1.4.3. Quantitative pressures ... 11
1.4.4. Climate change influence ... 12
1.4.5. Water-related Hazards ... 13
1.6. Study aim ... 24
References ... 24
Chapter 2 – Improved framework model to allocate optimal rainwater harvesting sites in small watersheds for agro-forestry uses ... 53
2.2. Introduction ... 55
2.3. Materials and Methods ... 57
2.3.1. Study Area ... 57
2.3.2. Framework model design ... 59
2.3.3. Model development ... 61
2.3.4. Database preparation ... 66
2.4. Results and discussion ... 68
2.4.1. Hydrographic basin and irrigation project selected to test the framework model ... 68
2.4.2. Outcomes from the planning and allocation workflows ... 68
2.4.3. Suitability analysis ... 73
2.5. Conclusions ... 76
References ... 77
Chapter 3 – Rainwater harvesting in catchments for agro-forestry uses: a study focused on the balance between sustainability values and storage capacity ... 107
3.1. Abstract ... 109
3.2. Introduction ... 109
3.3.1. Study area ... 112 3.3.3. Model development ... 119 3.3.4. Database preparation ... 121 3.4. Results ... 123 3.4.1. Planning workflow ... 123 3.4.2. Application settings ... 127 3.4.3. Allocation workflow ... 127 3.5. Discussion ... 129
3.5.1. Modeling results and comparison with previous studies ... 129
3.5.2. Sustainability ... 134
3.6. Conclusions ... 136
Supplementary data ... 136
References ... 137
Chapter 4 – Flood risk attenuation in critical zones of continental Portugal using sustainable detention basins ... 165
4.1. Abstract ... 167
4.2. Introduction ... 167
4.3. Study area ... 171
4.4. Materials and methods... 177
4.5. Results ... 180
4.6. Discussion ... 186
4.7. Conclusions ... 191
Supplementary Materials ... 192
References ... 192
Chapter 5 – Can Land Cover Changes Mitigate Large Floods? A Reflection Based on Partial Least Squares-Path Modeling ... 221
5.1. Abstract ... 223
5.2. Introduction ... 223
5.3. Materials and Methods ... 226
5.3.1. Study Area ... 226
5.3.2. Workflow... 230
5.3.3. Partial Least Squares-Path Modeling ... 230
5.3.4. Data Preparation ... 232
5.3.5. Scenario Analysis ... 234
5.5. Results ... 234
5.5.1. General Description of Spatial Data ... 234
5.5.2. Results of Partial Least Squares-Path Modelling ... 239
5.6. Discussion ... 242
5.7. Conclusions ... 245
Supplementary Materials ... 246
References ... 246
Chapter 6: General Conclusions and Future Perspectives ... 275
General conclusions ... 277
Future works ... 279
Annexes ... 283
List of Figures
Figure 1. 1 - Global water demand by sector until 2040. Source: IEA (2016). ... 6
Figure 1. 2 - Total annual use of water resources in Mainland Portugal and its distribution by
sector (INE, 2011). ... 9
Figure 1. 3 - Territorial extent of weather drought in hydrological year 2017/2018 (% of mainland
Portugal by PDSI index class) Source: IPMA, 2019. ... 18
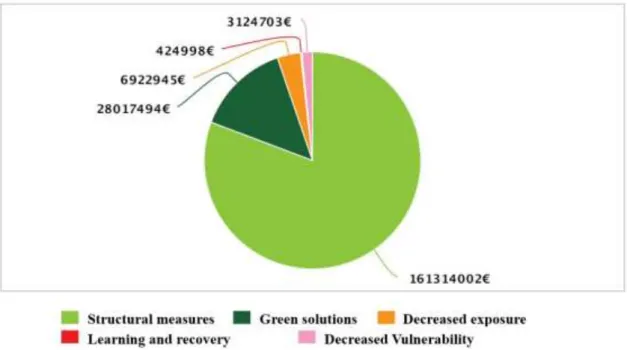
Figure 1. 4 - Type of measures aiming at preventing floods and reducing the catastrophic effects
they cause. Source: APA, 2019. ... 20
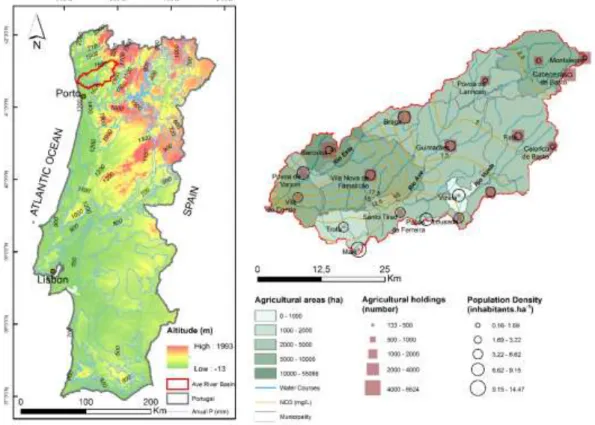
Figure 2. 1 - The left-hand side portrays the location, digital elevation model and average
precipitation contours (mm.y-1) of continental Portugal, as well as the location of Ave River basin
in the north of this country. The right-hand side illustrates a blow up of Ave River basin where a list of items are represented: municipality limits and their population densities, drainage network with labels on main water courses (Ave River as well as Este and Vizela tributaries), areas occupied by agriculture and number of holdings in each municipality, and average nitrate contours in stream water. ... 58
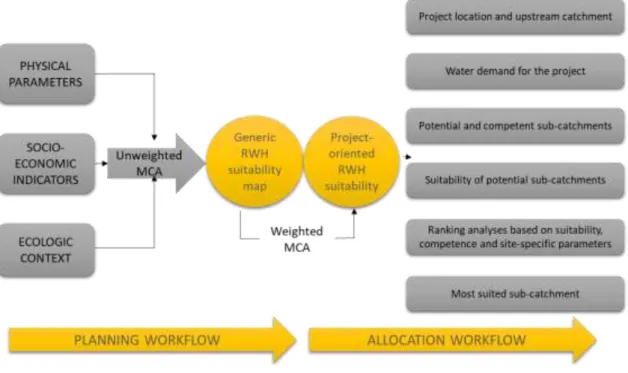
Figure 2. 2 - Rainwater harvesting (RWH) suitability model, comprising the planning and
allocation workflows. Details on the model are provided in the text. ... 60
Figure 2. 3 - Flowchart describing the spatial Multi Criteria algorithm embedded in the RWH
suitability model (Figure 2.2). ... 65
Figure 2. 4 - Spatial distribution of suitability attributes, used in the planning workflow of Figure
2.2. ... 69
Figure 2. 5 - RWH suitability maps as determined from the unity (a – generic map) and
project-dependent (b – project-oriented map) weights used in the spatial Multi Criteria Analyses (Figure 2.3). ... 70
Figure 2. 6 - Allocation map indicating: (a) the rainfall collection area and the application area
(irrigation project); (b) the best suited sub-catchment to install a rainwater harvesting site. ... 71
Figure 3. 1 - Location, topography, drainage network and precipitation contours in the vicinity
of the study area (Sabor River basin, Portugal). ... 113
Figure 3. 2 - Rainwater harvesting (RWH) suitability model, comprising the planning and
allocation workflows. The details on the model are provided in the text. Adapted from Terêncio et al. (2017). b – Flowchart describing the spatial Multi Criteria algorithm embed in the RWH suitability model (Figure 3.2a). Adapted from Terêncio et al. (2017). ... 115
Figure 3. 3 - Spatial incidence of arable land (3a), forests (3b), legally protected areas and burned
areas (3a, 3b) in the Sabor River basin. ... 124
Figure 3. 4 - Spatial distribution of suitability attributes, used in the planning workflow of Figure
3.2a. ... 125
Figure 3. 5 - RWH suitability maps as determined from the unity (a – generic map) and
application-dependent (b – irrigation; c – wildfire combat) weights used in the spatial Multi Criteria... 126
Figure 3. 6 - Spatial distribution of application-oriented suitability (3.6a), long-term stream flow
(6b), and allocation parameters (3.6c, 3.6d), averaged within 384 sub-catchments. ... 128
Figure 3. 7 - Results of ranking analysis, considering the building of 3, 6 and 12 meter high dam
walls and the application of harvested rainwater in irrigation and wildfire combat. ... 130
Figure 3. 8a - Spatial distribution of irrigable areas supplied by a 3 meter high dam reservoir. b
– Histogram of irrigable areas supplied by a 3 meter high dam reservoir. ... 132 Figure 3. 8b – (continued). ... 133
Figure 4. 1 - Workflow comprising study motivation, flood risk attenuation model and
management guidelines and forecasts. ... 171
Figure 4. 2 - Spatial distribution of hydrographic regions and flood risk critical zones of
continental Portugal. ... 172
Figure 4. 3 - Spatial incidence of flood risk classes in a specific critical zone (Tomar). The
proposed flood risk attenuation approach aims to prevent the flooding in areas of high and very high risk. ... 174
Figure 4. 4 - Ranges of dam wall height of detention basins as calculated for specific sites in the
critical zones as function of retained storm water volume and site topography... 183
Figure 4. 5 - Spatial distribution of dam wall heights. The capital letters identify the 23 critical
zones. ... 184
Figure 4. 6 - Spatial distribution of agricultural areas, burned areas and wildfire risk map, in
continental Portugal. ... 189
Figure 5. 1 - Spatial distribution of flood risk critical zones of continental Portugal. ... 227
Figure 5. 2 - Conceptual workflow. The detailed explanation is provided in the text. ... 230
Figure 5. 3 - Example of a PLS-PM Design. Symbols: MV—measured variables; LV—latent
variables; w—weights; l—loadings; PC—path coefficients; R2—coefficient of determination. ... 231
Figure 5. 4 - Spatial distribution of Watershed Characteristics. Only the variables used in the
PLS-PM analyses are represented, namely: (a) CN – curve number; (b) drainage density; (c) terrain slope; (d) maximum watershed elevation; (e) KC - compactness coefficient; (f) KF – shape
coefficient. ... 236
Figure 5. 5 - Spatial distribution of Land Use and Geology parameters. Only the variables used
in the PLS-PM analyses are represented, namely: (a) IMD- Imperviousness ratio; (b) percentage of agricultural area in watershed; (c) percentage of forest area in the watershed; (d) percentage of sedimentary rocks area in the watershed; (e) percentage of igneous rocks area in the watershed. ... 236
Figure 5. 6 - Spatial distribution of climate indicators. Only the variables used in the PLS-PM
analyses are represented, namely: (a) rainfall erosivity; (b) annual rainfall; (c) mean annual temperature. ... 237
Figure 5. 7 - Spatial distribution of Surface Runoff. Only the variables used in the PLS-PM
analyses are represented, namely: (a) Surface flow expressed as total surface discharge (m3/s); (b)
surface runoff expressed as surface discharge normalized by catchment area... 238
Figure 5. 8 - Spatial distribution of dam wall height. ... 238
Figure 5. 9 - PLS-Path Model used in the present study to set up causal effects between watershed
List of Tables
Table 1. 1. Example quantitative pressures and their impacts (IMPRESS, 2002).... 12
Table 1. 2 - Type of natural disasters in Portugal by type of damage occurred (adapted from
EM-DAT, 2018). ... 15
Table 2. 1 - Parameterization of Multi Criteria Analysis (MCA): explicative factors, assembled
by groups and divided into classes with predefined suitability scores; Boolean constraints, scored as “no data”; weights of factors and groups of factors (values inside brackets), as adopted in the project-oriented MCA. ... 62
Table 2. 2 - Summary of datasets used in the Multi Criteria Analyses (MCA). The purpose of
MCA is to plan best locations for the installation of sustainable rainwater harvesting (RWH) systems in rural watersheds. The table columns include references to data types, uses in the MCA. data ownership and Internet availability. Websites were assessed in July 2016. Symbol description (institution names in Portuguese): APA – Agência Portuguesa do Ambiente; SNIRH – Sistema Nacional de Informação em Recursos Hídricos; DGT – Direção Geral do Território; INE – Instituto Nacional de Estatística; ICNF – Instituto da Conservação da Natureza e das Florestas. ... 67
Table 2. 3 - Results of ranking analysis. According to it, the sub-catchment best suited to install
a RWH system in the target catchment is sub-catchment 6 because it has been assigned the highest overall rating (sum of ratings = 19). ... 72
Table 3. 1 - Parameterization of Multi Criteria Analysis (MCA): explicative factors, assembled
by groups and divided into classes with predefined suitability scores; Boolean constraints, scored as “no data”; weights of factors and groups of factors (values inside brackets), as adopted in the agricultural application MCA. ... 116
Table 3. 2 - Parameterization of Multi Criteria Analysis (MCA): explicative factors, assembled
by groups and divided into classes with predefined suitability scores; Boolean constraints, scored as “no data”; weights of factors and groups of factors (values inside brackets), as adopted in the Forest application-oriented MCA. ... 122
Table 4. 1 - Flood events occurred in the critical zones of continental Portugal from 1865 to 2010.
Only the events that caused a negative impact have been included in the list. Besides the counting of flood events, the table also describes the number of dead, injured, missing, evacuated or homeless people. Source: http://riskam.ul.pt/disaster. ... 173
Table 4. 2 - Critical zone characterization. The equations describe fittings to scatter points
presented in the Supplementary Material (S1). The intercept-y in those equations is Q0 that defines the maximum Q for which the high and very high risk areas are not affected by 100 year return period floods. ... 175
Table 4. 3a - Data used in the flood risk attenuation model of critical zones of continental
Portugal. ... 181
Table 4. 3b - Sources and application of flood risk model data depicted in Table 4.1 (Acz, Qcz)
and Table 4.3a. ... 182
Table 4. 4 - Results of flood risk analysis, comparing the current flood risk attenuation approach
with the conventional full flood control approach. ... 185
Table 5. 1 - Minimum and maximum sub-basins heights distributed by Critical Zone. ... 227
Table 5. 2 - Characterization of the eight Critical Zones. ... 229
Table 5. 3 - List of measured variables used as source data for Partial Least Squares–Path
Modeling (PLS-PM). Besides identification of variables, their measurement units and description, the table contains indications about usage in the PLS-PM models and on the data sources. .... 233
Table 5. 4 - Results of scenario analysis in the 75 sub-basins of the eight critical flood risk zones.
List of Acronyms and Abbreviations
% Percentage °C Degree Celsius € Euro < Less than > Bigger than ≈ Approximately A AreaAPA Portuguese Environment Agency
APRI Preliminary Flood Risk Assessment
ARPSI Significant Potential Flood Risk Areas
asl. above sea level
AVE Average Variance Extracted
BEST Bio-Economy and Sustainability
BOD5 Biochemical Oxygen Demand
C runoff coefficient
CIS Community Importance Sites
CNGRI National Commission for Flood Risk Management
COD Chemical Oxygen Demand
CZ Critical zone
D Distance from the sub-catchment outlet to the application area
DEM Digital elevation model
DGT General Direction of the Territory
DRWH Domestic Rainwater Harvesting
DSR Daily Severity Index
e.g. for example
EU European Union
FAO Food and Agriculture Organization
FDB Flood Detention Basins
FRB Flood Retention Basins
FRMPs Flood risk management plans
FRMPs Flood Risk Management Plans
FWI Fire Weather Index
GIS Geographic Information Systems
H Dam wall height
ha Hectare
Hm3 Cubic Hectometers
HR Hydrographic Regions
ICNF Institute for Conservation of Nature and Forests ICNF Institute for Nature Conservation and Forests
IDF Intensity-Duration-Frequency
IMD Imperviousness index
Interact Integrative Research in Environment, Agro-Chain and Technology IPCC International Panel for Climate Change
IPMA Portuguese Institute for Sea and Atmosphere
IRWH in-field Rainwater Harvesting
Km Kilometers
l/ day liter(s) per day
LV Latent variables m - Meter mm Milimeter MV Measured variables NBS Nature-Based Solutions NDMA N-nitrosodimethylamine
NWRM Natural Water Retention Measures
OECD Organisation for Economic Co-operation and Development
P Precipitation
PA Protected Areas
PC Path coefficients
PDSI Palmer Drought Severity Index
PGRH HYDROGRAPHIC REGION MANAGEMENT PLAN
PGRI Flood Rich Management Plans
PLS-PM Partial Least Squares–Path Modeling
Q Stream flow
qs Specific discharge
RWH Rainwater Harvesting
SEM Structural Equation Models
SNIRH National Water Resources Information System
SPI Standardized Precipitation Index
SPZ Special Protection Zones
SWOT Strenghts, Weaknesses, Opportunities e Threats
T Temperature
TI Tabulate Intersection
UN United Nations
US$ United States dollar
V Volume
VIF variance inflation factors
w weight
WFD Water Framework directive
XRWH ex-field Rainwater Harvesting
yr Year
Preamble
The presented work was elaborated within the scope of a Research fellowship of the Interact Project (Integrative Research in Environment, Agro-Chain and Technology) within the BEST - Bio-Economy and Sustainability line, which aimed to respond to Task 1, entitled “Preserving Water Resources”, in particular in Project 1.1, called“ Agro-forestry pressures on catchments ”.
The study area of this Project was, in general, in mainland Portugal, priority given to Ave and Sabor river basins.
According to the research work developed, three scientific articles were published, with a fourth article being submitted and under review. In this way, the Thesis now presented is a compilation of the four scientific articles, a general introduction to the theme of the thesis and a chapter dedicated to the final conclusions.
1.1.Introduction
Freshwater is a precondition for human, animal and plant life. Water is also an indispensable resource for the economy and plays a fundamental role in the climate regulation cycle. However, it is often consumed irrationally, as if it were inexhaustible (EEA, 2018a). This valuable resource has been experiencing numerous anthropogenic pressures, which originate from fast population growth and urbanization, a change of consumption patterns as the living conditions improve, rainfall irregular distribution, water waste, variations in climate and pollution patterns (IPCC, 2014a; SIAM, 2002). All these pressures are caused by changes in the lifestyle of modern society by technological, industrial and agricultural advances. As a resource with such demand, it bears a huge environmental, economic and social importance.
1.2.Water availability
Although water is an abundant resource on our planet, the amount of freshwater available for human use is limited by the planet's natural conditions. In fact, of all water in the world, about 97.5% of the water is salty and only 2.5% is freshwater. Of this 2.5%, most (1.8%) is retained as ice in Antarctica, the Arctic and the glaciers and is not available for human use. Thus, the water needs of humanity and terrestrial ecosystems have to be
fulfilled through the remaining 0.7% of the planet's freshwater. This freshwater is available in underground aquifers, circulating in the atmosphere, in precipitation, stored in natural lakes, rivers and reservoirs (CNA, 2019).
Apart from the scarcity problems, the planet's water is not evenly distributed geographically. There is a discrepancy between the most populated and needy areas and the areas where water is most abundant. The main groundwater nature reserves stored in aquifers are in relatively sparsely populated areas. On the other hand, the large masses of cold freshwater are in the polar regions and it is essential for sea level maintenance and climate stability to remain as they are and it is unreasonable to rely on that water for human use (CDP, 2018; ONU and OMS, 2017).
Freshwater is very irregularly distributed on the Earth's surface, with 60% of available freshwater resources concentrated in less than ten countries: Brazil, Russia, China, Canada, Indonesia, USA, India, Colombia and the Democratic Republic of Congo (CNA, 2019). However, the variation of water availability in each country's territory can be significant, with countries having very humid but also very dry regions (e.g., Australia, Brazil and North America). In Portugal, the annual rainfall generally decreases from north to south. In addition to the spatial variation, it also varies markedly throughout the year (intra-annual or seasonal variation), with much precipitation being concentrated in a wetter semester. The spatial-temporal variation of precipitation is essentially replicated in the variation of runoff. Precipitation and runoff are also quite irregular between different years, with the occurrence of dry years and wet years (APA, 2018a; CNA, 2019)
In addition to scarcity and irregular distribution of water resources, there may be a lack of available freshwater at times when is needed, due to variations in rainfall and runoff in different seasons, with drier periods alternating with wetter periods. Extreme phenomena such as droughts and floods also contribute to the variability in water availability in many locations.
The huge increase of world’s population in recent decades has led to a dramatic increase in water consumption and consequently a decline in its availability. Over two billion people live in countries experiencing high water stress. Growing water stress indicates substantial use of water resources, with greater impacts on renewability and hence resource sustainability. Moreover, when accounting for variations in
season-to-season water availability, it is estimated that about two-thirds of the world's population (≈ 4 billion people) experience severe water scarcity for at least one month of the year (Hoekstra and Mekonnen, 2016). Other important issues are contributing to water stress, such as the physical water stress that does not take into account the economic water scarcity. In this case, access to water is not limited by the number of existent water resources, but by the lack of infrastructures capable to collect, transport and treat water for human purposes (UN-WATER, 2019). Levels of physical water stress are likely to increase as population and associated demand for water grow, and the effects of climate change intensify (UN-WATER, 2018). Climate change and increasing climate variability are also likely to vary at the local and basin scales and over different seasons.
1.3. Water demand and use
Population growth is one of the most responsible drivers for increasing water demand, both directly (e.g., for drinking water, sanitation, hygiene and domestic use) and indirectly (e.g., through growing demands for water-intensive goods and services, including food and energy) (UN-WATER, 2019). In June 2017, the global population reached 7.6 billion people and is expected to reach about 8.6 billion by 2030 and to rise further to 9.8 billion by 2050 (UNDESA, 2017).
Driven by a combination of population growth, socio-economic development and changing consumption patterns, water use has been increasing worldwide by about 1% per year over the last few decades (AQUASTAT website, 2016; WWAP, 2016). Agriculture (including irrigation, livestock and aquaculture) is already the world’s largest water user, accounting for approximately 70% of total global freshwater withdrawals and up to 85% in some developing countries. This Global water demand is expected to continue increasing at similar rate until 2050, accounting for an increase of 20 to 30% above the current level of water use. Although the share of agricultural withdrawals is projected to decline slightly over the period until 2040, on the other hand projected increases in demand from the industrial and domestic sectors are expected (Burek et al., 2016; IEA, 2016a; OECD, 2012). The UN Sustainable Development Goal 6 (SDG 6) aims to ensure the availability and sustainable management of water and sanitation for all. The quest of this goal is likely to increase domestic demand and the energy and infrastructure necessary to provide it (IEA, 2016b), especially in the developing countries. Water availability for agriculture production and water quality are major concerns in
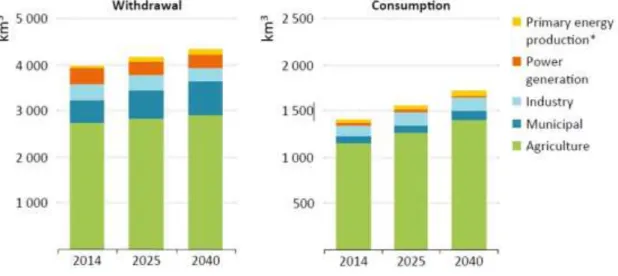
Europe. Water shortage is already limiting crop productivity in some regions. With climate change, negative effects or water shortages will worsen and affect larger areas. The environmental challenge is significant because water quality is under continuous threats related to unsuitable practices and overuse. Furthermore, although agriculture is a major user of water, other uses strongly compete for this natural resource (EIP-AGRI, 2018). Agriculture’s share of total water use is therefore likely to fall in comparison with other sectors, following 2040, as already mentioned, but will keep the status of largest user of all in the coming decades, both in terms of water withdrawals and water consumption (Figure 1.1).
Figure 1. 1 - Global water demand by sector until 2040. Source: IEA (2016).
In Europe, water is generally used unsustainably. In Northern Europe, the main problem is water quality, not water quantity. These problems are related with insufficient treatment of domestic sewer and diffuse sources of pollution, such as tressing of commercial fertilisers or manures. To initiate a combat to this problem the European Union forced the European countries to implement the Water Framework Directive (E.C.60 / 2000). On the other hand, in southern Europe water shortages are a major issue. The Mediterranean landscape as a whole is ecologically fragile and seriously threatened by prevailing social and economic trends (WWAP, 2016). In this respect the future of the region may be threatened by increasing pressure on coastal areas, expanding differences between tourist areas and rural inland areas, through serious competition for water resources, high susceptibility to pollution and sensitivity between the balance of water and soil. The soils in this region are extremely vulnerable to erosion, with resulting problems in maintaining water resources (sedimentation in reservoirs, bed stability,
etc.)(Jiménez Cisneros et al., 2015). Most of the population in Europe is concentrated near or in the coastal area itself, and growing tourism in the southern areas causes a strong seasonal demand for freshwater. Thus, unequal demand for water, both in space and time, increases the cost of making water accessible. Wastewater management problems increase with urban population expansion during the summer and effluents cause deterioration of coastal water quality. Overall, European water resources appear to be under severe physical, social, economic and environmental pressure (Karavitis, 2009).
The total use of water for urban purposes in Europe is estimated at about 53,294 Hm3 / year, which corresponds to 18% of the total extraction and 27% of consumption uses. Most urban water consumption is for domestic use. Most of the water used in homes is for flush toilets (33%), bath and shower (20 – 32%) and washing and dishwasher (15%). The proportion of water used for cooking and drinking (3%) is minimal compared to other uses (UN-WATER, 2019).
From the available data sources, a clear distinction between urban and tourist uses is not possible. Tourism puts a wide range of pressures on local environments. The impact on tourism (total and peak-volume) of water may conflict with other needs, especially in regions where water resources are scarce in the summer, competing with other sectors of the economy such as agriculture and forest. Uncontrolled tourism development, typical in recent decades, has led to degradation of the quality of the environment, particularly in coastal and mountainous areas. Tourist use of water is generally higher than that of the resident population. A tourist consumes about 300 l/ day, while European domestic consumption is around 150-200 litres. In addition, recreational activities such as swimming pools, golf and water sports increase the pressures on water resources. In addition, significant fluctuations in water supply, both monthly and annually, can cause shortages (EEA, 2019).
Total water use for industrial purposes in Europe is 18% of its water consumption, which has been declining due to declining industrial production, use of more efficient technologies with fewer water requirements and use of economic instruments. Forecasts of industrial water use in Europe generally show a declining trend due to increased efficiency in industrial processes, increased water reuse and the decline of resource-intensive industries in Europe (EEA, 2018b).
Water abstracted for energy production is considered non-consumer use and represents about 30% of all uses in Europe. In general terms, most of the water extracted by industries is used for cooling. However, cooling water is usually returned to the water cycle without change, apart from a rise in temperature and some possible biological contamination (IEA, 2016b).
Over the past few decades, the trend in agricultural water use has been broadly increasing due to the increasing use of water for irrigation. However, during recent years in several countries, the growth rate has slowed. Overall, two trends can be distinguished. On the one hand, if production is reduced the demand for means of production, such as water, is logically bound to decrease. On the other hand, there may be a shift towards more profitable crops, which in southern climates often require irrigation. Perhaps the greatest potential for water saving in northern Europe lies in the reduction of water loss rates in distribution systems, particularly for home use. In Southern Europe, the biggest challenge lies in reducing losses in irrigation systems as well as moving towards less water-intensive but still profitable crops (EIP-AGRI, 2018; Karavitis, 2009).
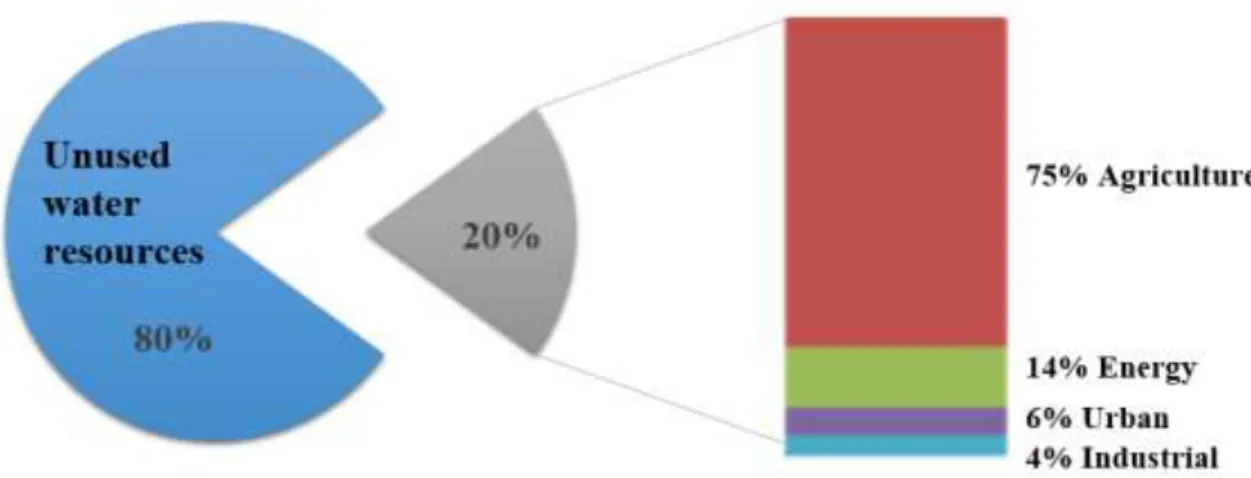
Accompanying the world trend, the main consumptive uses of water in Portugal include population supply, agriculture (irrigation and water for livestock) and industry, while hydroelectric production is the main non-consumptive use (CNA, 2019). The total uses by sector are depicted in Figure 1.2, which reveals agriculture as dominant sector, accounting for about 75% of all water uses, followed by energy production with 14%, water supply for populations with 6% and industry with 4%. It is also important to note that Portugal consumes annually just 20% of their freshwater resources, with a share of 75% for agriculture as mentioned. Given the large portion of unused water resources, it is feasible to question the occurrence of scarcity at the national and annual scales. However, the excess of resources only occurs in Winter time, when rainfall is more abundant and farmlands are not used for irrigated crops, being more expressive in the Northwest. The summer season brings a much different reality, with water deficits in the topsoil, reduced rainfall and large consumption of irrigation water, mostly in the South. Inevitably, this stresses the supply system, especially in the drier years. Eventually, the collection of winter rainfall in small catchments would help reducing this water management problem (INE, 2011).
Figure 1. 2 - Total annual use of water resources in Mainland Portugal and its distribution by sector (INE, 2011).
Irrigated crops are the most common in Portugal. This type of agriculture exerts strong pressure on the environment, especially on water quantity and quality. Rainfed crops are also important sources of food, but they do not ensure production requirements in spite of exerting less negative pressures on the environment. Thus, an improvement of water use efficiency in irrigated agriculture becomes necessary. The step to efficiently accomplish this outcome would be the implementation of planning and design programs for the allocation of small irrigation structure that would make water available when is needed. However, the public commitment to solve irrigation (and other) water related problems with small dams has not been consistent among successive governments, the reason why the problem persists (CNA, 2019; INE, 2011).
1.4. Pressures on water resources
The combination of both naturally occurring conditions and humanity’s actions creates pressure on the hydrosphere. Climate change and natural variability in the distribution and occurrence of water are the natural driving forces that complicate the sustainable development of global water resources. Pressures on water resources are increasing mainly because of human activity (e.g., urbanisation), population growth, increased living standards, growing competition for water and pollution (UN-WATER, 2006). This work will be focused the water quality pressures, quantity pressures and the climate change influence.
1.4.1. Water quality pressures
Although most people in Europe have access to good quality drinking water, in some parts the quality fails to meet basic biological and chemical standards (EEA, 2019). Almost all human activities can and do influence adversely water quality, expressed in the loss of pristine-quality water bodies, impacts associated with changes to hydromorphology, the rise of emerging pollutants and the spread of invasive species (UN-WATER, 2018), among others. Water quality is influenced by direct point source and/or diffuse pollution sources.
Point sources – Point sources are defined as stationary locations or fixed
facilities from which pollutants are discharged, and they represent a major pressure on water bodies of Europe (EEA, 2019). Effluent discharges from urban and industrial stations are main point sources and causes of water quality degradation (Garnier et al., 2013; Nyamangara et al., 2008). Discharge of urban effluents is known to contain higher organic loads, comparatively to industrial effluents (Hayet et al., 2016). However, even in industrial effluents it is possible to find high concentrations of organic compounds, namely from industries related to food production (Grizzetti et al., 2008; Serrano-Grijalva et al., 2011). High loads of heavy metals are also released from industrial activities such as mining (Sheoran and Sheoran, 2006) or metallurgic activities (Soares et al., 1999).
Diffuse pollution - Contrarily to point sources, diffuse pollution can be
caused by a variety of activities that have no specific point of discharge (APA, 2018a). Eventually, livestock production (Moss, 2008) and agriculture (Ayers and Westcot, 1985) are the most important diffuse threats to water quality, but urban land, forestry, atmospheric deposition and rural dwellings can also be relevant sources. Modern-day agricultural practices often require high levels of fertilizers, pesticides and manure, leading to high nutrient (e.g. nitrogen and phosphorus) surpluses that are diffusively transported through infiltration into groundwater and runoff into streams, rivers and lakes. These excessive nutrient concentrations in water bodies cause adverse effects by promoting eutrophication, oxygen depletion, the introduction of toxins or other compounds produced by plants, reduced water clarity. Ultimately, these adverse effects can lead to disastrous losses of plant and animal species in the riverine ecosystems (APA, 2018a). Excess nutrient levels can
also be detrimental to human health. The adverse impacts of all these agricultural pollutants are exacerbated by the use of water in crop irrigation because the liquid effect increases the concentration of pollutants in water bodies. The use of contaminated water in crop irrigation can also pose serious threats to human health related to the accumulation of nitrosamines in the food chain, which increases the risk of various types of cancer (EEA, 2018a; Nawrocki and Andrzejewski, 2011). According to the European Environment Agency, diffuse sources and hydromorphological pressures are the main pressures over water bodies in Europe. In Portugal, the second generation of River Basin Management Plans reinforce this idea, because they relate 38 % of Portuguese surface water bodies with significant pressures caused by diffuse sources (APA, 2018a).
1.4.2. Hydromorphological pressures
This type of pressure is associated with physical changes in drainage areas as well as in beds and banks of watercourses and estuaries, which have an impact on their morphological conditions and hydrologic regime (APA, 2018a). Human activities may cause severe hydromorphological pressures and changes on water bodies. Among the most impacting activities, agriculture, urban development, navigation, flood protection and defence, mineral extraction, energy production and recreational and leisure activities, may be referred to as prominent (UNESCO-WWAP, 2012). The pressures sourced from human activities, such as water storage, water transfer, channelization, deforestation of riparian buffer, all affect the physical habitat of terrestrial and aquatic life. These changes in the physical characteristics of water bodies’ shape, boundaries and content, may disrupt the suitable habitats for natural species to live healthily (APA, 2018a).
1.4.3. Quantitative pressures
Quantitative pressures relate to water harvesting activities for various purposes, namely for production of drinking water, irrigation or industrial activity (APA, 2018a). According to the Water Framework directive (WFD), quantitative status is only referred to specifically for groundwater bodies, but quantitative pressures must be assessed for all water bodies. For surface waters, these pressures are used to assess hydromorphological status. In all water bodies quantitative pressures are also important as they have an effect
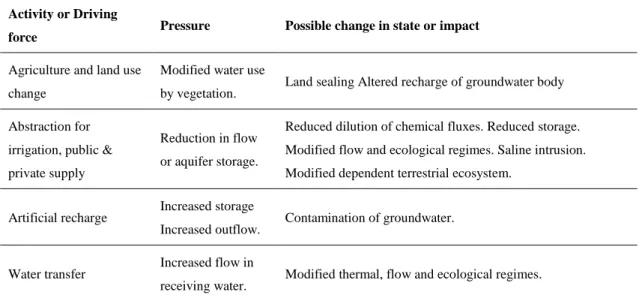
on dilution, residence time, and storage (IMPRESS, 2002). Examples of quantitative pressures are contained in Table 1.1.
Table 1. 1. Example quantitative pressures and their impacts (IMPRESS, 2002). Activity or Driving
force Pressure Possible change in state or impact
Agriculture and land use change
Modified water use
by vegetation. Land sealing Altered recharge of groundwater body Abstraction for
irrigation, public & private supply
Reduction in flow or aquifer storage.
Reduced dilution of chemical fluxes. Reduced storage. Modified flow and ecological regimes. Saline intrusion. Modified dependent terrestrial ecosystem.
Artificial recharge Increased storage
Increased outflow. Contamination of groundwater. Water transfer Increased flow in
receiving water. Modified thermal, flow and ecological regimes.
The quantitative pressures are associated with activities that draw water for various purposes, and the main pressures causing failure to achieve good quantitative status are water abstraction for public water supply, agriculture and industry (European Environmental Agency, 2018). In Portugal, the water volume used by the energy sector is very important, although being considered markedly non-consumptive, since it is mostly due to hydropower generation (above 99% of the total). The annual estimate of water used for electricity generation is 102 000 Hm3. However, given the fact of being a non-consumptive use, it was not considered as a quantitative pressure for the purpose of the analysis (Freire de Carvalho and Almeida, 2013).
Sustainable use of water from the quantitative standpoint is a real challenge for water resources management, given current and future uses and their combination with climate change scenarios (APA, 2018a).
1.4.4. Climate change influence
Climate change can influence pressures and water-related phenomena, as well as their spatial-temporal variations. Climate change may cause changes in the hydrological cycle and is likely to modify the environment, triggering various impacts and risks. Many impacts that occur because of climate change are water-related and can affect the amount and distribution of rainfall, stream flows, water levels and water temperature
(UN-WWAP, 2003; UNESCO, 2019). Even though water moves through the global hydrological cycle, it is a locally variable resource, and vulnerabilities to water-related hazards such as floods and droughts differ among regions (IPCC, 2014b). Traditional water systems were planned to also resist and recover from these extreme events. However, as the weather is changing extreme events are intensifying in some places and sometimes exert new and unexpected pressures on the existing water bodies (Bates et al., 2008; Jiménez Cisneros et al., 2015). These extreme hydrologic events gain potential to affect human security when combined with non-climatic drivers, such as population increase, new economic pressures on supplies, urbanization, land use or natural geomorphic changes and water contamination (UNESCO, 2019). Society is primarily impacted by climate change and climate variability through changes in the global and local water systems, which are also likely to vary at the local and basin scales and over different seasons. For the most part, however, wet regions and seasons become wetter and dry regions and seasons become drier, so climate change will likely exacerbate water stress in areas that are already the most affected (IPCC, 2014a). Hence, it is important and urgent to account climate change impacts on the water resources, but also to acknowledge the impact of humans on climate (UN-WWAP, 2003).
1.4.5. Water-related Hazards
Water-related hazards such as floods and droughts can affect water supply and sanitation infrastructure, leading to significant economic and social losses and impacts. Such hazards are projected to increase in frequency and intensity as result of climate change (UN-WATER, 2019). The short and long-term impacts of water-related extreme events pose both direct impacts (e.g., damage to buildings, crops and infrastructure, and loss of life and property) and indirect impacts (e.g., losses in productivity and livelihoods, increased investment risk, indebtedness and human health impacts). The increasing economic cost and toll of disasters should be a significant incentive for governments and humanitarian organizations to focus more attention on preparedness, prevention and evaluation of root causes of vulnerability (Mata-Lima et al., 2013; UN-WATER, 2019). The impacts and costs of these events are exacerbated by factors such as unplanned urbanization and degradation of ecosystem services. Reducing the risk to and improving the resilience of water and sanitation services will be the key to maintain access during a climatically uncertain future (UN-WATER, 2019).
According to the International Panel for Climate Change –IPCC (IPCC, 2012), the impact of climate change is expected to diverge from region to region and a few available studies suggest an increase of flood hazards in a vast portion (> 50%) of our planet. The frequency of floods in small river basins is very likely to increase. These predictions are not announced for larger watersheds because intense rainfall is commonly restricted to small areas. Spring snowmelt floods are likely to become scarcer, because less winter precipitation will fall as snow and more snow will melt during extensive Winter thaws. Worldwide, the damage from floods will increase because more people and more assets will be in harm’s way. The IPCC report also estimates for the end of the 21st-century that meteorological droughts (less rainfall) and agricultural droughts (drier soil) are projected to become longer, more frequent, or both, in some regions and some seasons, because of reduced rainfall, increased evaporation or both. However, it is still uncertain what these rainfall and soil moisture deficits mean for prolonged reductions of streamflow as well as of lake and groundwater levels (IPCC, 2014a).
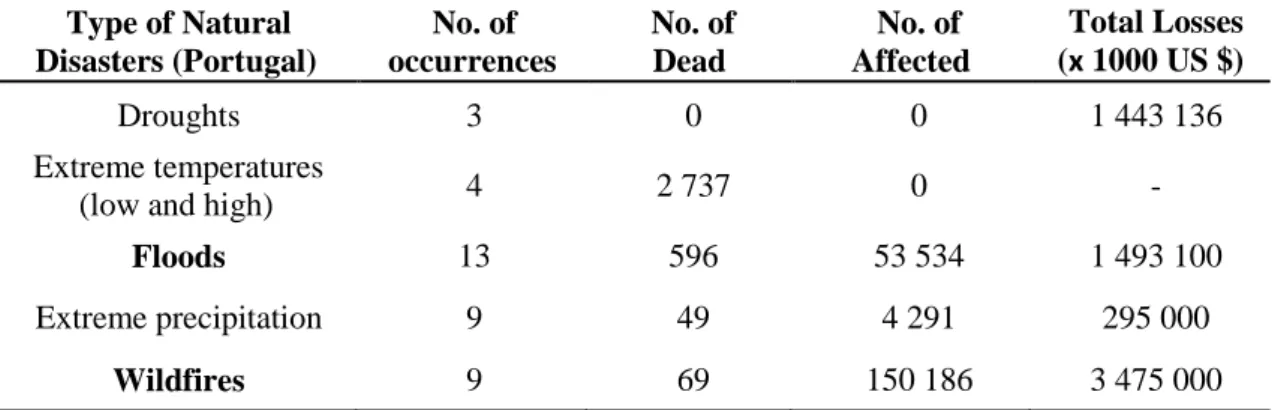
A considerable portion ( 90%) of natural disasters are water-related and the number of people affected as well as the damage resulting from these disasters continues to rise (CRED and UNISDR, 2019). The human cost of water-related disasters depends on multiple factors, including the type of hazard, its location, duration, and size of affected population (EM-DAT, 2018). In the period 1995–2015, floods around the planet accounted for 43% of all documented natural disasters, affecting 2.3 billion people, killing 157,000 more and causing US$662 billion in damage. Over the same 20-year period, droughts accounted for 5% of natural disasters, affecting 1.1 billion people, killing 22,000 more, and causing US$100 billion in damage (CRED and UNISDR, 2019; UNISDR, 2015). In Portugal, floods were the extreme events that have caused the largest impact in terms of occurrence over the 1900–2015 period (Table 1.2). Besides, these water-related events have caused a large number of deaths, while affecting a very large number of people through huge economic losses (EM-DAT, 2018). Droughts, despite of a scarce number of occurrences and absence of deaths and people affected, have caused huge losses mostly in the agricultural sector. Finally, forest fires were related to the largest number of people affected and economic losses.
Table 1. 2 - Type of natural disasters in Portugal by type of damage occurred (adapted from EM-DAT, 2018). Type of Natural Disasters (Portugal) No. of occurrences No. of Dead No. of Affected Total Losses (x 1000 US $) Droughts 3 0 0 1 443 136 Extreme temperatures
(low and high) 4 2 737 0 -
Floods 13 596 53 534 1 493 100
Extreme precipitation 9 49 4 291 295 000
Wildfires 9 69 150 186 3 475 000
Given the magnitude of damages usually caused by natural disasters, the societal adaptation to water-related changes should be a mandatory component of water resources plans and vice versa, meaning that no climate change adaptation plan should be developed without explicit consideration of water issues. This recommendation is especially pertinent in a scenario where global challenges related to water are increasing (UNESCO, 2019).
a) Drought
It is important to note that water scarcity and drought are distinct problems. While water scarcity refers to an imbalance between water demand and sustainable (long-term) supply, drought is generally defined as “an extended period – a season, a year, or several years – of scarce precipitation compared to the statistical multi-year average for a region that results in water shortage for some activity, group, or environmental sector” (ICID, 2017). Being inherently related with time, droughts are inevitably aggravated by climate change. According to the European Environmental Agency, climate change will in the future lead to increased intensity and frequency of droughts, aggravating water stress, particularly in the summer months (APA, 2018a; INE, 2011; IPCC, 2014a).
In general, droughts are understood as a transient physical condition, linked to more or less long periods of low rainfall, and to negative repercussions on the environment, ecosystems and socioeconomic activities including agriculture (APA, 2018a). Based on the effects of droughts, they can be classified as meteorological, agricultural and hydrological, not dissociated from their socioeconomic and environmental impacts (APA, 2018a; INE, 2011).
The meteorological drought is characterized by the lack of water induced by the imbalance between precipitation and evaporation, which depends on other elements such as wind speed, temperature, air humidity and sunshine. The weather drought also depends on location, because weather conditions that result in rainfall deficiencies may differ greatly from region to region (CRED UNISDR, 2019).
The agricultural drought is linked to the lack of water caused by a disproportion between available water in the soil, the requirements of crops and the respiration of plants. This type of drought is related to the characteristics of the crops and natural vegetation (ICID, 2017). Sometimes, the combination of weather drought and agricultural drought can occur, because there is a cause-effect relationship between them. Thus, the lack of water induced by the imbalance between precipitation and evaporation will have direct consequences on soil water availability and consequently on crop productivity (APA, 2018a).
In Portugal, the organization responsible for monitoring meteorological and agricultural droughts is the Institute for Sea and Atmosphere (IPMA). The indices used to perform the monitoring comprise the Palmer Index or PDSI (Palmer Drought Severity Index) and the SPI (Standardized Precipitation Index). The PDSI uses temperature, water capacity and precipitation data to estimate a relative dryness. The application of this index allows to detect the occurrence of drought periods and classifies them for intensity as follows: weak, moderate, severe and extreme (SIAM, 2002). The SPI is widely used to characterize meteorological droughts on a range of timescales, reflecting the impact of drought on water availability. The smallest scales, up to 6 months, refer to meteorological and agricultural droughts (rainfall and soil moisture deficit, respectively), while the timescales between 9 and 12 months refer to the hydrological drought with water scarcity reflected in runoff and reservoirs (Keyantash and NCARS, 2018).
The hydrological drought is associated with the status of storage in reservoirs, lagoons, aquifers and waterways in general. It is therefore related to the reduction of the average surface and underground water levels and the depletion of water in the soil. This type of drought is usually out of step with the weather drought, because longer periods are needed for precipitation deficiencies to manifest themselves in the various components of the hydrological system (CRED and UNISDR, 2019).
Portugal is characterized by inhomogeneous weather and hydrologic condition, which have a consequence on the spatial distribution of droughts. Usually, droughts are more frequently and severe in the northeast and south of the territory. The Portuguese Environment Agency (APA) through the monitoring of water bodies is responsible to evaluate the hydrological drought. The monthly evolution of reservoir storage levels, precipitation and runoff and their comparison with historical series allow to determine if there is hydrological drought (APA, 2018a). This data analysis is performed automatically by the APA, based on records from hydro meteorological networks of SNIRH – National Water Resources Information System. The SNIRH is an extremely important element for the control of existing water availability, and therefore can be used to evaluate the efficiency of planning and management initiatives. Simultaneously, it is an important source of hydrologic data currently available to any interested entity or the general public (APA, 2019).
The socioeconomic and environmental impacts of droughts are associated with the combined effect of natural and social impacts that result in water shortages due to the imbalance between demand and supply of water resources. More specifically, they represents the imbalance between natural rainfall, the climate system and human socioeconomic activities. Socioeconomic drought occurs when the decrease in water availability is so severe that it has negative consequences on people and economic activities, that is, on the society in general (APA, 2018a).
Droughts are quite frequent in mainland Portugal and generally result in serious consequences for agriculture and livestock, water resources and well-being of populations (APA, 2019). However, with regard to surface and groundwater availability as well as to potential and actual evapotranspiration in the country, consideration must be given to their spatial and temporal variability, because drought events may occur at different times and in different locations (APA, 2018a). It is also known for continental Portugal that severe and extreme droughts have a payback period of 10–15 years, last for 1 to 3 years and affect an important area of the country (Figure 1.3) (INE, 2011).
Figure 1. 3 - Territorial extent of weather drought in hydrological year 2017/2018 (% of mainland Portugal by PDSI index class) Source: IPMA, 2019.
b) Floods
Global water crises are not limited to droughts, but also include floods. Flooding is one of the most commonly occurring weather-related disasters, affecting billions of people worldwide. The Organisation for Economic Cooperation and Development (OECD) estimates that the number of people and the value of assets at risk from floods will be significantly higher in 2050, compared to present time. Furthermore, the increasing frequency and severity of extreme weather events continue to place additional pressure on water supplies worldwide (OECD, 2012; UNESCO, 2019; UNISDR, 2015).
The nature of disastrous floods has also changed in recent years, with flash floods, acute riverine and coastal flooding becoming increasingly frequent. In addition, urbanization has significantly increased flood runoffs, while recurrent flooding of agricultural land has taken a heavy toll in terms of lost production and food shortages (OECD, 2016; UNISDR, 2015).
The knowledge on the most significant floods and their impacts on human health, the environment, economic activities and heritage allows a set of measures that will lead to the reduction of the harmful consequences of flooding. Reducing the impacts or consequences will reduce the risk associated with flooding (APA, 2019).
Floods are the most common natural disasters that occur every year in Europe and account for the highest number of casualties and economic damage (APA, 2018b; Raadgever et al., 2014). In Portugal, floods are the second natural event that causes great damage or loss of life (EM-DAT, 2018). Since the 1990s, following severe floods in Portugal the Ministry of Environment has taken steps to reduce the vulnerability of