1
A Work Project, presented as part of the requirements for the award of a Masters Degree in Management from NOVA – School of Business and Economics
The Impact of Mandatory Adoption of the International Financial Reporting Standards on the Cost of Equity: Evidence from Angolan Banks
José Afonso Cunha Sales Portas Student Number 3400
A project carried out on the Master in Management Program, under the supervision of Professor Leonor Ferreira and Professor Fernando Cardoso
2
Abstract
In 2016, the Angolan banking sector mandatorily adopted the International Financial
Reporting Standards (IFRS). Its effects on the cost of equity, exceedingly high in Angolan banks
and a key variable to attract investors, are controversial, with some literature suggesting it decreases
after the adoption. This paper examines the impact of mandatory IFRS adoption on the cost of
equity, in Angolan banks in the period 2012-2016. The results show that the adoption of IFRS is
not relevant in explaining the cost of equity, on the short-term, contrary to other company-specific
variables, such as size, leverage, ROA, auditors’ opinion and ownership concentration.
Keywords: Angola, Banking sector, Cost of equity, IAS/IFRS, mandatory adoption
1. Introduction
Until 2014, Angola was one of the fastest-growing economies in Sub-Saharan Africa, with an
annual average Gross Domestic Product (GDP) growth of 10.3%. With oil representing around
75% of government revenue and 95% of all exports, the Angolan economy is highly dependent on
a single and volatile industry1. Recognizing that depending solely on oil is no longer a viable development option, the Angolan government is trying to strengthen other industries by attracting
foreign investment.
An attractive business environment is necessary, which is a challenge to Angola2. With corruption present in all levels of business and government3, there is low confidence in the markets, a high cost of capital and a severe lack of transparency. One way through which the government is
1 As a consequence of the sharp decline in oil prices, the whole economy suffered and the GDP fell 20%, in 2015
(Euromonitor International 2018).
2 According to the Ease of Doing Business Rankings of 2017, Angola ranked 175 out of 190 countries (The World
Bank 2018), being one of the most difficult countries to do business, in areas such as getting credit, trading across borders, enforcing contracts and resolving insolvency.
3 According to the Corruption Perception Index of 2017 (Transparency International 2018), Angola ranks 167 out of
3
trying to attract investors is by opening a stock market4 and adopting global accounting standards, the International Financial Reporting Standards (IFRS), in its banking sector, in 2016.
In current markets, most businesses and investors diversify their portfolios and expand
operations through cross-border investments. Hence, the demand for a set of universal standards,
to which all the participants in the market abide, has grown exponentially (Banco Nacional de
Angola 2014). The International Accounting Standards Committee (IASB) started in the early
2000s issuing a set of high-quality International Financial Reporting Standards (IFRS). By 2005,
most European countries and others around the world already required its use by financial
institutions. The IFRS Foundation’s goal is to provide “a high quality, internationally recognized
set of accounting standards that bring transparency, accountability and efficiency to financial markets around the world” (IFRS Foundation 2018). Transparency, by increasing comparability and quality of financial information; accountability, by providing investors with information on
how managers are handling their capital; and efficiency by reducing the cost of capital and
reporting costs. The mandatory adoption of IFRS in the Angolan banking sector arose from the
efforts the country is making towards positioning the banking sector as the “economy’s engine”,
as the governor of the Angolan National Bank, Banco Nacional de Angola (BNA), emphasized in
2017 (ANGOP 2017).
The economic effects of mandatory adoption of IFRS are a controversial subject, however.
There is still no consensus on its effects, among the accounting community. While some believe it
increases the transparency, quality and relevance of reported information, thereby enhancing
international investment and reducing the cost of capital (Ionasçu, et al. 2014), others defend that
the benefits of adopting new standards may not outweigh the costs (Thompson 2016). The impact
4
of adopting IFRS on the cost of equity, for example, is one of the most divisive subjects. A critical
variable for investors, this particular issue is of paramount importance in developing countries, in
which the cost of equity and the demand for foreign investment is higher and the capital markets
are less developed. Especially in Africa, the subject is even more undeveloped, as research on the
area is very scarce. Therefore, this paper fills this void by analyzing the impact of the IFRS adoption
on the cost of equity, in Angolan banks. It will help standard setters and decision makers in the
process of choosing whether to adopt IFRS.
This Work Project analyzes the evolution of the cost of equity in Angolan banks in order to
identify the country and the company-specific factors that may influence it, with a special focus on
the effects of the mandatory adoption of IFRS. The results of an ordinary least square (OLS)
regression model showed that the variables with greater influence on the cost of equity were the banks’ size, leverage, profitability, auditors’ opinion and ownership concentration. In contrast, the
adoption of IFRS, dividends, effective tax rate, auditor, managers’ independence and the
macroeconomic variables (GDP, inflation rate, free-interest rate and corruption index) did not
influence the cost of equity.
The paper is structured as follows: Section 2 introduces the theoretical framework regarding
the cost of equity and the contextual background concerning the banking sector and financial
reporting in Angola. Section 3 reviews the literature on the effects of the mandatory adoption of
IFRS, with special emphasis on the cost of equity. Section 4 outlines the research questions, the
research model tested in this research, the sample, and data. Section 5 presents and discusses the
results. Section 6 concludes with a summary of the main findings, contribution, limitations and
5
2. Theoretical Framework and Contextual Background
Cost of equity: concept, estimation and determinants
The cost of equity is the rate of return required by investors, for the capital they invest in a
company (Brealey, Myers and Allen 2010)5. Several models can estimate the cost of equity, each with its advantages and limitations. Among the models to estimate the cost of equity, are the Capital
Asset Pricing Model (CAPM), the Price Earnings Growth model (rPEG) and the Gordon’s
Dividend Growth model.
The CAPM calculates the cost of equity by adding the risk-free rate of return to the market risk premium, adjusted to the company’s sensitivity to the market, symbolized by beta6. However,
this model is not able to explain expected returns in detail or to capture both the firm and
market-specific risk, as it does not eliminate information asymmetry (Fama and French 1992). Moreover,
for the estimation of the beta, which is a risk measure of exposure to the market, a regression between the banks’ returns and the market is required, which is not available for Angolan banks.
Most researchers refer to the Price Earnings Growth model, rPEG, as the best proxy for the
cost of equity (Lee, Walker and Christensen 2008, Patro 2014, Castillo, Menéndez and Orgaz
2014). This model, developed by Easton in 2004, estimates the expected return, as perceived by the market, taking into consideration its perception of a firm’s risk, as well as the rate of change in
abnormal earnings growth (Easton 2004)7. The simplified formula for the model is presented in Appendix A. The use of this model requires earnings’ estimation, limiting its use when those
estimates do not exist. To the best of our knowledge, there is no previous application of the rPEG
5 This minimum threshold can be the cost of equity, cost of debt or weighted average cost of capital (WACC), whether
a company chooses to finance its operations through equity, debt or both, respectively.
6 Beta is calculated by dividing the covariance of the returns of a certain bank with the returns of the market by the
variance of the market returns.
7 The rPEG is an adaptation of the PEG model, by relaxing some of its assumptions and acknowledging the importance
6
model to Angolan companies, probably due to the lack of analysts’ short-term forecasts on their
earnings.
One approach to the estimation of the cost of equity that does not require any analyst estimation of future earnings is the Gordon’s Dividend Growth model, shown in Appendix B. In this model,
the value of a company is calculated by discounting the dividends expected for the following year
in perpetuity, using the cost of capital (Damodaran 2003). By rearranging the formula, the cost of
equity can be isolated but it can be only computed in firms that pay dividends.
In order to prevent skewing the sample by merely choosing banks that pay dividends, we will use an adjusted version of this model, based on earnings instead of dividends. Every year’s net
income can either be distributed to shareholders or retained by the company for reinvestment. The
original formula considers that the return for investors is restricted to dividends. However, very
often banks do not pay dividends but increase their equity by retaining earnings, which by itself
raises the value of the company. In our proposed adjusted version of the model, we consider that
the future payout to shareholders is accounted for in how much profit the bank is making each year:
𝑅𝑒 =𝐸𝑃𝑆0
𝐵𝑉 + 𝑔
[1]
In which, Re is the cost of equity; EPS0 are the earnings per share, in moment 0; BV is the book
value per share of each bank; g is the earnings growth rate. We calculate the expected growth rate
by averaging the historical growth rates and assuming it remains constant in perpetuity. The book
value is used, instead of the market value, because there is no stock market in Angola.
The cost of capital is also perceived by investors as a signal of a company’s risk, and it can be
derived from country-specific factors, such as political and economic conditions, or from
company-specific factors, such as size, profitability, leverage, dividends, enforcement quality and corporate
7
Contextual Background: The Angolan banking sector and its financial reporting
The fall in oil prices and fragility of the national currency caused the inflation rate to spike to
excessive levels8. In response, BNA increased the reference interest rates and mandatory reserves in national currency, from 25 to 30 percent. Though the Angolan economy is going through a phase
of stagnation, the banking sector continues growing and developing. In 2016, the electronic means
of payment, the number of Automated Teller Machines (ATMs), payment terminals, transactions, employees, counters, clients’ deposits, net income and assets increased, following the trend of the
previous five years (KPMG 2016). Recent developments that are influencing the industry are the overall increase in the population’s literacy and education, bringing new challenges to the market,
and the adoption of IAS/IFRS (Deloitte 2017).
In 2014, Banco Nacional de Angola (BNA), the governmental entity responsible for the
Angolan banking supervision, released a plan for the full convergence of the national accounting
systems to the IFRS. The national accounting system for banks (Plano Contabilístico das
Instituições Financeiras, CONTIF), was replaced in order to comply with the recommendations of international financial institutions and to improve the comparability and transparency of
information on a global scale (Banco Nacional de Angola 2014).
In a first phase, as part of the gradual adoption process, from 2016 onwards Angolan banks
that met at least one of the following five criteria were required to report under IFRS: (i) banks
with assets above 300,000 million Kwanzas; (ii) banks listed on the stock exchange; (iii) banks
with subsidiaries domiciled abroad; (iv) a subsidiary of a company domiciled abroad, with
headquarters in Angola; (v) subsidiaries of an institution that met any of the previous criteria. Any
8
bank that met at least one was obliged to report under IFRS9. Other banks could voluntarily report under IFRS, from January 2016 onwards (IFRS Foundation 2017). In the second phase, from 2017
onwards, the obligation to report under IFRS extended to all banks operating in Angola.
Acknowledging the predicaments banks would face when adopting the new standards, BNA also
released instructions on how to overcome them. It set a plan based on three main pillars: training
of employees, adaptation of control procedures and adequacy of information systems10.
This research analyzes periods in which it compares information reported under two different
accounting standards. Thus, it is important to highlight the key differences between them. As
required by IFRS 111, Angolan banks are obliged to make transitioning adjustments to their financial statements and report the previous year’s reconciliation of shareholders' equity and net
income, under the two methods. The two most relevant accounts in the adjustments were
Impairments and the Effective Tax rate12 (Deloitte 2017).
As it is shown in Appendix C, the total adjustments in the Angolan banks that adopted IFRS,
amounted to a decrease in Equity of 10 billion Kwanzas and a decrease in Net Income of 5 billion
Kwanzas, in 2015 (Deloitte 2017). However, these amounts only represent a decrease of 2.17%
and 4.27% of the values reported under CONTIF. These accounting changes bring implications to
the calculation of the cost of equity. As it is estimated by dividing EPS (Net Income) for the BV
(Equity), it is slightly lower under IFRS.
9 Before 2016, no Angolan bank applied IFRS in their financial reporting and only one bank (Banco Comercial Angolano) reported voluntarily in 2016.
10 Banco de Desenvolvimento de Angola and Banco de Poupança e Crédito, two state-owned banks, were required to
report under IFRS in 2016 but did not comply.
11 IFRS 1 - First-time Adoption of International Financial Reporting Standards.
12 In 2015, the adjustments to impairments had a negative impact of 6.823 and 4.186 million Kwanzas in the
Shareholder’s Equity and Net Income, respectively. The most significant effect of the effective tax rate adjustments was in customer loans, with a negative impact of 6.157 and 1.928 million Kwanzas in the shareholder’s equity and Net Income, respectively.
9
3. Literature Review
There is plenty of normative and empirical literature on the adoption of IFRS, but still no
consensus was achieved on whether its benefits outweigh the costs. This section reviews the stream
of literature regarding IFRS adoption and its impact on the cost of equity, as to understand the
implications of adopting these reporting standards.
There is controversy on whether international standards are applicable to developing countries,
which already struggle to sustain their own regional accounting standards (Thompson 2016). In
fact, some developing countries, which adopted the IFRS, suffered many institutional, enforcement
and technical challenges when implementing them (United Nations 2008). Institutional problems
happened, for example, in countries in which previous regulations that were not properly adjusted,
directly contradicted IFRS guidelines, often regarding the presentation of information13. Enforcement problems emerged mostly in countries with high corruption levels, in which the rule
of law was undermined by private interests. Technical problems were generally a result of language
barriers, increased costs in training and lack of expertise in the field of international standards, both
in the private sector and regulatory bodies14. Moreover, the impact of using IFRS goes beyond accounting, affecting all areas of business, such as tax, human resources and information
management (Deloitte 2008).
These complications make it even harder to collect any benefit from using global standards.
However, studies also show the adoption of such standards brings advantages to the economy, even
in developing countries. Regarding Foreign Direct Investment (FDI), several papers present
evidence that countries adopting IFRS often benefit from an increase of global investors’
13 In Pakistan, the surplus on revaluation of fixed assets was demonstrated after capital and reserves, which directly
contradicts IAS 16 directive to attribute it to equity.
14 In Kenya, IAS were implemented in 1999 but there is still a lack of professionals qualified on the field of IFRS
10
confidence in the financial statements which results in an increase of FDI inflows (Okpala 2012, Lungu, Caraiani and Dascălu 2017). Other reported benefits are higher quality, transparency,
comparability and reliability of financial reports, increased market efficiency, better corporate
governance practices, with some studies, showing a decrease in the cost of capital (Nobes and
Parker 2004, Albu and Albu 2012).
Despite previous research confirming the voluntary adoption of IFRS decreases the cost of
capital (Leuz and Verrecchia 2000), there is controversy regarding the effects of mandatory
adoption of IFRS in the cost of capital. Some researchers conclude that the cost of capital decreases
after mandatory IFRS adoption (Li 2010), whereas others find little evidence of any association
(Barth, Landsman and Lang 2006) or suggest it is only noticeable in countries where institutions
have incentives to be transparent and the rule of law is properly enforced (Daske, et al. 2008, Albu
and Albu 2012). The prevailing theory is that the adoption of IFRS increases the disclosure of
reliable and comparable information in contrast to domestic standards, more so in developing
countries (Okpala 2012). Studies have revealed direct and indirect links between the increase in
quality of information reported and decrease of the cost of capital (Lambert, Leuz and Verrecchia
2007).
Provided that Angola is a developing country seeking foreign investment and to strengthen the
banking sector15, the effects of adopting IFRS and the expected decrease in the cost of equity would highly benefit the Angolan economy. However, to the best of our knowledge, this topic has not
been studied before. Thus, this Work Project, contributes to the literature by adding evidence on
the effects of the mandatory adoption of IFRS in the cost of equity, in Angolan banks.
15 In April 2018, the Angolan Finance Minister Archer Mangueira, requested the help of the International Monetary
Fund in developing a program for economic policy coordination, in its continuous efforts to attract Foreign Direct Investment (Negócios 2018).
11
4. Research Design
This Work Project aims to understand which factors influence the cost of equity in Angolan
banks, with a special focus on the impact of the mandatory adoption of IFRS. Hence, it analyses
the evolution of the cost of equity, focusing on the banking sector, as it is currently the only sector
mandatorily reporting under IFRS, in Angola.
Apart from studying the impact the adoption of IFRS had on the cost of equity, this paper also
analyzes other variables that may influence the cost of equity. These variables can be grouped into
company-specific variables (size, leverage, profitability, dividends, effective tax rate, enforcement
quality and corporate governance practices) and country-specific variables (GDP, inflation rate,
risk-free interest rate and level of corruption). This Work Project addresses the three following
Research Questions (RQ):
RQ1: How did the cost of equity in Angolan banks evolve over time?
To answer RQ1, the cost of equity is estimated over the periods 2012-2016 for every bank in
the sample, using an adjusted version of the Dividend’s Growth Model, and a descriptive statistical
analysis (univariate and bivariate), in order to characterize its evolution and identify the factors that
are associated with the cost of equity (correlation analysis)16.
RQ2: What changed in Angolan banks when the IFRS were adopted?
The objective of RQ2 is to understand how the cost of equity was affected by the adoption of
IFRS and how the variation in other variables may have influenced its impact. This question
focuses on the years 2015 and 2016 and separates the data between banks, which adopted and did
not adopt IFRS. It analyzes how the variables changed in that period, in order to find differences
and similarities between them.
16 Data was prepared and analyzed in an excel file, which is also a contribution of this research, seen as aggregate
12
RQ3: How do the country and company-specific variables impact the cost of equity of Angolan banks?
The third RQ aims to understand the relation between the mandatory adoption of IFRS and the
cost of equity. Based on prior research (Li 2010, Castillo, Menéndez and Orgaz 2014), we ran an
OLS regression, in SPSS. The dependent variable is the cost of equity and the independent
variables are the adoption of IFRS (yes/no) and the other variables that are also expected to
influence this cost, as detailed below.The regression model is as follows:
𝑟𝑒 = 𝛽0+ 𝛽1𝐼𝐹𝑅𝑆 + 𝛽2𝐴𝑠𝑠𝑒𝑡𝑠 + 𝛽3𝐶𝑜𝑢𝑛𝑡𝑒𝑟𝑠 + 𝛽4𝐿𝑒𝑣𝑒𝑟𝑎𝑔𝑒 + 𝛽5𝑅𝑂𝐴 + 𝛽6𝐷𝑃𝑆 + 𝛽7𝑇𝑎𝑥 + 𝛽8𝐵𝑖𝑔𝐹𝑜𝑢𝑟 + 𝛽9𝑂𝑝𝑖𝑛𝑖𝑜𝑛 + 𝛽10𝐴𝑑𝑚𝑖𝑛 + 𝛽11𝐶𝐸𝑂 + 𝛽12𝐶𝑜𝑛 + 𝛽13𝐺𝐷𝑃 + 𝛽14𝐼𝑛𝑓 + 𝛽15𝐼𝑛𝑡𝑒𝑟𝑒𝑠𝑡 + 𝛽16𝐶𝑜𝑟𝑟𝑢𝑝𝑡𝑖𝑜𝑛 + ɛ
[
[2]
Where re is the cost of equity. The company-specific variables are: IFRS, a binary variable
equal to one for the banks which adopted IFRS; Assets, logarithm of total assets; Counters, number
of bank counters; Leverage, debt to equity ratio; ROA, return on assets; DPS, dividend per share;
Tax, effective tax rate; BigFour, a binary variable equal to one if the bank is audited by a Big Four firm; Opinion, a binary variable equal to one if the auditor’s report is qualified; Admin, percentage
of shares owned by managers; CEO, a binary variable equal to one if the Chief Executive Officer
(CEO) owns shares; Con, the ownership concentration. The country-specific variables are: GDP,
the Angolan Gross Domestic Product; Inf, the inflation rate in Angola; Interest, the risk-free interest
rates in Angola; Corruption, the index of corruption in Angola. ɛ is the random error.
Details on the variables are presented in Appendix 1, namely their proxies, the expected sign
of the coefficient, formula and source from the literature review. As the cost of equity is a
continuous variable, regressions with categorical or count variables were automatically excluded
13 analyze and interpret17. This Work Project also adds to the literature by including as variables the
dividends, effective tax rate, independence of administrators and CEOs, and risk-free interest rates,
which as far as we know, have not been considered before.
Sample Description
There are currently 30 banking institutions authorized to operate in Angola18, 13 of which
adopted IFRS in 2016 and 17 which did not (Banco Nacional de Angola 2018). As information on
these banks is scarce in databases, all data was hand collected from the individual annual reports
of each bank, available at the banks’ websites. The research covers a period of five years, from
2012 to 2016. The latter is the most recent year with available financial reporting data and for
periods before 2012 only ten banks had their financial statements available. This range provides a
four-year span before the mandatory adoption of IFRS and the first year of adoption of those
standards. However, some banks were not included in the sample according to the following
criteria. One bank (EcoBank) was excluded because, although authorized to operate in Angola, it
had not yet started operations in 2016. Of the 29 banks currently operating in Angola, 11 banks do
not have their financial statements available online, for the whole or part of the selected period.
Moreover, two state-owned banks (Banco de Desenvolvimento de Angola and Banco de Comércio
e Indústria) were removed, as they behaved differently from the other banks and were outliers19.
Therefore, the final sample of this paper narrowed to 16 banks, 11 of which adopted IFRS.
Appendix D shows the composition of the initial and final samples, which include 30 and 16 banks,
respectively.
17 Its limitations are: it oversimplifies the relationship between two variables (in most situations variables do not behave
linearly); results may be dubious when the sample does not have a normal distribution (that is solved for large samples); it is extremely sensitive to outliers (which has been partly solved by the removal of two banks with clear outlier results).
18 Of which three are state-owned and 27 are private banks.
14
Data Analysis
A preliminary descriptive statistical analysis of the independent variables, both univariate and
bivariate analysis (correlation), offers a brief overview of the characterization of Angolan banks. The banks’ size, leverage, profitability, dividends, effective tax rate, enforcement quality and
corporate governance practices are set as independent variables for the banks’ risk and specific
characteristics and the macroeconomic variables are set to account for the country’s features.
Regarding size, Angolan banks in the sample are highly concentrated. In 2016, the assets of
the five largest banks represented around 78% of the total assets of the sample and eight banks had
assets above 300 million Kwanzas. The average assets in the sample have been increasingly
growing from 2012-2016, growing 20.9% in 201620. The number of counters, another indicator of bank size, are also very concentrated and have been steadily growing throughout the same period.
The leverage, measured by the debt to equity ratio, is exceptionally high in Angolan banks,
meaning banks fund their activities mainly through debt. However, this ratio consistently decreased
from 2014 to 2016, reflecting a change in the capital structure of the Angolan banks towards more
equity-oriented funding. The sample average was 9.61 in 2014 and 8.28 in 2016.
Profitability of Angolan banks, inferred from the ROA, is exceptionally volatile and disperse. In 2016, the most profitable bank was Banco VTB África, S.A., with a return of 18.89%, and the
least efficient was Banco Angolano de Negócios e Comércio S.A., with a return of -2.23%, the only
bank with negative returns.
The dividends per share announced by the banks are a measure of shareholders’ expectations
on their future earnings and have increased in value. In 2016, half of the banks in the sample
announced they would pay dividends the following year and all of them were reporting under IFRS.
20 The sample shows values similar to those of KPMG’s “Analysis of the Angolan Banking Sector”, suggesting the
15
The Effective tax rate was included to account for the fiscal effect, as the cost of equity is
measured after tax21. The average effective tax rate of Angolan banks in the sample in 2015 and 2016 was 14% and 4%, respectively. It is lower than the nominal corporate income tax rate set in
the Industrial Tax Code, that was 30% in both periods (Osório and Cruz 2016).
The binary variable BigFour was inserted as a proxy for external control and enforcement
quality. By registering which banks were audited by one of the Big Four firms22, the reliability and quality of information reported were controlled. Most firms that aim to comply with government
regulation, hire the services of one of the Big Four firms, for their expertise in the field of IFRS.
In 2016, 12 of the 16 Angolan banks in the sample were audited by one of the Big Four firms,
which remained relatively constant from 2012 to 2016. In 2016, five banks received a qualified
audit report, accounted for in the variable Opinion, and only one originated from a Big Four firm.
The shareholder structure influences corporate governance practices. Therefore, three
variables regarding the independence of management and ownership concentration were added to
the model. Only one bank in the sample is state-owned, Banco de Poupança e Crédito23. The CEO variable examines whether the CEO is also a shareholder, the Administrators variable what
percentage of shares is owned by administrators and the Concentration variable how concentrated the shareholder structure is. Good corporate governance guidelines require managers’
independence of the shareholders, to avoid agency problems. On average, in the sample, around
20% of each bank is owned by administrators, 11 of them have at least one administrator who owns
shares and three of them have a CEO who also is a shareholder. Regarding concentration, large
21 In 2014, Angola’s Law No. 19/14 was endorsed, reviewing the Corporate Income Tax Code (Código do Imposto Industrial) and is in force since 2015. The revised tax code extended the income tax basis and decreased the tax rate
from 35% to 30%. However, financial intermediation and insurance services were exempt (EY 2014).
22 The commonly called Big Four firms is a reference to the four largest professional services firms in the world, which
also provide audit and accounting services. They are KPMG, Deloitte, PWC and EY.
23 Caixa Geral Angola S.A. is considered a private bank for this study, even though it is 51 percent owned by Grupo Caixa Geral, a Portuguese state-owned group.
16
shareholders may have a higher interest in the long-term growth and are more able to control
management, but they can also take advantage of their position for their own benefit at the expense
of smaller shareholders (Wilson and Schleifer 2013). In the sample, the concentration of
shareholders is highly correlated with the lack of independence, meaning that Angolan banks that
have less independence of management also face a higher ownership concentration.
Regarding the country-specific variables, the risk-free rates in Angola are an indicator of the country’s risk. They gradually declined until 2014, when the oil crisis hit the country, and they
increased significantly, from nine to 16 percent in two years. The market risk premium, a
compensation to investors for the added risk of the market, is influenced by factors such as the economic situation of the country or its level of corruption. Angola’s GDP suffered a sharp decline,
after reaching its highest value ever recorded, due to the drop of oil prices in 201424. The inflation rate is also a concern, having grown in 2015 and 2016, reaching 34.74% in the latter year (The World Bank 2018). Regarding corruption, the country is also in a worse position, declining from
an already a low score of 22, in 2012, to 18 in 201625, in the corruption perception index. 6. Results
Evolution of the cost of equity (RQ1)
Due to the country’s economic and political risk, both the risk-free and market risk premium
rates were exceedingly high. This resulted in the cost of equity of Angolan banks also being
superior in value, in the years 2012-2016. It increased from 66% to 75%, from 2012 to 2015, and
decreased to 70%, in 2016, the year of IFRS adoption. Its evolution is demonstrated in Chart I and
Appendix E.
24 Angola’s GDP peaked in 2014, reaching 126.78 billion USD and declined to 95.34 billion USD in 2016. 25 In a scale from 0 to 100, in which 0 is highly corrupt and 100 is very clean (Transparency International 2018).
17
Chart I – Evolution of the cost of equity in Angolan banks
However, this alone is not sufficient to
determine a causality relationship. The
research proceeds with the analysis of
factors that might have influenced the cost
of equity. It has stronger correlations with
the (i) ROA (p=0.64); (ii) ownership
concentration (p=0.53); (iii) size variables:
number of counters (p=-0.37) and assets
(p=-0.34). The table of correlations is shown in Appendix F.
Although it is positively correlated with the cost of equity, the ROA decreased until 2014 and
increased afterward, on average. The average net income steadily grew throughout the years
2012-2016, with a more acute growth in the last year. As the banks’ investments increased their profitability, the investors’ required return decreased. The ownership concentration remained
relatively constant throughout 2012-2016 but followed fairly the same pattern as the cost of equity.
As minority shareholders lose power (higher concentration) it is natural that they require a higher
return on their investment, considering the added risk. The Angolan banks’ size, proxied by the log
of assets and number of counters, constantly increased from 2012 to 2016 (it grew significantly
more in the latter) and both are negatively correlated with the cost of equity. As growth in size
often signals a good financial condition, the larger increase in the number of counters and assets
coheres with the decline of the cost of equity, in 2016.
Despite the low correlation between the cost of equity and the macroeconomic variables, these
are still relevant. The high level of the cost of equity in Angolan banks can be attributed to the country’s economic position. High interest rates are a result of the risk of doing business in Angola.
0% 50% 100% 150% 200% 250% 300% 2011 2012 2013 2014 2015 2016 2017 Cos t o f E q u ity Year
18
The GDP grew strongly until 2014 (when the economic downfall began) and started declining
rapidly, while the opposite happened to the inflation and risk-free rates. It would be expected that
a worsening economic situation would increase the cost of equity. However, that is not observed
in this study. It may be that other industries of the economy were more affected than the banking
sector, or that the effects will only be seen in the long run.
A closer look into 2016, the first period of mandatory adoption of IFRS for Angolan banks, is
given in the following sub-section, in order to understand the main differences between those banks
that did and did not adopt IFRS and how its effect may have been influenced by the
company-specific variables.
Differences between banks that adopted IFRS and non-IFRS adopters (RQ2)
In 2016, in this paper’s sample, 11 banks adopted IFRS and five did not, with no early
voluntary adoption reported. Differences were observed between these two groups of banks in
respect to the cost of equity, dividends per share, enforcement quality variables and corporate
governance practices, as shown in Table I. Cross-variable tables are presented in Appendix G.
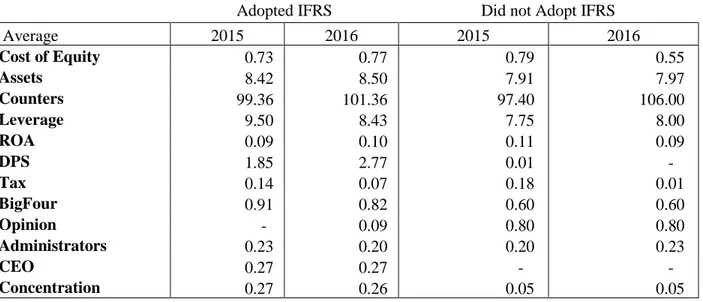
Table I. Characteristics of the Angolan banks: IFRS-adopters versus non-IFRS adopters
Adopted IFRS Did not Adopt IFRS
Average 2015 2016 2015 2016 Cost of Equity 0.73 0.77 0.79 0.55 Assets 8.42 8.50 7.91 7.97 Counters 99.36 101.36 97.40 106.00 Leverage 9.50 8.43 7.75 8.00 ROA 0.09 0.10 0.11 0.09 DPS 1.85 2.77 0.01 - Tax 0.14 0.07 0.18 0.01 BigFour 0.91 0.82 0.60 0.60 Opinion - 0.09 0.80 0.80 Administrators 0.23 0.20 0.20 0.23 CEO 0.27 0.27 - - Concentration 0.27 0.26 0.05 0.05
19
The banks that adopted the IFRS had, on average, a lower cost of equity than non-adopters, in
the pre-adoption period. However, after the adoption, the average cost of equity increased in the
banks that adopted IFRS26 and decreased in the ones which did not. This result is contrary to what was expected and is even more accentuated considering that banks reporting under IFRS should
have lower costs of equity than if they were reporting under CONTIF (accounting wise)27. This is
most likely a result of the method used to calculate the cost of equity. In banks which adopted
IFRS, the net income increased and at a higher rate than the equity. Therefore, in banks that adopted
IFRS, the cost of equity increases because shareholders require a higher return rate, even though
the banks increased their net incomes. Previous literature explains that in developing countries,
among other challenges such as the lack of expertise in the field of international standards and
enforcement mechanisms, increased costs with the adoption may interfere with the purposed effects
of adopting IFRS.
Dividends per share in banks that adopted IFRS amounted to 2.77 thousand Kwanzas on
average, whereas the non-IFRS adopters did not pay any dividends. As the payout ratio was kept
relatively constant in every bank and the net income increased in 2016, so did the dividends.
Regarding the enforcement quality, banks which adopted the IFRS presented higher efforts
than non-IFRS adopters, as a larger portion of them hired services from reliable international
auditors and had a significantly lower percentage of qualified reports. However, it is also shown
that, even though outperforming in this category, the banks that adopted IFRS worsened their
reporting quality in 2016, presenting a higher level of qualified reports. This may be an indicator
that, even though the standards were applied, they may not have been done so appropriately.
26 On eight of the eleven banks which adopted IFRS, their cost of equity increased, in 2016.
27 If there were no adjustments when reporting in IFRS, banks which adopted the standards would have an even higher
20
In regards to the CEO variable, agency problems may appear only in banks which adopted
IFRS, as the CEOs are not shareholders in the banks that did not adopt IFRS. Moreover, ownership
of the banks is much more concentrated in banks that adopted IFRS. Again, this adds to the
evidence that in the banks that adopted IFRS, the lack of independence of CEOs, the higher
concentration and the increased number of qualified reports, may have interfered with the expected
reduction of cost of equity related with the IFRS adoption.
Factors that impact the cost of equity of Angolan banks (RQ3)
An OLS regression, including all the variables previously considered important in explaining
the cost of equity, the company-specific variables (IFRS, firm size, leverage, ROA, DPS, effective
tax rate, enforcement quality and corporate governance practices) and country-specific variables
(GDP, inflation rate, risk free interest rate and level of corruption)28, was run and the results are presented in Appendix H. However, to ensure that only the variables that maximize the relevance
of the model were included, we applied the Backwards29 method, which did not include the country-specific variables. Table II and
Appendix I show the results of this regression.
The F-test, which tests whether the regression
used fits the data, considers this model
significant and the Adjusted coefficient of
determination (R2), which determines what
percentage of the dependent variable variance is
explained by the model, amounts to 68.9%.
28 For a significance level of five percent, variables should have a p-value lower than 0.05 to be considered relevant. 29 The Backwards method, a tool offered by SPSS, consists on removing variables until the model with the best fit is
found.
Table II – Backward Regression Coefficients Model 2 Unstandardized Coefficients t Sig. B Std. Error (Constant) -2.670 .768 -3.476 .001 Assets -.288 .095 -3.033 .003 Counters -.002 .001 -3.655 .000 Leverage .020 .007 2.741 .008 ROA .070 .008 8.744 .000 BigFour .078 .075 1.043 .300 Opinion .321 .086 3.739 .000 Administrators -.002 .001 -1.205 .232 CEO .111 .079 1.394 .168 Concentration .012 .002 5.537 .000
21
This model shows the highest adjusted R squared and lowest standard error possible. Of the
nine variables inserted in the updated model the statistically significant variables (p-value < 0.05)
are company characteristic variables, namely banks’ size (Log of Assets (p=0.003), Number of
counters (p=0.000)), leverage (Debt to equity ratio (p=0.008)), profitability (ROA (p=0.000)),
auditors’ opinion (p=0.000) and ownership concentration (p=0.000).
With everything else constant, when the log of assets 0.288) or number of counters
(β=-0.002) increase one unit, the cost of equity is expected to decrease by 28.8% or 0.2%, respectively. Regarding leverage, when the debt to equity ratio (β=0.02) increases one unit, the cost of equity is
expected to increase 2%. These results are in line with the literature. Researchers predict that
investors of larger and less leveraged firms require lower returns. As they perceive them to be more
established and have a lower risk of default, the cost of equity decreases (Li 2010, Patro 2014).
Regarding profitability, with everything else constant, when the ROA (β=0.07) increases one
unit, the cost of equity is expected to increase 7%. Previous research found opposite results, as a
higher ROA signals investors a superior profitability and as a result, market shares increase and
the cost of equity decreases (Castillo, Menéndez and Orgaz 2014). However, in this paper, book
values were used and, when the net income increases the cost of equity also increases, because
equity increases at a lower rate than the income.
Regarding the enforcement quality, with everything else constant, when the Opinion (β=0.321) of the audit report is qualified, the cost of equity is expected to increase 32.1%. To the best of our knowledge, this variable was never considered in previous research on this topic.
However, the results verify the hypothesis that banks with qualified audit reports, have lower
enforcement and reporting quality and therefore have a higher cost of equity.
In terms of corporate governance practices, with everything else constant, when the ownership
22
shares – increases one unit, the cost of equity is expected to increase 1.2%. As predicted, banks
with lower ownership concentration have more financial reporting incentives and higher
enforcement mechanisms, reducing its cost of equity (Lee, Walker and Christensen 2008).
6. Conclusion
The purpose of this Work Project was to understand the impact of mandatory adoption of IFRS
on the cost of equity, in Angolan banks. The literature suggests IFRS bring more transparency,
reliability and quality to financial reporting practices, but there is still much controversy regarding
its real impact on the cost of equity. Even more in African developing countries, in which research
on the area is scarce. This research contributes to the literature by adding empirical evidence of the
impact of adopting IFRS in the cost of equity, in Angolan banks, and evidence of other country
and company-specific variables that influenced the cost of equity.
The cost of equity in Angolan banks is exceedingly high. It continuously increased from 2012
to 2015, until it decreased in 2016, the year of IFRS adoption. A closer insight at the adoption
period determined that, unexpectedly, banks that adopted IFRS increased their cost of equity.
Previous literature explains that certain challenges, such as the lack of expertise in the field of
international standards and enforcement mechanisms, may interfere with the purposed effects of
adopting IFRS in developing countries. The results show that banks that adopted IFRS had a
significant increase in qualified reports by their auditors, suggesting they were not properly applied.
The results of the OLS regression show that the adoption of IFRS does not explain significantly
the cost of equity in Angolan banks, at least in the short term. Other factors such as dividends, effective tax rate, auditor, managers’ independence and the macroeconomic variables are also not
relevant. Nonetheless, the company-specific variables banks’ size, leverage, ROA, auditors’
23
banks. Furthermore, the cost of equity decreases when the banks’ size increases and when the
leverage ratio, ROA, qualified opinion and ownership concentration of banks decrease. These
results, with the exception of ROA, are in line with the literature on the topic.
This paper is subject to some limitations and its results depend on the methodology chosen.
The rPEG model could not be used in the calculation of the cost of equity, due to the absence of analysts’ estimation of future earnings, making it difficult to measure the cost of equity. An
adjusted Dividend Growth model was used, substituting dividends by earnings and market values
by book values. Additionally, the paper only considers the first year of IFRS adoption and does not
capture the long-term effects on the cost of equity. Furthermore, the number of observations of
banks that adopted IFRS was limited to one year, much smaller than the ones that did not adopt.
At last, for banks that adopted IFRS and presented their 2015 and 2016 financial statements
according to IFRS, it presents some accounting differences compared to CONTIF. In 2015, the
data reported under both accounting standards shows banks that reported in IFRS had a lower cost
of equity than when using CONTIF.
For future research, it could prove fruitful to do a similar research a few years after the
adoption. With more observations of banks that adopted IFRS and more time to properly enforce
them, the impact of these standards should be more noticeable. Moreover, the macroeconomic
environment is paramount in explaining the exceedingly high cost of equity and its evolution.
Finding different, more relevant proxies to explain it could yield interesting results. At last, if
predictions on future earnings and the beta of each bank were calculated, this could allow a more
accurate method to measure the cost of equity using the rPEG or CAPM.
The main barrier to Angola’s economic progress is the absence of an attractive business
environment. Though this country is making noticeable improvements, by adopting IFRS and
24
more expertise in all levels of business and avoid corruption. If the government is able to increase
transparency, quality and relevance of information reported, it will enhance the confidence in the
markets and decrease the cost of equity, helping the economy to develop.
References
Al-Akra, Mahmoud, Ian Eddie, and Muhammad Ali. 2010. "The influence of the introduction of accounting disclosure regulation on mandatory disclosure compliance: evidence from Jordan." The British Accounting
Review, 42: 170-186.
Albu, Nadia, and Catalin N Albu. 2012. "International Financial Reporting Standards in an Emerging Economy: Lessons from Romania." Australian Accounting Review, 22 (4): 341-352.
Ames, Daniel. 2013. "IFRS adoption and accounting quality: The case of South Africa." Journal of Applied
Economics and Business Research, 3 (3):154-165.
ANGOP. 2017. Angola: Banking sector must be the engine of the economy. Accessed April 16, 2018.
www.angop.ao/angola/en_us/noticias/economia/2017/3/14/Angola-Banking-sector-must-engine-economy,b6ffa423-9f09-4d4e-93f9-626b48f714fc.html.
Banco Nacional de Angola. 2014. "Apresentação ao mercado do processo de adopção plena das IAS/IFRS."
Banco Nacional de Angola. Accessed February 2018. http://www.bna.ao/.
—. 2018. "Banking Institutions Authorized to Operate in Angola." Accessed February 29, 2018.
—. 2018. Exchange Rates. Accessed April 4, 2018.
http://www.bna.ao/Conteudos/Artigos/lista_artigos_medias.aspx?idc=161&idsc=223&idl=1.
Barth, Mary E, Wayne R Landsman, and Mark H Lang. 2006. International Accounting Standards and
Accounting Quality. Stanford University.
Brealey, Richard, Stewart Myers, and Franklin Allen. 2010. "Principles of Corporate Finance." 10th edition: 213-240. New York: McGraw-Hill.
Castillo, David, Carlota Menéndez, and Neus Orgaz. 2014. "Mandatory IFRS adoption and the cost of equity capital: Evidence from Spanish firms." Intangible Capital, 10 (3): 562-583.
Damodaran, Aswath. 2003. Measuring Company Exposure to Country Risk: Theory and Practice. New York: Stern School of Business.
Daske, Holger, Luzi Hail, Christian Leuz, and Rodrigo Verdi. 2008. "Mandatory IFRS Reporting Around the World: Early Evidence on the Economic Consequences." Journal of Accounting Research, 46 (5): 1085-1142.
Deloitte. 2017. Banca em Análise. Luanda: Deloitte Touche Tohmatsu Limited.
Deloitte. 2008. International Financial Reporting Standards: Considerations for the Technology Industry. Deloitte Development LLC.
Easton, Peter D. 2004. "PE Ratios, PEG Ratios, and Estimating the Implied Expected Rate of Return on Equity Capital." The Accounting Review, 79 (1): 73-95.
Euromonitor International. 2018. "Angola: Country Profile." http://www.portal.euromonitor.com.
EY. 2014. Angola revises the withholding tax regime under the Industrial Tax Code . Luanda: EYGM Limited. Fama, Eugene, and Kenneth French. 1992. "The Cross-Section of Expected Stock Returns." The Journal of
25 Houqe, Muhammad, and Reza Monem. 2016. "IFRS Adoption, Extent of Disclosure, and Perceived Corruption:
A Cross-Country Study." The International Journal of Accounting, 51: 363-378.
IFRS Foundation. 2017. "Jurisdictional Profile: Angola." IFRS Web site. February 8. www.ifrs.org. —. 2018. "Who we are and what we do." IFRS Foundation Web site. January 25. www.ifrs.org.
Ionasçu, Mihaela, Ion Ionasçu, Marian Sacarin, and Mihaela Minu. 2014. "IFRS adoption in developing countries: the case of Romania." Accounting and Management Information Systems, 13 (2): 311–350. KPMG. 2016. Angola Banking Survey. Luanda: KPMG Angola.
Lambert, Richard, Christian Leuz, and Robert Verrecchia. 2007. "Accounting Information, Disclosure, and the Cost of Capital." Journal of Accounting Research, 45 (2): 385-420.
Lee, Edward, Martin Walker, and Hans B. Christensen. 2008. Mandating IFRS: its Impact on the Cost of Equity
Capital in Europe. London: Association of Chartered Certified Accountants .
Leuz, Christian, and Robert Verrecchia. 2000. "The economic consequences of increased disclosure." Journal of
Accounting Research, 38: 91-124.
Li, Siqi. 2010. "Does Mandatory Adoption of International Financial Reporting Standards in the European Union Reduce the Cost of Equity Capital?" The Accounting Review, 85 (2): 607-636.
Lungu, Camelia L, Chirața Caraiani, and Cornelia Dascălu. 2017. "The Impact of IFRS Adoption on Foreign Direct Investments: Insights for Emerging Countries." Accounting in Europe, 14 (3): 331-357.
Negócios. 2018. "Angola recorre ao FMI para credibilizar contas." Jornal de Negócios 12-12.
Nobes, Christopher, and Robert Parker. 2004. Comparative International Accounting, 8th edition. London: Financial Times Prentice Hall.
Okpala, Kenneth. 2012. "Adoption of IFRS and Financial Statements Effects: The Perceived Implications on FDI and Nigeria Economy." Australian Journal of Business and Management Research, 5 (2): 76-83.
Osório, Catarina, and Claudia Cruz. 2016. Regulatory environment in Angola which governs foreign investment. Luanda: Morais Leitão, Galvão Teles, Soares da Silva & Associados.
Patro, Archana. 2014. "Impact of International Financial Reporting Standards on Cost of Equity Capital for Asian countries." International Journal of Accounting and Financial Reporting, 4 (2): 148-170.
Riahi, Olfa, and Walid Khoufi. 2015. "The role of the economic and behavioral circumstances in the IAS/IFRS’s adoption (the case of developing countries)." International Journal of Accounting and Economics Studies, 3 (1): 69-76.
The World Bank. 2018. Ease of Doing Business in Angola. Accessed April 14, 2018. http://www.doingbusiness.org/data/exploreeconomies/angola.
—. 2018. The World Bank - Data. Accessed March 28, 2018. https://data.worldbank.org/country/angola. —. 2017. The World Bank In Angola. December 22. Accessed February 26, 2018. http://www.worldbank.org/. Thompson, Samuel C. 2016. Accounting for a Developing World: A look at International Standards on
Developing Countries. University of Tennessee Honors Thesis Projects.
Transparency International. 2018. "Corruption Perceptions Index." Transparency International. Accessed April 9, 2018. https://www.transparency.org.
United Nations. 2008. "Practical implementation of international financial reporting standards: Lessons learned."
United Nations Conference on Trade and Development. New York and Geneva: United Nations Publication.
UNCTAD/DIAE/ED/2008/1.
Wilson, Andrew, and Marc Schleifer. 2013. "The Corporate Governance Implications of Concentrated Ownership." Center for International Private Enterprise. September 10. https://www.cipe.org.
26
Appendices required for the comprehension of the paper Appendix 1 – Variables in the regression model
Source: Banks’ Annual Reports and World Bank database.
Variable Accounting for Expected sign of the coefficient
Formula Literature Review
IFRS Adoption of IFRS - Dummy variable: equal to 1 if adopted the IFRS and 0 otherwise.
(Li 2010, Castillo, Menéndez and Orgaz 2014, Lee, Walker and Christensen 2008) DPS Expected payout to shareholders - Total dividends
Ordinary shares – Own shares a)
Assets Bank size - Log of total assets (Li 2010, Patro 2014,
Castillo, Menéndez and Orgaz 2014, Ames 2013) Counters Bank size - Number of counters of each bank This research
Leverage Level of indebtedness + 𝑇𝑜𝑡𝑎𝑙 𝐷𝑒𝑏𝑡
𝑇𝑜𝑡𝑎𝑙 𝐸𝑞𝑢𝑖𝑡𝑦
(Lee, Walker and Christensen 2008, Ames 2013) ROA Efficiency of investments - 𝑂𝑝𝑒𝑟𝑎𝑡𝑖𝑛𝑔 𝐼𝑛𝑐𝑜𝑚𝑒 𝑇𝑜𝑡𝑎𝑙 𝐴𝑠𝑠𝑒𝑡𝑠 (Castillo, Menéndez and Orgaz 2014) Tax Effective Tax rate –
Fiscal effect
? 𝐸𝐵𝑇 − 𝑁𝑒𝑡 𝐼𝑛𝑐𝑜𝑚𝑒
𝐸𝐵𝑇
a) Big Four Quality of standards’
enforcement efforts
- Dummy variable: equal to 1 if audited by a Big Four firm and 0 otherwise
(Barth, Landsman and Lang 2006, Al-Akra, Eddie and Ali 2010)
Opinion Quality of standards’ enforcement efforts
+ Dummy variable: equal to 1 if the auditors’ report is qualified and 0 otherwise
a)
Administrators Corporate
Governance practices
+ Percentage of bank shares owned by administrators
a)
CEO Corporate
Governance practices
+ Dummy variable: equal to 1 if CEO is also a shareholder and 0
otherwise
a)
Concentration Corporate
Governance practices
+ Median value of the three shareholders with the highest number of shares
(Lee, Walker and Christensen 2008) GDP Angola’s Gross
Domestic Product
- Total GDP at constant prices, directly retrieved from source.
(Castillo, Menéndez and Orgaz 2014) Inflation Angola’s Inflation + Directly retrieved from source. (Li 2010, Castillo,
Menéndez and Orgaz 2014)
Interest Rates Country’s general level of risk
+ Risk-free national rates, from bonds issued by the government
a) Corruption Level of Corruption in
Angola
+ Corruption Index (Riahi and Khoufi 2015, Houqe and Monem 2016) a) To the best of our knowledge, this variable was included only in this research.
27
Appendices not required for the comprehension of the paper30
Appendix A - Simplified formula of the rPEG model
Where r = rate of return, cost of equity, EPS1 = expected earnings per share in 1 year, t = 1; EPS2 = expected earnings per share in 2 years, t = 2 and P0 = current price per share, In year t = 0.
Appendix B - Gordon’s Dividend Growth model formula
In which V0 is the value of the company in moment 0; Div1 is the dividend expected to be paid in the following year, moment 1; RRE is the Required Return on Equity; and g is the expected growth rate of the dividends. In theory, the Required Return on Equity should be the same as the cost of equity. By rearranging the formula, we can isolate the cost of equity:
𝑅𝑒 =𝐷𝑖𝑣1
𝑉0 + 𝑔
[3]
In which Re is the cost of equity.
30 Should not be considered for the 25 page limit.
r =
√(𝐸𝑃𝑆2 – 𝐸𝑃𝑆1) 𝑃0 [1] 𝑉0 = 𝐷𝑖𝑣1 𝑅𝑅𝐸 − 𝑔 [2]28
Appendix C - Adjustments to CONTIF in Angolan banks in 2015, in thousand Kwanzas
Shareholder's Equity according to CONTIF 463,891,666
Impairment of loans to customers (6,822,711)
Application of the effective rate to the securities portfolio 140,621
Application of the effective rate to the customer loan
portfolio (6,157,295)
Application of the effective rate to the portfolio of customer
deposits (571,632)
Application of effective tax rate to subordinated liabilities (47,178)
Annulment of assets not eligible for capitalization (221,672)
Reclassification of the social fund (10,325)
Deferred taxes arising from transition adjustments 3,626,184
Total adjustments reported (10,064,008)
Equity in accordance with IAS/IFRS 453,827,658
Total adjustments as a % of Equity in accordance with
CONTIF -2.17%
Net Income for the Year in accordance with CONTIF 119,775,858
Impairment of loans to customers (4,815,703)
Adjustment resulting from the revaluation of OT's Indexed
to USD 395,795
Application of the effective rate to the securities portfolio 107,213 Application of the effective rate to the customer loan
portfolio (1,927,543)
Application of the effective rate to the portfolio of
customer deposits (181,141)
Application of the effective rate to subordinated liabilities (25,602) Annulment of assets not eligible for capitalization 26,411 Annulment of reserves of revaluation of tangible and
intangible assets (228,585)
Deferred taxes arising from transition adjustments 1,533,684
Total adjustments reported (5,115,471)
Net income for the year in accordance with IAS/IFRS 114,660,387
Total adjustments as a % of Net Income according to the
29
Appendix D - List of banks included and excluded from the sample
Name Initials Adopted
IFRS Sample
Reason for exclusion
BANCO ANGOLANO DE INVESTIMENTOS,
S.A. BAI Yes Yes
BANCO YETU, S.A. YETU No No a)
BANCO ANGOLANO DE NEGÓCIOS E
COMÉRCIO, S.A. BANC No Yes
BANCO BAI MICRO FINANÇAS, S.A. BMF No No a)
BANCO BIC, S.A. BIC Yes Yes
BANCO CAIXA GERAL ANGOLA, S.A. BCGA Yes Yes
BANCO COMERCIAL ANGOLANO, S.A. BCA Yes Yes
BANCO COMERCIAL DO HUAMBO, S.A. BCH No No a)
BANCO DE COMÉRCIO E INDÚSTRIA, S.A. BCI No No b)
BANCO DE DESENVOLVIMENTO DE
ANGOLA, S.A. BDA No No b)
BANCO DE FOMENTO ANGOLA, S.A. BFA Yes Yes
BANCO DE INVESTIMENTO RURAL, S.A. BIR No No a)
BANCO DE NEGÓCIOS INTERNACIONAL,
S.A. BNI Yes Yes
BANCO DE POUPANÇA E CRÉDITO, S.A. BPC No Yes
BANCO ECONÓMICO, S.A. BE Yes No a)
BANCO KEVE, S.A. KEVE No Yes
BANCO KWANZA INVESTIMENTO, S.A. BKI No Yes
BANCO PRESTÍGIO, S.A. BPG No No a)
BANCO MILLENNIUM ATLÂNTICO, S.A. BPA Yes Yes
BANCO MAIS, S.A. BMAIS No No a)
BANCO SOL, S.A. BSOL Yes Yes
BANCO VALOR, S.A. BVB No Yes
BANCO VTB ÁFRICA, S.A. VTB Yes Yes
ECOBANK DE ANGOLA, S.A. ECO No No c)
FINIBANCO ANGOLA, S.A. FNB Yes Yes
STANDARD BANK DE ANGOLA, S.A. SBA Yes Yes
STANDARD CHARTERED BANK DE
ANGOLA, S.A. SCBA Yes No a)
BCS – BANCO DE CRÉDITO DO SUL, S.A. BCS No No a)
BANCO POSTAL, S.A. BPT No No a)
BANCO DA CHINA LIMITADA – SUCURSAL
EM LUANDA BOCLB No No a)
30
Appendix E - Evolution of the cost of equity of Angolan banks
Cost of Equity 2012 2013 2014 2015 2016 Average 0.66 0.64 0.65 0.75 0.70 Maximum 1.94 1.89 1.51 1.93 2.55 Minimum 0.30 0.31 0.30 0.29 0.17 Standard deviation 0.39 0.39 0.34 0.49 0.59 0% 50% 100% 150% 200% 250% 300% 2011 2012 2013 2014 2015 2016 2017 Cos t o f E q u ity Year
31
Appendix F - Correlations between variables in the sample
Cost of
Equity IFRS DPS Assets
Counte rs Levera ge ROA Tax BigFo ur Opinio
n Admin CEO Con GDP Inf
Interes t Corru ption Cost of Equity 1.00 IFRS 0.08 1.00 DPS (0.10) 0.18 1.00 Assets (0.34) 0.20 0.43 1.00 Counters (0.37) 0.05 0.36 0.78 1.00 Leverage 0.03 0.00 (0.01) 0.29 0.17 1.00 ROA 0.64 0.09 (0.21) (0.49) (0.31) (0.44) 1.00 Tax 0.10 (0.14) (0.16) (0.28) (0.16) (0.16) 0.20 1.00 BigFour 0.21 0.12 (0.06) (0.07) (0.37) (0.13) 0.17 (0.16) 1.00 Opinion 0.03 (0.18) (0.24) (0.25) 0.09 0.03 (0.00) (0.01) (0.48) 1.00 Admin 0.19 (0.00) (0.01) (0.36) (0.20) (0.09) 0.32 0.20 0.06 (0.13) 1.00 CEO (0.25) 0.05 0.10 0.12 0.19 0.15 (0.24) (0.10) (0.07) (0.09) 0.20 1.00 Con 0.53 0.07 0.34 (0.18) (0.18) 0.16 0.24 0.07 0.11 (0.25) 0.35 (0.25) 1.00 GDP (0.05) (0.59) (0.10) (0.21) (0.10) (0.02) (0.07) 0.20 (0.13) 0.03 (0.04) 0.07 (0.02) 1.00 Inf 0.03 0.79 0.09 0.13 0.06 (0.02) 0.08 (0.20) 0.08 0.01 0.02 (0.05) 0.02 (0.77) 1.00 Interest 0.05 0.77 0.09 0.14 0.06 (0.02) 0.09 (0.19) 0.10 0.01 0.03 (0.06) 0.03 (0.85) 0.99 1.00 Corruption (0.08) (0.19) (0.05) (0.16) (0.09) (0.12) (0.05) 0.20 (0.21) 0.03 (0.05) 0.06 (0.02) 0.71 (0.26) (0.35) 1.00
32
Appendix G – Cross Variable tables in 2016
IFRS Cost of equity IFRS Adopters Non-IFRS Adopters Tota l Increased 8 2 10 Decreased 3 3 6 Total 11 5 16
IFRS IFRS Non-IFRS Adopters
Auditor Adopters Total
Big Four
Company 56,25% 18,75% 75,0%
Non-Big Four 12,5% 12,5% 25,0% Total 68,75% 31,25% 100,0%
IFRS IFRS Non-IFRS Adopters
Independence Adopters Total
CEO owns shares 18,75% 0,00% 18,75% CEO does not own
shares 50,00% 31,25% 81,25%
Total 68,75% 31,25% 100,0%
IFRS IFRS Non-IFRS Adopters
Costo of equity Adopters Total
Increased 50,00% 12,50% 62,50% Decreased 18,75% 18,75% 37,50% Total 68,75% 31,25% 100,0% IFRS Auditor IFRS Adopters Non-IFRS Adopters Tota l Big Four 9 3 12 Non-Big Four 2 2 5 Total 11 5 16 IFRS Independence Adopted IFRS Non-IFRS Adopters Total
CEO owns shares 3 0 3
CEO does not own
shares 8 5 13 Total 11 5 16 0% 20% 40% 60% 80% 100% Non-IFRS Adopters IFRS Adopters
Cost of equity in 2016
Increased Decreased 0% 20% 40% 60% 80% 100% Non-IFRS Adopters IFRS AdoptersAuditors in 2016
Big Four Non-Big Four
0% 20% 40% 60% 80% 100% Non-IFRS Adopters
IFRS Adopters
CEO independence in 2016
33
Appendix H - Original Regression
Coefficientsa Model 1 Unstandardized Coefficients Standardized Coefficients t Sig. B Std. Error Beta (Constant) -2.117 2.542 -.833 .408 IFRS .051 .153 .040 .336 .738 Assets -.336 .113 -.538 -2.989 .004 Counters -.002 .001 -.504 -3.426 .001 Leverage .017 .009 .178 1.948 .056 ROA .069 .009 .724 7.866 .000 DPS -.010 .012 -.079 -.854 .396 Tax .001 .001 .057 .765 .447 BigFour .099 .087 .106 1.134 .261 Opinion .360 .093 .378 3.866 .000 Administrators -.002 .001 -.103 -1.208 .231 CEO .138 .088 .132 1.567 .122 Concentration .013 .003 .509 4.933 .000 GDP -.004 .011 -.116 -.333 .740 Inflation .007 .029 .173 .251 .802 Interest -.062 .153 -.351 -.403 .688 Corruption .003 .023 .017 .110 .913 ANOVA Model 1 Sum of Squares df Mean Square F Sig. Regression 11.244 16 .703 10.947 .000 Residual 4.044 63 .064 Total 15.288 79 Model Summary R R Square Adjusted R Square Std. Error of the Estimate .858 .735 .668 .2534