1
Physical, chemical and sensory properties of kiwi as influenced by drying conditions
*
Paula M. R. Correia1,2, Raquel P. F. Guiné1,2,3*, Ana C. Correia2, Fernando Gonçalves1,2, Mariana F. S. Brito2, Jéssica R. P. Ribeiro2,
(1. CI&DETS Research Centre, Polytechnic Institute of Viseu, Campus Politécnico, Viseu, Portugal; 2. Dep. Food Industry, Agrarian School of Viseu - ESAV, Quinta da Alagoa, Viseu, Portugal; 3. CITAB, University of
Trás-os-Montes, Vila Real, Portugal)
Abstract: The present study aimed at studying the effect of convective air drying on some physical, chemical and sensory properties of kiwi (Actinidia deliciosa L.) samples. The kiwi samples were dried in thin layer convective chambers set to constant temperatures at 50ºC, 60ºC, 70ºC and 80ºC. The fresh samples and the dried samples were analysed for moisture, water activity, vitamin C, total phenolic compounds, antioxidant activity, colour and texture. Also the different dried samples were submitted to a sensory evaluation. It was concluded that drying of kiwi importantly decreased the contents of some bioactive components such as vitamin C and phenolic compounds as well as the antioxidant activity. Moreover, the negative impact was higher at higher drying temperature. Drying also altered the colour towards a lower intensity of the green colouration and a higher intensity of the yellow. In what concerns the textural properties, drying produced important alterations, however the influence of temperature was not visible. Regarding the sensory evaluation, it was not possible to clearly distinguish the samples analysed, particularly in what related to the global appreciation. Still, it was possible to establish the sensory profiles of the dried samples, and the attributes that varied most among them were colour intensity, crunchiness and hardness.
Keywords: antioxidant activity, colour, drying, phenolic compounds, sensory analysis, texture, vitamin C.
* Corresponding author: Raquel Guiné, Professor, Dep. Food Industry, ESAV, Quinta da Alagoa, Estrada de Nelas,
Ranhados, 3500-606 Viseu, Portugal. Email: raquelguine@esav.ipv.pt. Tel: +351 232 446 641, Fax: +351 232 426 536. Published article.
Citation:
CorreiaPMR, Guiné RPF, Correia AC, Gonçalves F, Brito MFS, Ribeiro JRP. (2017) Physical, chemical and sensory properties of kiwi as influenced by drying conditions. Agricultural Engineering International, 19(3), 203-212.
2 1 Introduction
Recently, food scientists and nutritionists defend that a dietary pattern rich in fruits and vegetables contributes to reduced risks of certain diseases, including cancer and cardio- and cerebro-vascular diseases. These beneficial effects have been attributed to the various antioxidants in fruits and vegetables, including phenolic compounds, vitamin C, carotenoids, and tocopherols. These antioxidant substances have the ability to scavenge radicals by inhibiting initiation and preventing chain propagation or suppressing formation of free radicals by binding to the metal ions, reducing hydrogen peroxide, and quenching superoxide and singlet oxygen. Hence, they prevent oxidative stress in the human body cells thus having a role in the prevention of many diseases (Du et al., 2009; Peschel et al., 2006).
It has been demonstrated that the consumption of kiwifruit has a preventive effect against cardiovascular disease and also certain types of cancer, and in particular those of the digestive system (mainly stomach cancer), lung and liver, which have been positively handled with kiwifruit prescriptions due to its cytotoxic and antioxidant activities (Collins et al., 2003; Rush et al., 2002). Kiwi contains important levels of biologically active substances that have physiological and biochemical benefits for human health (Leontowicz et al., 2016). It is reported that kiwi fruit possesses antioxidant properties, provided by their biologically active substances, and a significant correlation was found between the antioxidant activity and the content of total polyphenols and vitamin C (Park et al., 2011; Du et al., 2009). Kiwifruit is characterized by a particularly high content of vitamin C but also possesses other useful compounds such as vitamin E, carotenoids, flavonoids, minerals and others. The role of vitamin C has been proven important in preventing the formation of N-nitroso compounds, which are the cancer causing substances derived from nitrates and nitrites found in preserved meats and some drinking water (Kaur and Kapoor, 2001). Besides, kiwi also contains important amounts of pigments, like chlorophylls and carotenoids (Tavarini et al., 2008).
The conventional drying techniques, especially hot air drying, despite being very ancient are still extensively employed as a preservation technique. Nevertheless, hot air drying has an undesirable effect on the final quality of the dried foods. Convective drying is considered as highly destructive due to shrinkage, discoloration and loss of nutrients, particularly in thermally sensitive materials like fruits and vegetables (Ratti, 2001; Guiné, 2015). Evaporation of water from fruits and vegetables is a highly complex process inducing structural changes that have many negative consequences, affecting the sensory properties like colour, texture or flavour, the chemical and nutritional composition as well as the
3 content of bioactive substances. When drying foods, it is important to reduce the moisture content and the water activity while preserving as much as possible the product quality (Szadzińska et al., 2017).
The present study was undertaken to investigate the effect of hot air drying at different temperatures ranging from 50ºC to 80ºC on some chemical, physical and sensory properties of kiwi, and given their importance for processing, conservation, nutrition and consumer acceptance.
2 Materials and methods 2.1 Samples and drying process
In the present work, kiwi fruits of Hayward variety were used, which were acquired in the local market. The fruits were peeled and cut into uniform slices with six mm using a kitchen apparatus. The dimensions of the slices were evaluated using an automatic calliper rule, measuring two diameters in 25 slices (the shortest, DS, and the longest, DL, considering the ovoid shape of the slices in Figure 1).
Figure 1 Measurement of kiwi diameters.
The slices were then distributed into trays in a single layer for drying using a WT Binder chamber with an air flow of 0.5 m s-1. Figure 2 shows the kiwi slices set on one of the trays immediately before drying. The drying temperatures were set to 50ºC, 60ºC, 70ºC and 80ºC, but for each experiment the temperature was maintained constant until the end of the drying process. The drying continued until the samples reached a moisture content compatible with preservation under storage, i.e., under 20% (Guiné et al., 2007).
The different dried samples were later used to assess the physical-chemical and sensory properties, as compared to the fresh sample.
4 Figure 2 Kiwi samples (sliced) before drying.
2.2 Evaluation of moisture and water activity
The analysis of moisture content was performed using a Halogen Moisture Analyser (Model HG53 from Mettler Toledo, Columbus, OH, USA) whose conditions were as follows: heat source: halogen lamp; drying temperature: 120°C; speed of drying three (intermediate in a scale from 1 = very fast to 5 = very slow). The water activity (aw) was measured at 25°C by a hygrometer (Rotronic Hygroskop BT-RS1,
New York, USA) connected to a thermal bath. The measurements of moisture and aw were made in
triplicate for the fresh kiwi and for all kiwi samples dried at different temperatures.
2.3 Quantification of ascorbic acid
Ascorbic acid was determined by titration using 2,6-dichoro-indophenol as described in AOAC (2000) method number 967.21. However, before it was necessary to obtain the aqueous extract from kiwi samples. Thus, 5 g of each sample of kiwi fruit (fresh and dried at different temperatures) was macerated with 10 ml of oxalic acid solution for three minutes, this being repeated for three times. Finally, the extract was filtered and measured. 5 mL were taken from the final extract obtained and titrated with the 2,6-dichoro-indophenol solution until a distinct rose-pink colour persisted for more than 5 s. The amount of ascorbic acid (100 mg g-1) was determined using the previously obtained standardization curve of ascorbic acid. This evaluation was done in triplicate in each of the samples.
5 2.4 Extraction procedure
The phenolic compounds were extracted from each sample with 2.5 g obtained from the grounded kiwi. The extraction procedure consisted of two successive extraction steps performed with 25 mL of methanol on the same sample. In each case, the sample was left in contact with the extraction solution for one hour, at room temperature under agitation. The extracts obtained were then used to quantify the phenolic composition and the antioxidant activity.
2.5 Analysis of total phenolic compounds
The total phenolic compounds (TPC) present in the kiwi fruit extracts was determined by the Folin-Ciocalteu reagent, by adaptation of the method referred by Gonçalves et al. (2012) and Guiné et al. (2014). Each sample (0.125 mL) was added to 0.75 mL of deionized water and 0.125 mL of Folin-Ciocalteu reagent. After waiting for 6 min, 2 mL of a 5% (m v-1) solution of sodium carbonate was added and the mixture was left to rest for 90 min at room temperature in the absence of light. A calibration line was obtained with standard solutions of gallic acid and the absorbance was measured in a spectrophotometer at a wavelength of 760 nm. All analyses were made in triplicate and the results were expressed as milligrams of gallic acid equivalents (GAE) per gram of fresh sample.
2.6 Determination of antioxidant activity
The antioxidant activity (AOA) was determined by the method using the free radical 2,2-Diphenyl-1-picrylhydrazyl (DPPH*) described by Brand-Williams et al. (1995). Briefly, 100 µL of sample and 2 mL of DPPH previously prepared with methanol were added to a tube, which was then placed in the dark at room temperature for 30 minutes. After that, the absorbance was measured at 515 nm. The results were based on the percentage of inhibition of each fruit, compared to 6-hydroxy-2,5,7,8-tetramethylchroman-2-carboxylic acid (Trolox) as standard antioxidant (50 and 400 µM) in a dose–response curve being expressed in µmol of Trolox equivalents (TE) per gram of fresh sample. The analyses were performed in triplicate.
2.7 Evaluation of colour
All the kiwi samples were analysed for their colour, using a handheld tristimulus colorimeter (Chroma Meter - CR-400, Konica Minolta, Tokyo, Japan) calibrated with a white standard tile, against a CIE standard illuminant D65. The CIELab Cartesian coordinates were determined: L*, a* and b*, where L*
6 denotes lightness or brightness, ranging from zero (black) to 100 (white), a* and b* are the opposing colour coordinates, with a* ranging from -60 (green) to +60 (red) and b* ranging from -60 (blue) to +60 (yellow) (Guiné and Barroca, 2014). 10 measurements were done for each sample.
The total colour change (∆E) was considered for evaluating the overall colour difference between the
dried sample and the fresh kiwi (designated with an index 0) on Equation 1:
∆ = − + − + − (1)
The fresh kiwi was used as the reference and a larger ∆E denotes a greater colour change from the reference material. 2.8 Evaluation of texture Texture profile analysis (TPA) to all the samples was performed using a Texture Analyser (model TA.XT.Plus, from Stable Micro Systems, Godaming, Surrey, United Kingdom). The TPA was performed by two compression cycles between parallel plates, with a five seconds interval, using a flat 75 mm diameter plunger (P/75) and a 5 kg force load cell. The pre-test, test and post-test speed was 1.5 m m s- 1, in all cases. Eight measurements were done for each sample and then the textural properties: firmness, adhesiveness, springiness, resilience, cohesiveness, and chewiness were calculated by Equations 2 to 7 (see Figure 3) (Guiné and Barroca, 2012; Santos et al., 2013): Firmness (N) = F1. (2) Adhesiveness (N.s) = A3. (3) Resilience (%) = A5/A4*100. (4) Cohesiveness = A2/A1. (5) Springiness (%) = T2/T1*100. (6) Chewiness (N) = F1*T2/T1*A2/A1. (7)
7 Figure 3 Texture Profile Analysis (TPA) calculations.
2.9 Sensory analysis
For assessing the sensory properties were performed tests of descriptive sensory profile to the dried kiwi samples at different temperatures (50ºC, 60ºC, 70ºC and 80ºC).
The sensory evaluation of the samples was carried out by a non-trained panel of tasters, but whose members had previous experience in participating in discriminative tests involving dried foods. The panel was composed of 26 assessors, 10 males and 16 females aged between 20 and 55 years.
All samples were presented coded randomly with three digits. The samples were placed whole over an odor-free, white plastic dish. Plain water and unsalted crackers were provided for palate rising in-between the samples. Samples were served at room temperature and the tasting room was kept at 22 ± 2ºC.
The sensory characteristics of dried kiwi (one piece/sample) were obtained through a descriptive analysis of the product, made by all tasters. The sensory attributes evaluated were: colour intensity, homogeneity and roughness for appearance; aroma intensity; sweet, acid and bitter for taste; crunchy, elasticity, adhesiveness and firmness for texture; and finally overall appreciation. The tasters evaluated firstly the samples individually using a numeric increasing scale for intensity, with values ranging from
8 1, corresponding to the least perceptible quantification for each attribute, to 5, for the most perceptible. After completing the descriptive analyses to the whole set samples a discussion was promoted, among all the elements of the panel, relatively to the intensity of each attribute for each sample analysed. The discussion was allowed to define the sensory profile of each sample analysed, having as basis the Free
Choice Profiling. In this methodology, the tasters do not need to be previously trained with the
terminology used, however, after the initial individual evaluation, the panel should as a whole come to a consensus attributing an unique significance to each attribute for each sample (Meilgaard et al., 2006).
2.10 Statistical analysis
In order to verify if the results obtained in terms of mean value were statistically different among samples, a statistical analysis was applied. The Post-Hoc Tukey HSD (Honestly Significant Difference) test was used coupled with analysis of variance (ANOVA) for comparison among three or more groups. Tukey’s is a statistical test to identify the differences among groups of data and consists of a single multi-step process for comparison, carried out in conjunction with ANOVA. The test identifies where the difference between two mean values is higher than the standard error which could be expected. For comparisons among two groups the independent samples T test was used. For statistical analysis was used the statistical software SPSS version 23 (IBM, Inc.) and the level of significance considered was 5% (p < 0.05).
3 Results and discussion
3.1 Dimensions and chemical properties
The average dimensions of the kiwi slices were DL = 4.63 ± 0.15 cm and DS = 3.81 ± 0.37 cm, and they
indicate that the kiwis used were very uniform in size given the low coefficient of variation (3% and 10%, respectively for the longest and shortest diameters). The differences between these two diameters were found statistically significant (Independent samples T-test: t = 10.185, p < 0.0005).
Table 1 shows the moisture content and water activity as well as some bioactive components (vitamin C and phenolic compounds) and antioxidant activity in the fresh kiwi and in the dried samples. The moisture content of the fresh kiwi was 77% (wet basis), which was close to the values reported by Kaya et al. (2008) and by Simal et al. (2005), which were 81% and 82% wb, respectively, for fresh kiwi fruits. The dried samples all exhibited moisture contents under 20%, established as the end point of drying, according to conservation criteria, since this value allowed good preservation still maintaining good final
9 physical and chemical properties (Guiné et al., 2007). Furthermore, as the temperature increased, the moisture content diminished and the samples became more dehydrated. Statistical significant differences were found between the moisture content of the fresh and the dried kiwi samples (ANOVA: F = 1324.353; p < 0.0005). Post hock tests showed that only the samples dried at 60ºC and 70ºC were not statistically different in terms of moisture. The water activity of the dried samples was significantly reduced in comparison with the fresh sample (ANOVA: F = 683.233; p < 0.0005), thus allowing the preservation of the food, since low values of aw no microbial, chemical and enzymatic reactions occur
(Guiné, 2015).
The vitamin C content for the fresh kiwi was 535 mg of ascorbic acid 100 g-1 dry weight (dw), and this value was very similar to that reported by Leontowicz et al. (2016) also for the Hayward kiwi, which was 598 mg AA 100 g-1 dw. The dying of the kiwi samples induced a statistically significant decreased in the vitamin C content (ANOVA: F = 2235.771; p < 0.0005), with losses of 73%, 76%, 79% and 82%, as the temperature increased from 50ºC to 80ºC. The vitamin C is a thermo-liable vitamin that degrades to a certain extent according to the food matrix, the moisture content and the drying temperature (Rodríguez et al., 2016; Santos and Silva, 2008).
The TPC content in the fresh kiwi was found to be 3376 mg GAE 100 g-1 dw (Table 1), which was much higher than that reported by Leontowicz et al. (2016) for the same kiwi variety (541-547 mg GAE 100 g
-1
dw). Also Park et al. (2014) found TPC content of 1.15 mg GAE g dw-1 for Hayward kiwi, and this was again lower than that found in the present work. Regarding the effect of drying on the TPC, it was found that the drying operation significantly affected the concentrations (ANOVA: F = 143.136; p < 0.0005), with a decrease of 72%, 80%, 88% and 93%, respectively at 50ºC, 60ºC, 70ºC and 80ºC. Hot air drying has been reported to induce losses of soluble phenolics in fruits and vegetables (Guiné et al., 2015; Nunes et al., 2016), which may be attributed to non-enzymatic and enzymatic oxidative reactions. The value of the AOA in the fresh kiwi was found as 6160 µmol TE 100 g-1
dw (Table 1), which was again considerably higher when compared to the values registered by Leontowicz et al. (2016) for the Hayward kiwi (649-720 µmol TE 100 g-1 dw), determined also by the DPPH method. Park et al. (2014) also determined the DPPH AOA of Hayward kiwi and the value they found (0.65 – 6.95 µmol TE 100 g- 1 dw), was again lower than the one obtained in the present work. However, the high AOA of the fresh kiwi was drastically reduced with drying (by 76%, 83%, 91% and 97%, as the temperature rose from 50ºC to 80ºC), with statistical significant differences between the samples (ANOVA: F = 216.482; p < 0.0005). The exposure to high temperature has been associated with the degradation of compounds
10 with antioxidant activity and therefore it was expected that by increasing drying temperature the retention of the AOA might be diminished. The degradation of compounds with AOA might be due to denaturation and/or degradation and also to the change in the extraction characteristics. In fact, in the drying procedure the product was exposed to high temperatures for a certain period of time and the longer that time the greater degradation of the ingredients it caused. Besides, when the drying is very fast, unfavourable shrinkage occurs and that may affect the extraction, since some compounds may not be efficiently extracted (Nakagawa et al., 2016).
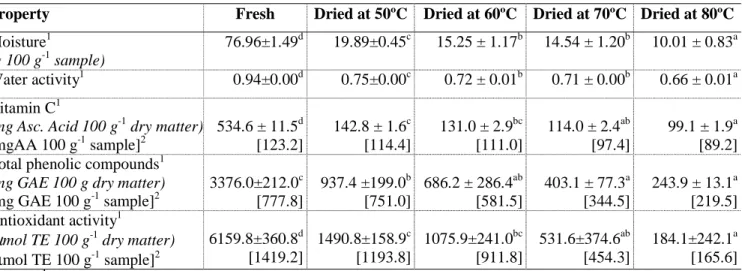
Table 1 Chemical properties of kiwi slices before and after drying at different temperatures
Property Fresh Dried at 50ºC Dried at 60ºC Dried at 70ºC Dried at 80ºC
Moisture1
(g 100 g-1 sample)
76.96±1.49d 19.89±0.45c 15.25 ± 1.17b 14.54 ± 1.20b 10.01 ± 0.83a Water activity1 0.94±0.00d 0.75±0.00c 0.72 ± 0.01b 0.71 ± 0.00b 0.66 ± 0.01a Vitamin C1
(mg Asc. Acid 100 g-1 dry matter)
[mgAA 100 g-1 sample]2 534.6 ± 11.5d [123.2] 142.8 ± 1.6c [114.4] 131.0 ± 2.9bc [111.0] 114.0 ± 2.4ab [97.4] 99.1 ± 1.9a [89.2] Total phenolic compounds1
(mg GAE 100 g dry matter)
[mg GAE 100 g-1 sample]2 3376.0±212.0c [777.8] 937.4 ±199.0b [751.0] 686.2 ± 286.4ab [581.5] 403.1 ± 77.3a [344.5] 243.9 ± 13.1a [219.5] Antioxidant activity1
(µmol TE 100 g-1 dry matter)
[µmol TE 100 g-1 sample]2 6159.8±360.8d [1419.2] 1490.8±158.9c [1193.8] 1075.9±241.0bc [911.8] 531.6±374.6ab [454.3] 184.1±242.1a [165.6] Note: 1Values in the same line with the same superscript are not statistically different (ANOVA with Tukey Post-Hoc, p< 0.05)
2
Content in wet basis = content in dry basis*[100 – moisture]/100
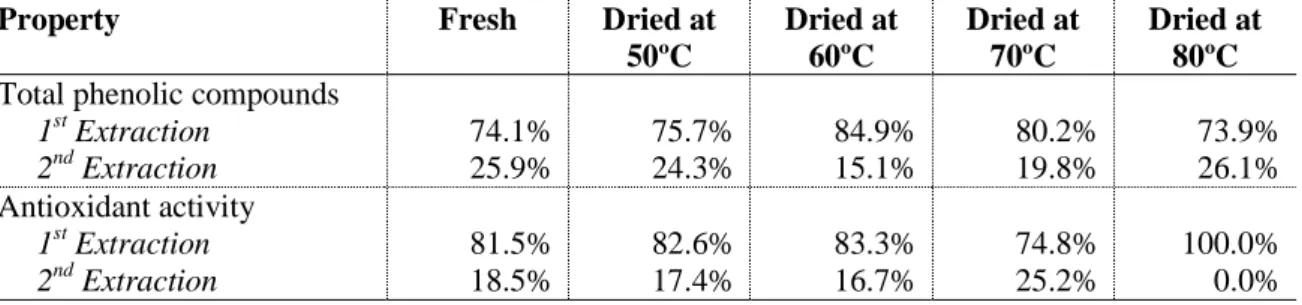
Table 2 presents the efficiency of the extractions referring to the quantification of the phenolic compounds and antioxidant activity. The results showed that the first extraction was substantially more efficient when compared to the second extraction performed on the same sample. While the first extraction accounted for about 74%-85% of the TPC, the second accounted for a much lower percentage of the phenolics detected. Still, it was possible to conclude that performing the two consecutive extractions were allowed recovering more phenolics than if only the first extraction was made. Similar results could be observed for the AOA, and in this case the first extraction accounted for 85% to 100% of the total values.
11 Table 2 Efficiency of the extractions for phenolic compounds and antioxidant activity
Property Fresh Dried at
50ºC Dried at 60ºC Dried at 70ºC Dried at 80ºC Total phenolic compounds
1st Extraction 2nd Extraction 74.1% 25.9% 75.7% 24.3% 84.9% 15.1% 80.2% 19.8% 73.9% 26.1% Antioxidant activity 1st Extraction 2nd Extraction 81.5% 18.5% 82.6% 17.4% 83.3% 16.7% 74.8% 25.2% 100.0% 0.0% 3.2 Colour
Table 3 shows the CIELab colour coordinates for the fresh and dried kiwi samples. The coordinates for the fresh kiwi were approximately 45, -10 and 23, respectively for lightness (L*), greenness (a*) and yellowness (b*). These values were similar to those reported by Nunes-Damaceno et al. (2013): 44, -5 and 23, respectively for L*, a* and b*.
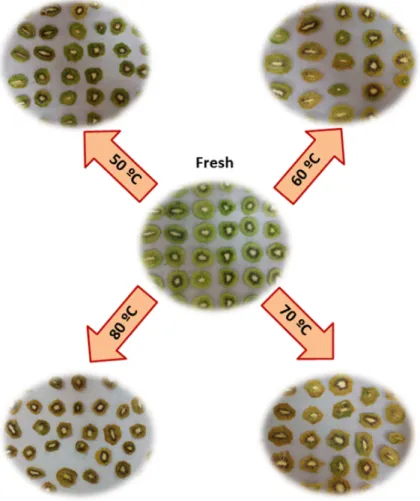
The lightness (L*) appeared to slightly increase with drying, but those differences were not statistically significant as demonstrated by the results of the statistical test performed (ANOVA, F = 3.031, p = 0.063). However, the opposing colour coordinate a* (greenness for negative values) tended to increase, thus indicating that the intensity of the green colour was reduced with drying (for all cases except the drying at 60ºC). These differences were statistically significant (ANOVA, F = 19.562, p < 0.0005). Regarding the other opposing colour coordinate, b* which accounted for yellow when the values were positive, it was observed that drying produced samples with significantly higher values (ANOVA, F = 9.254, p < 0.0005), thus indicating that the kiwi samples became less green and more yellow with drying. The total colour difference (∆E) significantly increased as the temperature increased (ANOVA, F = 5.075, p = 0.009), which is expected, because higher temperatures favoured the browning reactions that may occur in foods, such as enzymatic browning owing to the presence of polyphenoloxidase and oxygen (Guiné, 2015). Hence, the drying induced colour changes which were variable according to the drying temperature, as shown in Figure 4. Also chemical changes in pigments such as carotene (orange) and chlorophyll (green) were produced by heat and oxidation that occur during drying and, in general, the longer process and the higher temperature, the greater losses were in these pigments (Guiné, 2015).
12 Table 3 Colour coordinates of kiwi slices before and after drying at different temperatures
Colour coordinate Fresh Dried at 50ºC Dried at 60ºC Dried at 70ºC Dried at 80ºC
L*(lightness)1 45.34 ± 3.62a 47.45 ± 4.45a 53.49 ± 3.67a 49.26 ± 7.02a 52.43 ± 7.44a a*(greenness)1 - 9.69 ± 1.66a - 4.69 ± 2.60b - 9.93 ± 2.40a - 2.54 ± 1.64b - 2.90 ± 1.62b b*(yellowness)1 22.65 ± 2.37a 24.81 ± 3.97ba 33.15 ± 3.84c 30.94 ± 7.36bc 32.14 ± 3.08c ∆E(colour difference)1 8.03 ± 2.85 a 13.64 ± 4.73 ab 14.34 ± 4.26 ab 15.03 ± 4.26 b Note: 1Values in the same line with the same superscript are not statistically different (ANOVA with Tukey Post-Hoc, p < 0.05)
Figure 4 Colour of the fresh and dried kiwi.
3.3 Texture
Table 4 shows the results obtained for the textural characteristics of the kiwi samples. Firmness is the force required to compress a food between the teeth or between the tongue and mouth, and it comprises
13 the force required to cause deformation. Adhesiveness represents the force required to remove the material that adheres to a specific surface, e.g., lips, palate or teeth. Springiness or elasticity measures the ability to recover the shape after compression, and corresponds to the rate with which the product returns to the initial state after removal of the force which caused the deformation. Resilience is the energy used when applying a force to a material without occurring rupture, with or without any residual strain, and corresponds to an instant springiness. Cohesiveness represents the internal forces inside the food that maintain the sample as a whole; and finally, chewiness measures the energy required to disintegrate a food to a state that it could be swallowed (Cruz et al., 2015; Guiné et al., 2015; Guiné et al., 2014).
The results in Table 4 show that firmness was significantly different in the fresh and in the dried samples (ANOVA, F = 28.932, p < 0.0005), but did not vary according to the drying temperature significantly. Drying may diminish the firmness of fruits as reported for apples by Cruz et al. (2015) and Prothon et al. (2001). Adhesiveness decreased with drying (increased negative values), which might be related to the loss of water due to evaporation. The differences were statistically significant between the fresh and the dried samples (ANOVA, F = 938.203, p < 0.0005), but not according to the drying temperature applied, followed a trend already observed for firmness. Cohesiveness also showed significant differences (ANOVA, F = 65.578, p < 0.0005), and the values increased very significantly from the fresh to the dried states. A similar observation had been reported for the drying of apples by Cruz et al. (2015). This higher cohesiveness in the dried samples might be attributed to the shrinkage that occurred when a high amount of water was lost by evaporation, thus originating a denser product in which the internal forces are stronger. Springiness was observed to increase also very significantly from the fresh to the dried state (ANOVA, F = 4.800, p = 0.004), which might be due to the increased concentration of carbohydrates as a result of the moisture loss. Resilience showed a similar trend to that of springiness, with significant differences (ANOVA, F = 6.841, p = 0.001), which was expected since these two textural properties were much related. Finally, chewiness also increased significantly from the fresh to the dried state (ANOVA, F = 8.014, p < 0.0005), similarly to what had been reported for the drying of apples by Cruz et al. (2015). However, and contrarily to what was observed for the other textural parameters, in the case of chewiness for the lower temperatures the differences between the fresh sample were not significant.
14 Table 4 Textural parameters for kiwi slices before and after drying at different temperatures
Textural parameters Fresh Dried at 50ºC Dried at 60ºC Dried at 70ºC Dried at 80ºC
Firmness (N) 1 90.24 ± 14.16b 47.15 ± 23.97a 32.35 ± 14.16a 34.51 ± 5.18a 28.39 ± 7.80a Adhesiveness (N.s) 1 - 4.02 ± 0.17a - 0.21 ± 0.27b - 0.01 ± 0.03b - 0.07 ± 0.10b - 0.01 ± 0.01b Cohesiveness1 0.27 ± 0.06a 0.60 ± 0.04b 0.60 ± 0.04b 0.57 ± 0.03b 0.57 ± 0.04b Springiness (%)1 42.14 ± 6.57a 125.63 ± 65.78ab 144.06 ± 63.30b 161.34 ± 78.87b 178.68 ± 77.03b Resilience (%)1 13.33 ± 3.55a 22.58 ± 4.76b 20.22 ± 1.96b 21.43 ± 4.23b 19.88 ± 2.49b Chewiness (N)1 10.88 ± 5.49a 23.85 ± 10.44ab 27.80 ± 4.96ab 41.09 ± 14.02b 43.36 ± 18.65b Note: 1Values in the same line with the same superscript are not statistically different (ANOVA with Tukey Post-Hoc, p< 0.05)
3.4 Sensory analysis
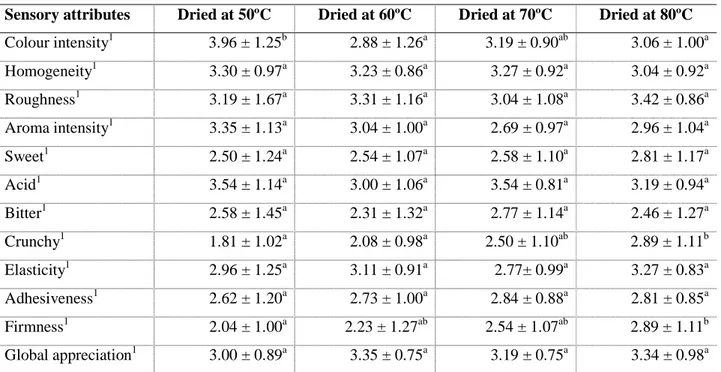
Table 5 presents the results obtained through the sensory evaluation made to the different dried samples. For most cases the judges were not able to differentiate the samples and therefore the small differences registered were not statistically significant. This was the case of the colour homogeneity (ANOVA, F = 0.441, p = 0.724), the roughness (ANOVA, F = 0.611, p = 0.609), the intensity of the aroma (ANOVA, F = 1.753, p = 0.161), the sweetness (ANOVA, F = 0.378, p = 0.769), the acidity (ANOVA, F = 1.875, = p 0.139), the bitterness (ANOVA, F = 0.582, p = 0.628), the elasticity (ANOVA, F = 1.173, p = 0.324), the adhesiveness (ANOVA, F = 0.273, p = 0.845), or the global appreciation (ANOVA, F = 1.103, p = 0.352). The textural parameters for which some significant differences were encountered, they were the intensity of the colour (ANOVA, F = 4.774, p = 0.004), the crunchy texture (ANOVA, F = 5.251, p = 0.002) and the firmness (ANOVA, F = 2.858, p = 0.041). These were also the parameters for which more differences could be perceived from the sensory profiles as shown in Figure 5.
Because the results of the sensory analysis were not statistically significant for most attributes and also for the global appreciation, it was not possible to establish what could be the most suitable drying conditions to meet the consumer’s preference.
15 Table 5 Scores in the sensory analysis for kiwi slices before and after drying at different
temperatures (Scale from a minimum score of 1 to a maximum score of 5)
Sensory attributes Dried at 50ºC Dried at 60ºC Dried at 70ºC Dried at 80ºC
Colour intensity1 3.96 ± 1.25b 2.88 ± 1.26a 3.19 ± 0.90ab 3.06 ± 1.00a Homogeneity1 3.30 ± 0.97a 3.23 ± 0.86a 3.27 ± 0.92a 3.04 ± 0.92a Roughness1 3.19 ± 1.67a 3.31 ± 1.16a 3.04 ± 1.08a 3.42 ± 0.86a Aroma intensity1 3.35 ± 1.13a 3.04 ± 1.00a 2.69 ± 0.97a 2.96 ± 1.04a Sweet1 2.50 ± 1.24a 2.54 ± 1.07a 2.58 ± 1.10a 2.81 ± 1.17a Acid1 3.54 ± 1.14a 3.00 ± 1.06a 3.54 ± 0.81a 3.19 ± 0.94a Bitter1 2.58 ± 1.45a 2.31 ± 1.32a 2.77 ± 1.14a 2.46 ± 1.27a Crunchy1 1.81 ± 1.02a 2.08 ± 0.98a 2.50 ± 1.10ab 2.89 ± 1.11b Elasticity1 2.96 ± 1.25a 3.11 ± 0.91a 2.77± 0.99a 3.27 ± 0.83a Adhesiveness1 2.62 ± 1.20a 2.73 ± 1.00a 2.84 ± 0.88a 2.81 ± 0.85a Firmness1 2.04 ± 1.00a 2.23 ± 1.27ab 2.54 ± 1.07ab 2.89 ± 1.11b Global appreciation1 3.00 ± 0.89a 3.35 ± 0.75a 3.19 ± 0.75a 3.34 ± 0.98a Note: 1Values in the same line with the same superscript are not statistically different (ANOVA with Tukey Post-Hoc, p < 0.05)
16 4 Conclusions
This work was allowed drawing some highlights about the effect of convective air drying and operating temperature in particular, in kiwi samples, at the chemical, physical and sensory levels, as it was intended in the objectives highlighted.
1. Regarding the chemical composition, the results showed that the dried samples had lower moisture content and water activity, thus allowing them to be preserved without probability of occurrence of deterioration reactions. However, the drying operation had a negative effect on the bioactive components like vitamin C, phenolic compounds and the antioxidant activity, and this was worsened as the drying temperature increased.
2. Regarding the physical properties, the colour was also affected by drying, although the values of total colour differences were not very significant. Still the dried samples became less green and more yellow when compared to the fresh kiwi. Regarding the textural properties, also in this case they were much affected by drying, therefore the dried samples showed different properties in relation to the fresh product, but the influence of temperature was not so evident.
3. Regarding the sensory properties, the sensory evaluation was allowed establishing the sensory profiles of the sample evaluated, but it was not possible to assess the panel’s favourite sample.
Acknowledgments
This work was financed by FCT - Fundação para a Ciência e Tecnologia, I.P., project UID/Multi/04016/2016. Furthermore we would like to thank the Instituto Politécnico de Viseu and CI&DETS for their support.
References
Official Methods of Analysis. 17th Ed. 2000. Washington: Association of Official Analytical Chemists.
Brand-Williams, W., M. E. Cuvelier, and C. Berset. 1995. Use of a free radical method to evaluate antioxidant activity. LWT - Food Science and Technology, 28(1): 25-30.
Collins, A. R., V. Harrington, J. Drew, and R. Melvin. 2003. Nutritional modulation of DNA repair in a human intervention study. Carcinogenesis, 24(3): 511-515.
Cruz, A. C., R. P. F. Guiné, and J. C. Gonçalves. 2015. Drying kinetics and product quality for convective drying of apples (Cvs. Golden Delicious and Granny Smith). International Journal of
17 Du, G., M. Li, F. Ma, and D. Liang. 2009. Antioxidant capacity and the relationship with polyphenol
and vitamin C in actinidia fruits. Food Chemistry, 113(2): 557-562.
Gonçalves, F. J., S. M. Rocha, and M. A. Coimbra. 2012. Study of the retention capacity of anthocyanins by wine polymeric material. Food Chemistry, 134(2): 957-963.
Guiné, R. P. F. 2015. Food Drying and Dehydration: Technology and Effect on Food Properties. Germany: LAP Lambert Academic Publishing GmbH and Co.
Guiné, R. P. F., F. Henriques, and M. J. Barroca. 2014. Influence of drying treatments on the physical and chemical properties of cucumber. Journal of Food Measurement and Characterization, 8 (3): 195-206.
Guiné, R. P. F., I. C. Almeida, A. C. Correia, and F. J. Gonçalves. 2015. Evaluation of the physical, chemical and sensory properties of raisins produced from crapes of the cultivar crimson. Journal
of Food Measurement and Characterization, 9(3): 337-346.
Guiné, R. P. F., and M. J. Barroca. 2014. Quantification of browning kinetics and colour change for quince (Cydonia oblonga Mill.) exposed to atmospheric conditions. Agricultural Engineering International: CIGR Journal, 16(4): 285-298.
Guiné, R. P. F., M. J. Barroca, F. J. Gonçalves, M. Alves, S. Oliveira, and M. Mendes. 2015. Artificial neural network modelling of the antioxidant activity and phenolic compounds of bananas submitted to different drying treatments. Food Chemistry, 168(3): 454-459.
Guiné, R. P. F., and M. J. Barroca. 2012. Effect of drying treatments on texture and color of vegetables (pumpkin and green pepper). Food and Bioproducts Processing, 90(1): 58-63.
Guiné, R. P. F., D. M. S. Ferreira, M. J. Barroca, and F. M. Gonçalves. 2007. Study of the drying kinetics of solar-dried pears. Biosystems Engineering, 98(4): 422-429.
Kaur, C., and H. C. Kapoor. 2001. Antioxidants in fruits and vegetables – the millennium’s health.
International Journal of Food Science and Technology, 36(7): 703-725.
Kaya, A., O. Aydın, and I. Dincer. 2008. Experimental and numerical investigation of heat and mass transfer during drying of Hayward kiwi fruits (Actinidia Deliciosa Planch). Journal of Food
Engineering, 88(3): 323-330.
Leontowicz, H., M. Leontowicz, P. Latocha, I. Jesion, Y. S. Park, E. Katrich, D. Barasch, A. Nemirovski, and S. Gorinstein. 2016. Bioactivity and nutritional properties of hardy kiwi fruit Actinidia arguta in comparison with Actinidia Deliciosa ‘Hayward’ and Actinidia eriantha ‘Bidan’. Food Chemistry, 196(6): 281-291.
Meilgaard, M., G. V. Civille, and B. T. Carr. 2006. Sensory Evaluation Techniques. (4th Ed). Boca raton, USA: CRC Press, Taylor and Francis Group.
Nakagawa, K., W. Ritcharoen, P. Sri-Uam, P. Pavasant, and S. Adachi. 2016. Antioxidant properties of convective-air-dried spirulina maxima: evaluation of phycocyanin retention by a simple mathematical model of air-drying. Food and Bioproducts Processing, 100(4): 292-302.
Nunes, J. C., M. G. Lago, V. N. Castelo-Branco, F. R. Oliveira, A. G. Torres, D. Perrone, and M. Monteiro. 2016. Effect of drying method on volatile compounds, phenolic profile and antioxidant capacity of guava powders. Food Chemistry, 197(7): 881-890.
18 Nunes-Damaceno, M., N. Muñoz-Ferreiro, M. A. Romero-Rodríguez, and M. L. Vázquez-Odériz. 2013. A comparison of kiwi fruit from conventional, integrated and organic production Ssystems. LWT
- Food Science and Technology, 54(1): 291-297.
Park, Y. S., H. Leontowicz, M. Leontowicz, J. Namiesnik, M. Suhaj, M. Cvikrová, O. Martincová, M. Weisz, and S. Gorinstein. 2011. Comparison of the contents of bioactive compounds and the level of antioxidant activity in different kiwifruit cultivars. Journal of Food Composition and
Analysis, 24(7): 963-970.
Park, Y. S., J. Namiesnik, K. Vearasilp, H. Leontowicz, M. Leontowicz, D. Barasch, A. Nemirovski, S. Trakhtenberg, and S. Gorinstein. 2014. Bioactive compounds and the antioxidant capacity in new kiwi fruit cultivars. Food Chemistry, 165(20): 354-361.
Peschel, W., F. Sánchez-Rabaneda, W. Diekmann, A. Plescher, I. Gartzía, D. Jiménez, R. Lamuela-Raventós, S. Buxaderas, and C. Codina. 2006. An industrial approach in the search of natural antioxidants from vegetable and fruit wastes. Food Chemistry, 97(1): 137-150.
Prothon, F., L. M. Ahrné, T. Funebo, S. Kidman, M. Langton, and I. Sjöholm. 2001. Effects of combined osmotic and microwave dehydration of apple on texture, microstructure and rehydration characteristics. LWT - Food Science and Technology, 34(2): 95-101.
Ratti, C. 2001. Hot air and freeze-drying of high-value foods: A review. Journal of Food Engineering, 49(4): 311-319.
Rodríguez, O., W. Gomes, S. Rodrigues, and F. A. N. Fernandes. 2016. Effect of acoustically assisted treatments on vitamins, antioxidant activity, organic acids and drying kinetics of pineapple.
Ultrasonics Sonochemistry, 35(2): 92-102.
Rush, E. C., M. Patel, L. D. Plank, and L. R. Ferguson. 2002. Kiwifruit promotes laxation in the elderly.
Asia Pacific Journal of Clinical Nutrition, 11(2): 164-168.
Santos, P. H. S., and M. A. Silva. 2008. Retention of vitamin C in drying processes of fruits and vegetables-A review. Drying Technology, 26(12): 1421-1437.
Santos, S. C. R. V. L., R. P. F. Guiné, and A. Barros. 2014. Effect of drying temperatures on the phenolic composition and antioxidant activity of pears of Rocha variety (Pyrus communis L.).
Journal of Food Measurement and Characterization, 8(2): 105-112.
Santos, S. C. R. V. L., R. P. F. Guiné, and A. I. A. Barros. 2013. Influence of drying on the properties of pears of the Rocha variety (Pyrus communis L.). International Journal of Food Engineering, 9(2): 197-207.
Simal, S., A. Femenia, M. C. Garau, and C. Rosselló. 2005. Use of exponential, page’s and diffusional models to simulate the drying kinetics of kiwi fruit. Journal of Food Engineering, 66(3): 323-328.
Szadzińska, J., J. Łechtańska, S. J. Kowalski, and M. Stasiak. 2017. The effect of high power airborne ultrasound and microwaves on convective drying effectiveness and quality of green pepper.
Ultrasonics Sonochemistry, 34(1): 531-539.
Tavarini, S., E. Degl’Innocenti, D. Remorini, R. Massai, and L. Guidi. 2008. Antioxidant capacity, ascorbic acid, total phenols and carotenoids changes during harvest and after storage of Hayward kiwifruit. Food Chemistry, 107 (1): 282-288.