CIÊNCIAS AGRÁRIAS, ALIMENTARES E VETERINÁRIAS AGRICULTURAL SCIENCES, FOOD AND VETERINARY
CIENCIAS AGRÍCOLAS, ALIMENTOS Y VETERINARIA
millenium
10
1
Millenium, 2(4), 101-111
A EDUCAÇÃO COMO INSTRUMENTO PARA REDUÇÃO DA PEGADA HÍDRICA DOS JOVENS
EDUCATION AS A TOOL TO REDUCE THE WATER FOOTPRINT OF YOUNG PEOPLE
LA EDUCACIÓN COMO INSTRUMENTO PARA REDUCCIÓN DE LA PEGADA HÍDRICA DE LOS JÓVENES
Milda Venckute
1Manuela Moreira da Silva
2Mauro Figueiredo
21University of Algarve, Institute of Engineering, Portugal
2University of Algarve, Institute of Engineering. Centre for Marine and Environmental Research – CIMA, Portugal
Milda Venckute - [email protected] | Manuela Moreira da Silva - [email protected] | Mauro Figueiredo - [email protected]
Corresponding Author Milda Venckute
Instituto Superior de Engenharia (ISE) Campus da Penha
8005-139 Faro, Portugal [email protected]
RECEIVED: 10th of July, 2017 ACCEPTED: 28th of September, 2017
Venckute, M., Silva, M. M., & Figueiredo, M. (2017). Education as a tool to reduce the water footprint of young people. Millenium, 2(4), 101-111.
m
4
102
102
RESUMO
Introdução: No atual contexto de alterações globais, a água é um bem escasso em muitas realidades geográficas. A educação da
população jovem tem um papel particularmente relevante, na gestão sustentável da água.
Objetivos: Estimar a Pegada Hídrica (PH) em jovens, incluindo os usos diretos e indiretos de água. Desenvolver uma aplicação
educacional, para mostrar medidas simples de poupança de água nas suas atividades diárias.
Métodos: Foram desenvolvidos dois questionários, o primeiro para calcular a PH dos jovens, e o segundo para servir de base ao
jogo educacional. Participaram 82 estudantes entre os 12 e os 15 anos.
Resultados: A PH média nos jovens é de 3223 ± 830 L/dia. Os usos indiretos de água são cerca de dez vezes superiores aos usos
diretos. Nos usos indiretos, a alimentação representa a maior parte da PH (84.4 %) e em 2º lugar vêm os relacionados com o vestuário (6.4%). Nos grupos de alimentos estudados, a carne representa a maior contribuição (39.6% da PH). Para ambos os sexos, o elevado consumo direto de água (aprox. 264 L/dia) é devido a duches prolongados.
Conclusões: Os jovens estão a consumir demasiada água, devendo rever hábitos na alimentação, no vestuário, e na duração dos
duches diários.
Palavras-chave: Educação dos Jovens; Pegada Hídrica; Hábitos de Consumo.
ABSTRACT
Introduction: Due to the global changes, fresh water became scarce in many geographical realities. In this domain, education can
play a significant role, contributing to the sustainable water management.
Objectives: Estimate the Water Footprint (WF) of young people, including their direct and indirect water uses. Develop an
educational application that aims to exemplify measures which lead to water conservation in their daily activities.
Methods: Two questionnaires. The first one was formulated in order to estimate the average WF of a young person, and the
second one to establish the basis of the educational application. Samples included 82 students in the 12 – 15 age range.
Results: The average WF of a student is 3223±830 L/day. The total indirect water use is over 10 times higher than direct use. Food
accounts for the major part (84.4 %) of young person’s WF, and in the second place of indirect uses is clothing-related WF (6.4 %). Among analysed food groups, meat has the largest contribution (39.6 %) to the total personal WF. For both genders, high direct water use (264 L/day) is due in large part to long showers.
Conclusions: Young people consume too much fresh water, what suggests the need to improve their behaviour in terms of eating
habits, clothing and shower duration.
Keywords: Education of Young People; Water Footprint; Consumer’s Behaviour.
RESUMEN
Introducción: En el actual contexto de cambios globales, el agua es un bien escaso en muchas realidades geográficas. La educación
de la población puede desempeñar un papel relevante en su concienciación sobre la gestión sostenible del agua.
Objetivos: Este estudio se realizó en el Algarve, y pretendió estimar la Huella Hídrica (HH) en los jóvenes, incluyendo sus usos
directos e indirectos de agua. También se desarrolló un juego educativo, que permitió mostrar medidas simples para ahorrar agua en sus actividades diarias.
Métodos: Se desarrollaron dos cuestionarios, el primero para calcular la HH de los jóvenes, y el segundo para servir de base al
juego educativo. Participaron 82 estudiantes entre los 12 y los 15 años.
Resultados: La HH media en los jóvenes es de 3223 ± 830 L /día, y los usos indirectos de agua son cerca de diez veces superiores
a los usos directos. En los usos indirectos, la alimentación representa la mayor parte de su HH (84.4%) y en 2º lugar ven los relacionados con la vestimenta (6.4%). Entre los diversos grupos de alimentos estudiados, la carne representó la mayor contribución a HH (39.6%).En los dos sexos, el alto consumo directo de agua (aprox. 264 L / día) es debido a duchas largas.
Conclusiones: Los jóvenes están consumiendo demasiada agua, debiendo revisar hábitos en la alimentación, en la ropa, y en la
duración de los duchas diarios.
Venckute, M., Silva, M. M., & Figueiredo, M. (2017).
Education as a tool to reduce the water footprint of young people. Millenium, 2(4), 101-111.
m
4
103
INTRODUCTION
Education is an indispensable element of prosperity, it is one of the three key dimensions of Human Development Index (United Nations Development Programme, 2013). Education provides people with skills, knowledge and comprehension that forms the world and determines the future of humanity. In 1992, United Nations Conference on Environment and Development issued Agenda 21, as an action plan for the 21st Century to be implemented by the organizations of UN System. One of the actions identified in Agenda 21 was to reorientate education towards sustainable development: formal and non-formal education are critical to change people’s attitudes and to improve their capacity to address environmental and development issues (United Nations Conference on Environment & Development, 1992). According to Mekonnen and Hoekstra (2016), 3.97 billion people face severe water scarcity at least 1 month in a year, 1.78 billion are facing during at least 6 months per year, and 0.50 billion during all year. It is clear, that water, among other natural resources, is one of the priorities to be addressed by Education for Sustainable Development. Water education, as a mean of Integrated Water Resources Management, has a huge potential in addressing water users. According to Stern (2000), there are four major variables influencing pro-environmental behaviour: 1) attitudes (norms, beliefs and values); 2) contextual forces (laws and regulations, policies, available technology); 3) personal capabilities (knowledge and skills required for particular actions, social and economic status, time availability); and 4) habits (or routines). When addressing a water user, education can have influence on attitudes, knowledge, skills and habits. Therefore, three of four variables can be positively affected by education, what is intended in the current work.
This work aimed to estimate and analyse the water footprint of young citizens and create an educational tool that would encourage them to reduce their water footprints.
1. METHODS
In order to estimate the WF of a young person, a questionnaire on direct and indirect water uses was developed. Meanwhile, we also started the creation of the educational tool by formulating the educational quiz.
A project called Your WaterFootprint was developed in collaboration with two schools in Faro (Algarve, Portugal), involving students of secondary generaleducation. Each student filled the created questionnaire and took the educational quiz. This way we carried out the study on young person’s WF and tested the created educational quiz. It permitted to estimate the daily average WF of a young person and analyse the different aspects that affect it. The results of this study were also used to verify the content of the educational quiz, which was optimized taking into account its testing results.
1.1 Sample
The questionnaires were distributed to students of secondary general education up to 15 years old (in Portuguese system – ensino
básico, 3o ciclo). From over 100 students who participated in the study,82 students (47 girls and 35 boys) correctly filled the created
questionnaire.
1.2 Data collection instruments and procedures
The first task of the study was the development of the questionnaire that would allow to obtain data from young people to make the most realistic estimation and at the same time would serve as an educational tool. Theintention to addressyoungpeopleimpliedtworestrictions: the lack of awareness of young people to respond to certain questions, considering that significant number of young people cannot provide with some specific information, for example – shower flow or amount of meat consumed in a week; andthe time limit - the questionnaire cannot take longer than 45 minutes, an academic hour in schools. A very exhaustive questionnaire is not suitable for young people because they would lose interest to complete it. These restrictions determined the development of the adapted questionnaire.
The questionnaire was divided into two major parts: Direct Water Use and Indirect Water Use. For both parts of the questionnaire a number of values were established.
Assuming that a 12-15 year old person is not well aware of water usage of devices, we attributed values to certain devices and actions and formulated questions in a way to obtain the information needed to estimate water usage. For example, considering shower flow to be 12 L/min, in the questionnaire we ask to provide with the average time spent in shower daily.
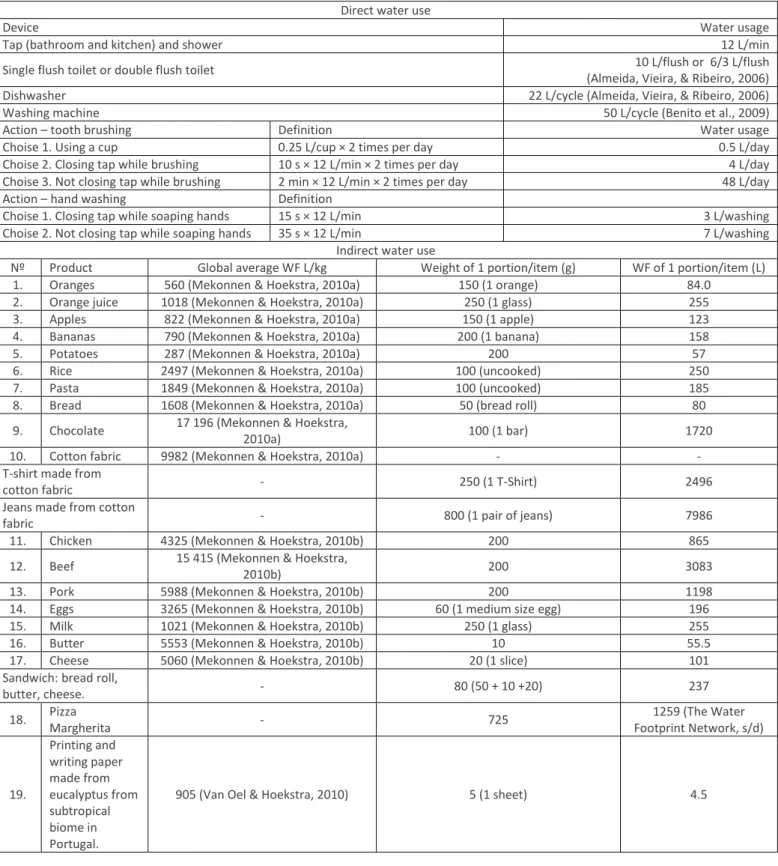
The most important criterion in choosing questions related to indirect water use was student’s ability to respond to the question. For example, it was decided to formulate questions about products that could be easily quantified in units or portions rather than grams. The second criterion was the popularity of the products and goods. The questionnaire could not cover a big variety of products. For that reason, one question represents a group of products or goods. For instance, apples, bananas and oranges were chosen to represent WF related to fruit consumption. T-Shirts and jeans were chosen to represent clothing not only because these are popular clothes among young people, but also because they are mostly made of cotton, which makes the estimation more precise. The values used to calculate direct and indirect water use are presented in the Table 1.
Venckute, M., Silva, M. M., & Figueiredo, M. (2017). Education as a tool to reduce the water footprint of young people. Millenium, 2(4), 101-111.
m
4
104
102
Table 1. Values used to calculate direct and indirect water use
Direct water use
Device Water usage
Tap (bathroom and kitchen) and shower 12 L/min
Single flush toilet or double flush toilet 10 L/flush or 6/3 L/flush
(Almeida, Vieira, & Ribeiro, 2006)
Dishwasher 22 L/cycle (Almeida, Vieira, & Ribeiro, 2006)
Washing machine 50 L/cycle (Benito et al., 2009)
Action – tooth brushing Definition Water usage
Choise 1. Using a cup 0.25 L/cup × 2 times per day 0.5 L/day
Choise 2. Closing tap while brushing 10 s × 12 L/min × 2 times per day 4 L/day
Choise 3. Not closing tap while brushing 2 min × 12 L/min × 2 times per day 48 L/day
Action – hand washing Definition
Choise 1. Closing tap while soaping hands 15 s × 12 L/min 3 L/washing
Choise 2. Not closing tap while soaping hands 35 s × 12 L/min 7 L/washing
Indirect water use
Nº Product Global average WF L/kg Weight of 1 portion/item (g) WF of 1 portion/item (L)
1. Oranges 560 (Mekonnen & Hoekstra, 2010a) 150 (1 orange) 84.0
2. Orange juice 1018 (Mekonnen & Hoekstra, 2010a) 250 (1 glass) 255
3. Apples 822 (Mekonnen & Hoekstra, 2010a) 150 (1 apple) 123
4. Bananas 790 (Mekonnen & Hoekstra, 2010a) 200 (1 banana) 158
5. Potatoes 287 (Mekonnen & Hoekstra, 2010a) 200 57
6. Rice 2497 (Mekonnen & Hoekstra, 2010a) 100 (uncooked) 250
7. Pasta 1849 (Mekonnen & Hoekstra, 2010a) 100 (uncooked) 185
8. Bread 1608 (Mekonnen & Hoekstra, 2010a) 50 (bread roll) 80
9. Chocolate 17 196 (Mekonnen & Hoekstra,
2010a) 100 (1 bar) 1720
10. Cotton fabric 9982 (Mekonnen & Hoekstra, 2010a) - -
T-shirt made from
cotton fabric - 250 (1 T-Shirt) 2496
Jeans made from cotton
fabric - 800 (1 pair of jeans) 7986
11. Chicken 4325 (Mekonnen & Hoekstra, 2010b) 200 865
12. Beef 15 415 (Mekonnen & Hoekstra,
2010b) 200 3083
13. Pork 5988 (Mekonnen & Hoekstra, 2010b) 200 1198
14. Eggs 3265 (Mekonnen & Hoekstra, 2010b) 60 (1 medium size egg) 196
15. Milk 1021 (Mekonnen & Hoekstra, 2010b) 250 (1 glass) 255
16. Butter 5553 (Mekonnen & Hoekstra, 2010b) 10 55.5
17. Cheese 5060 (Mekonnen & Hoekstra, 2010b) 20 (1 slice) 101
Sandwich: bread roll,
butter, cheese. - 80 (50 + 10 +20) 237 18. Pizza Margherita - 725 1259 (The Water Footprint Network, s/d) 19. Printing and writing paper made from eucalyptus from subtropical biome in Portugal.
905 (Van Oel & Hoekstra, 2010) 5 (1 sheet) 4.5
An example of the question from the developed questionnaire is provided below. How much water do you consume to wash your hands?
a) I turn off the tap while I soap my hands. Number of hand washings per day × 3 L/washing
b) I do not turn off the tap while I soap my hands. Number of hand washings per day × 7L/washing
Venckute, M., Silva, M. M., & Figueiredo, M. (2017).
Education as a tool to reduce the water footprint of young people. Millenium, 2(4), 101-111.
m
4
105
1.3 Statistical analysis
For the statistical analysis of data Excel 2013 was used. In total, 22 variables were analysed in two cases: 1) taking into consideration all students and 2) separating males and females. For the statistical significance p < 0.05 was considered.
1.4 Educational application
The aim of the educational application is to encourage young citizens to reduce their WFs. Learning requires attention and, thus, it was decided that the application should have a form of a quiz because answering to questions requires more concentration and involvement. The application seeks not to test the knowledge but to provide with it. The results of study by Leeuw, Valois and Seixas (2014)showed that the most determining factor stimulating to perform environmentally sustainable behaviours among high school students is student’s sense of control over behaviour: the higher is the feeling of control over behaviour, the higher is intention to perform it. Therefore, it was decided that questions must not be complicated, because it is intended to demonstrate that every person can easily adapt behaviours and habits that lead to water conservation.
Formulation of the content
The first step was the establishment of the key requirements for the educational application. It was decided that this application must: educate youth to conserve water; introduce the concepts personal WF and WF of a product; demonstrate that each person uses water directly and indirectly and that conscious adequate behaviour can reduce the personal WF; contain the relevant and important information that addresses individual attitudes with information on how direct and indirect water uses can be reduced; address the concept that water is a globally shared resource; and finally, the application should have a colourful design attractive for the younger audience.
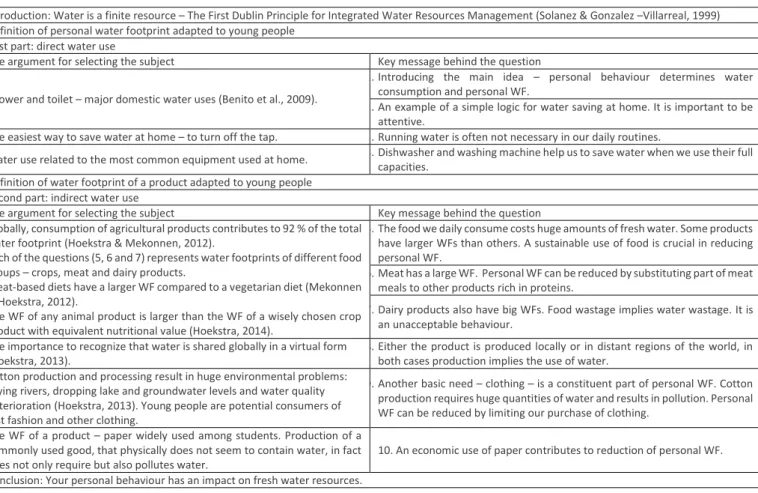
The following stage was ananalysis of literature addressing the WF topic. This has permited to find the most relevant information and establish the content and the structure of the educational application. Based on this content and structure, the educational quiz was formulated. Table 2 represents the arguments for choosing the subject of each question and the key message behind each question – the educational content.
Table 2. The content and the structure of the educational application
Introduction: Water is a finite resource – The First Dublin Principle for Integrated Water Resources Management (Solanez & Gonzalez –Villarreal, 1999) Definition of personal water footprint adapted to young people
First part: direct water use
The argument for selecting the subject Key message behind the question Shower and toilet – major domestic water uses (Benito et al., 2009).
1. Introducing the main idea – personal behaviour determines water consumption and personal WF.
2. An example of a simple logic for water saving at home. It is important to be attentive.
The easiest way to save water at home – to turn off the tap. 3. Running water is often not necessary in our daily routines.
Water use related to the most common equipment used at home. 4. Dishwasher and washing machine help us to save water when we use their full capacities.
Definition of water footprint of a product adapted to young people Second part: indirect water use
The argument for selecting the subject Key message behind the question Globally, consumption of agricultural products contributes to 92 % of the total
water footprint (Hoekstra & Mekonnen, 2012).
Each of the questions (5, 6 and 7) represents water footprints of different food groups – crops, meat and dairy products.
Meat-based diets have a larger WF compared to a vegetarian diet (Mekonnen & Hoekstra, 2012).
The WF of any animal product is larger than the WF of a wisely chosen crop product with equivalent nutritional value (Hoekstra, 2014).
5. The food we daily consume costs huge amounts of fresh water. Some products have larger WFs than others. A sustainable use of food is crucial in reducing personal WF.
6. Meat has a large WF. Personal WF can be reduced by substituting part of meat meals to other products rich in proteins.
7. Dairy products also have big WFs. Food wastage implies water wastage. It is an unacceptable behaviour.
The importance to recognize that water is shared globally in a virtual form (Hoekstra, 2013).
8. Either the product is produced locally or in distant regions of the world, in both cases production implies the use of water.
Cotton production and processing result in huge environmental problems: drying rivers, dropping lake and groundwater levels and water quality deterioration (Hoekstra, 2013). Young people are potential consumers of fast fashion and other clothing.
9. Another basic need – clothing – is a constituent part of personal WF. Cotton production requires huge quantities of water and results in pollution. Personal WF can be reduced by limiting our purchase of clothing.
The WF of a product – paper widely used among students. Production of a commonly used good, that physically does not seem to contain water, in fact does not only require but also pollutes water.
10. An economic use of paper contributes to reduction of personal WF. Conclusion: Your personal behaviour has an impact on fresh water resources.
Venckute, M., Silva, M. M., & Figueiredo, M. (2017). Education as a tool to reduce the water footprint of young people. Millenium, 2(4), 101-111.
m
4
106
102
Verification and optimization
The development of the application included a phase that permitted to test, verify the content and optimize the created educational quiz. In order to assess the clarity of created quiz, it was tested with students. Testing results of the educational quiz in conjunction with the results of the study on the WF of a young person were used to optimize the quiz and verify its content. These verifications allowed proceeding to the creation of the application.
2 RESULTS AND DISCUSSION
2.1 Water Footprint of a young personThe results of the study are supported by the data obtained from 82 school students. The obtained data permitted to estimate the average daily WF of a young person: 3223±830 L. This value does not differ significantly between genders (t-test, p=0.758). Figure 1 illustrates the contribution of indirect water use: food, clothes and paper and direct water use to the total daily WF of a young person.
Figure 1. Distribution of young person's WF
The age of the audience and the time limit did not permit to quantify the WF related to the use of many industrial products, which, according to Hoekstra and Mekonnen (2012), at a global level contributes to 4.7 % of the total WF related to consumption. For the same reason, the study could not consider some food groups.
Indirect water use accounts for 91.8 % of the personal WF what makes it 11 times higher than direct use. Considering the fact that this study covers most of personal direct water uses and does not cover some remaining indirect water uses, it is logical that the actual portion of indirect water use is even bigger.
Direct water uses
Direct water use accounts for a relatively small part (8.19 %) of the total WF of a young person. However, the volume - 264 L/day is very high, when compared with 100 L/day, which is the average quantity of water that is considered enough to meet all consumption and hygiene needs (Howard & Bartram, 2003).
The contribution of different daily direct water uses is uneven. Showers account for the biggest part of direct water use, corresponding to 164 L/person/day (or 62.0 % of total direct water use), the second one is toilet flushing - about 47 L/person/day (17.7 %), followed by hand washing (7.07 %) and running water used to wash the dishes (6.92 %). Washing machine water use
2720 L 206 L 32.8 L 264 L
Fig1. Distribution of young person's WF
Food 84.4 % Clothes 6.39 % Paper 1.02 %
Venckute, M., Silva, M. M., & Figueiredo, M. (2017).
Education as a tool to reduce the water footprint of young people. Millenium, 2(4), 101-111.
m
4
107
makes up 3.39 % of the total. The least significant consumptions are: water used for tooth brushing and dishwasher water use – each of these uses accounts for less than 1.5 % of the total daily direct water use.
In this study shower and tap flow was considered to be 12 L/min (conventional shower and tap flow in Portugal). Certainly, it is not the actual flow in all the households of 82 respondents. If, for example, all the households had more efficient showers, with the flow of 9 L/min, the average daily shower water consumption would be 123 L. If the flow was even lower, for example, 7 L/min, average shower water use would reduce significantly, what proves the importance of water saving devices but the volume still would be very high - 96 L/person/day. It implies that shower water use is high because of the time spent in shower. As the study results showed, on average, a student daily spends 13 min 40 s in the shower. Logically, young person’s behaviour must be addressed, in order to significantly lower direct water use. We found differences between genders: girls on average spend 15 min 55 s in the shower and boys spend 10 min 41 s. In total direct water uses girls use 73 L/day more than boys and shower accounts for the major part of this difference - 63 L.
The second biggest direct water use, toilet flushing, included toilet flushing at school and toilet flushing at home. The average water use for toilet flushing at school is 18 L/person/day. The average water use for toilet flushing at home is 29 L/person/day. Thirty-nine of 82 students claimed to have toilets with dual flush systems at home. Assuming that the full flush is 6 L and the reduced flush is 3 L, the average water use for toilet flushing at home of these 39 students is 20 L/person/day. Forty-three students claimed to have conventional toilets at home. Assuming that 1 flush consumes 10 L of water, the average water use for toilet flushing at home of these 43 respondents is 38 L/person/day, which is nearly 2 times more than water consumption using dual flush system with 6 or 3 L/flush.
Most of young people (85.4 %) claim to turn off the tap while soaping hands.Also, 76.8 % of young people turn off the tap and 22.0 % use a cup when brushing teeth. These good habits certainly contribute to water saving. In contrast to that, over than 30 % of students have dishwashers at home but they still do the washing-up with running water. It is clear, that young person’s direct water use is determined by the combination of several major factors.
The statistical analysis of direct water uses showed that girls have a significantly higher consumption than boys (t-test, p=0.002). This is largely determined by shower water consumption, which differs significantly (t-test, p=0.003), as well as the use of water for laundry (t-test, p=0.001).
Indirect water uses
From indirect water uses, food distinguishes with the largest portion - it accounts for 84.4 % of the total young person’s WF. Although the questionnaire does not cover a big variety of products, it includes the main food groups, permitting to compare the contributions of different foods. Figure 2 illustrates the partial distribution of different foods within the total food WF.
Figure 2. Partial distribution of different foods within the total food-related WF
0 10 20 30 40 50 60 70 80 90 100 Fig 2. Partial distribution of different foods within the total food-related WF
Rice, potatoes, pasta 6.69 % Milk 8.68 % Orange juice 3.37 % Sandwiches 9.19 % Eggs 2.16 % Fruits 13.20 % Chocolate 6.42 % Pizza 3.42 % Meat 46.87 %
Venckute, M., Silva, M. M., & Figueiredo, M. (2017). Education as a tool to reduce the water footprint of young people. Millenium, 2(4), 101-111.
m
4
10
8
102
Fruits have the second biggest WF, but it is 3.5 times smaller than the WF of meat. Other remarkable analysed foods are cheese sandwiches (cereals and dairy), milk, side dishes: rice (cereals), pasta (cereals), potatoes (vegetables) and chocolate.
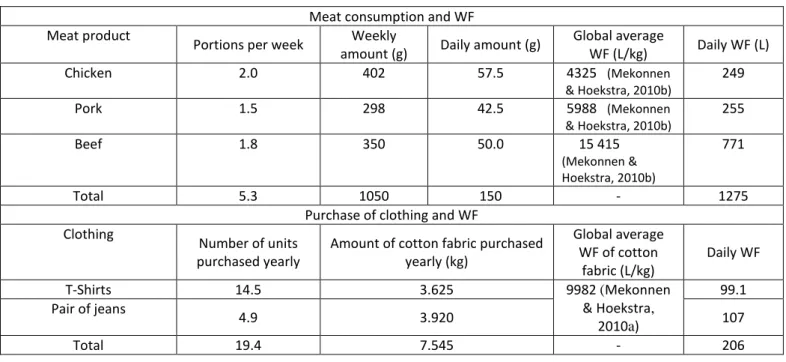
The proportion of meat WF is so significant that it is important to distinguish it. Meat accounts for 46.9 % of food WF what makes up 39.6 % of the total WF. To clarify why in young Portuguese WF meat has the largest input, a separate analysis was made. In this study, 3 kinds of meat were included: chicken, pork and beef. The questionnaire asked students to provide with the number of portions (1 portion = 200g) of different meats (chicken, pork and beef) consumed weekly. That permitted to calculate average weekly and daily consumption of these meat products, and the daily WF related to consumption of different meat products. This information is presented in Table 3.
Comparing the intake of different meats, chicken is the meat of the highest consumption, followed by beef and pork. In contrast to the intake of chicken, its calculated daily WF is the smallest, and the opposite accounts for pork and beef, their intakes are lower but their daily WFs are higher. Explanation for that is the fact that WFs of these meats differ substantially. As can be seen from the Table 3, the global average WF of 1 kg of beef is over 2.5 times bigger than the WF of 1 kg of pork ant the latter is over 1.3 times bigger than the WF of 1 kg of chicken.
If we compare meat WF (39.6 %) with clothing WF (6.39 %), the latter is relatively small. Yet, no precipitate conclusions can be made. The yearly number of purchased cotton T-Shirts (0.25 kg each) and jeans (0.8 kg each) allowed to find out the total amount of cotton fabric purchased during one year. That permitted to estimate the daily WF related to the purchase of clothing, as presented in Table 3.
Table 3. Meat and clothing related WF
Meat consumption and WF Meat product
Portions per week Weekly
amount (g) Daily amount (g)
Global average WF (L/kg) Daily WF (L) Chicken 2.0 402 57.5 4325 (Mekonnen & Hoekstra, 2010b) 249 Pork 1.5 298 42.5 5988 (Mekonnen & Hoekstra, 2010b) 255 Beef 1.8 350 50.0 15 415 (Mekonnen & Hoekstra, 2010b) 771 Total 5.3 1050 150 - 1275
Purchase of clothing and WF Clothing
Number of units purchased yearly
Amount of cotton fabric purchased yearly (kg) Global average WF of cotton fabric (L/kg) Daily WF T-Shirts 14.5 3.625 9982 (Mekonnen & Hoekstra, 2010a) 99.1 Pair of jeans 4.9 3.920 107 Total 19.4 7.545 - 206
Here it is crucial to note that clothing WF was estimated including only two cotton-based garments. As mentioned before, they were chosen to represent clothing not only because these are widely used garments among young people but also because they are mostly made of cotton what makes the estimation more accurate. As can be seen, the yearly purchase of T-Shirts and jeans is elevated. Considering that young people use many other kinds of clothes, we assume that the actual WF related to the purchase of clothing is, in fact, several times higher, especially in countries where outfit is determined by seasonal changes in weather.
Venckute, M., Silva, M. M., & Figueiredo, M. (2017).
Education as a tool to reduce the water footprint of young people. Millenium, 2(4), 101-111.
m
4
109
How to reduce the WF of a young person?
Based on this study, we are able to demonstrate, that certain alterations permit to reduce personal WF. We provide with a theoretical example of a daily WF reduction:
40 % less T-Shirts and jeans yearly → reduction of 83 L/day;
50 % less beef, 40 % less pork, 50 % less chocolate, 15 % less milk weekly → reduction of 386 + 102 + 87 + 35 = 610 L/day; 4 min shorter shower daily → reduction of 48 L/day.
These changes would permit to save a total of 741 L daily. Biggest reduction is related to diet, and, naturally, it requires careful considerations since reduction of meat intake implies reduction of proteins and amino acids. Based on the recommended daily intakes of these nutrients, a new water-friendly diet could be established for any age group. As marine fisheries require little to no fresh water inputs (Gephart, Pace & D’Odorico, 2014), a substantial part of proteins coming from meat could be replaced by marine fish. The combination of proteins from different sources would not only result in reduction of personal WF, but would also allow supplementing the diet naturally. This alternative is especially favourable for countries that have access to marine resources.
2.2 Educational tool – verification and optimization
The study on young person’s WF served to verify the content of the educational quiz. The analysis of personal WF has showed that food consumption is responsible for the major part of individual’s WF. It permitted to identify the foods with the highest WFs what proves the importance to include these products in the educational tool. The study showed that young people buy a lot of clothing what implies the need to address the WF related to the purchase of clothes. Analysis of direct water uses has showed that high direct water consumption is due in a large part to long shower duration, and, thus, it must be addressed. Toilet flushing and water use related to running water, namely, hand washing and dishwashing are other major water uses, what implies the need to include these subjects in the educational tool. The analysis also showed that the use of dishwasher contributes significantly to water saving, and, thus, it is relevant to emphasize the importance of using equipment in its full capacity.
In order to assess the clarity of the created educational quiz, the basis for the application, it was tested students. Testing results showed that majority of the questions were understood well by students because analysing each question separately, over 50 % of respondents managed to choose the correct answer. Although, there was one question where the rate of choosing incorrect answer was nearly 50 %, what seems to suggest that this question was not adequate to student’s knowledge. For that reason, this question was replaced leaving the same idea about unnecessary running water but changing the formulation of the question. Verification and optimization permitted to proceed to the creation of the application. The form of presentation and the visual content play an important role in the overall effect of the educational resource. The application, applied for young people, must be colourful and vivid. For that reason, the combination of traditional painting, photography, digital art and graphic design were used to create illustrations for the application.
The next stage of development of the application was programming. Based on the established project, the application was programmed in a way that: after reading the question, one of the three possible answers (A, B or C) must be chosen before proceeding; every question is followed by a correct answer containing important educational information; at the end, a summary of results is provided. Finally, a game development platform called Unity was used to create the application that was entitled as
Save Water.
CONCLUSIONS
The WF of a youngpersonishigh (3223 L/day), duein a largepart to indirectuses (91.8 %), whatimpliestheneed to addressindirectwateruse. Food is the major constituent (84.4 %) of the personal WF, what shows the importance to analyze dietary choices. It is natural that products with high WFs, like meat, and especially beef, have a large portion in young person’s WF. Therefore, minor or moderate changes in young person’s diet could result in significant fresh water savings. Clothing is also a significant component of indirect water use, as solely taking into account two most popular garments, they make up 6.39 % of the total WF. For that reason, it is crucial to teach young citizens about sustainable consumption. High direct water use, especially in case of girls, is due in a large part to long showers. It reveals a need to address and change the behaviour of youth towards water conservation.
According to the most recent UN estimate, based on the medium-variant projection, by 2050 the world population will reach 9.7 billion (United Nations Department of Economic and Social Affairs, Population Division, 2015). As for 2011, this estimate was 9.3 billion. With the reference to a latter number, Hoekstra (2013) states that to make sure that the total water footprint of humanity will not grow, by 2050 the average WF per capita must be reduced to 910 m3/year, which is around 2491 L/day. Thus, with the perspective of near future, an average young person from the study has to reduce the personal WF by around 732 L.
Venckute, M., Silva, M. M., & Figueiredo, M. (2017). Education as a tool to reduce the water footprint of young people. Millenium, 2(4), 101-111.
m
4
11
0
102
REFERENCES
Almeida, M., Vieira, P., & Ribeiro, R. (2006). Uso eficiente da água no setor urbano. Série Guias Técnicos 8. Laboratório Nacional de Engenharia Civil Lisboa, Portugal.
Benito, P., Mudgal, S., Dias D., Jean- Baptiste, V., Kong M., Inman, D., & Muro, M. (2009). Water Efficiency Standards: final report. Paris, Bio Intelligence Service and Cranfield University, Report for European Commission, (DG Environment). Retrieved from: http://ec.europa.eu/environment/water/quantity/pdf/Water%20efficiency%20standards_Study2009.pdf
Gephart, J. A., Pace, M. L., & D’Odorico, P. (2014). Freshwater savings from marine protein consumption. Environmental Research
Letters, 9(1), 1-8. http://doi.org/10.1088/1748-9326/9/1/014005
Hoekstra, A. Y., & Mekonnen, M. M. (2012). The water footprint of humanity. Proceedings of the National Academy of Sciences of
the United States of America, 109(9), 3232 – 3237. http://doi.org/10.1073/pnas.1109936109
Hoekstra, A. Y. (2013). The Water Footprint of Modern Consumer Society. Abington, Oxon, UK: Routledge.
Hoekstra, A. Y. (2014). The hidden water resource use behind meat and dairy. Animal frontiers, 2(2), 3-8. http://doi.org/10.2527/af.2012-0038
Howard, G., & Bartram, J. (2003). Domestic Water Quantity, Service, Level and Health. Geneva: World Health Organization. Retrieved from: http://apps.who.int/iris/bitstream/10665/67884/1/WHO_SDE_WSH_03.02.pdf
Leeuw, A., Valois, P., & Seixas, R. (2014). Understanding High School Students’ Attitude, Social Norm, Perceived Control and Beliefs to Develop Educational Interventions on Sustainable Development. Procedia - Social and Behavioural Sciences, 143, 1200 – 1209. http://doi.org/10.1016/j.sbspro.2014.08.160
Mekonnen, M.M., & Hoekstra, A. Y. (2010a). The green, blue and grey water footprint of crops and derived crops products. In
Value of Water Research Report Series nº 47: Vol.2, Delft, UNESCO-IHE Institute for Water Education. Retrieved from:
https://ris.utwente.nl/ws/portalfiles/portal/6453584
Mekonnen, M.M., & Hoekstra, A.Y. (2010b). The green, blue and grey water footprint of farm animals and animal products. In
Value of Water Research Report Series No. 48: Vol. 1, Delft, UNESCO-IHE, Instituto for Water Education. Retrieved from:
https://ris.utwente.nl/ws/portalfiles/portal/6453582
Mekonnen, M.M., & Hoekstra, A.Y. (2012). A Global Assessment of the Water Footprint of Farm Animal Products. Ecosystems, 15, 401–415. http://doi.org/10.1007/s10021-011-9517-8
Mekonnen, M.M., & Hoekstra, A. Y. (2016). Four billion people facing severe water scarcity. Science Advances, 2(2), e1500323. http://doi.org/10.1126/sciadv.1500323
Solanez, M., & Gonzalez -Villarreal, F. (1999). The Dublin Principles for Water as Reflected in a Comparative Assessment of
Institutional and Legal Arrangements for Integrated Water Resources Management. Stockholm: Global Water
Partnership/Swedish International Development Cooperation. Background Paper No 3. Retrieved from:
http://www.protos.ngo/en/dublin-principles-water-reflected-comparative-assessment-institutional-and-legal-arrangements
Stern, P.C. (2000). Toward a Coherent Theory of Environmentally Significant Behaviour. Journal of Social Issues, 56 (3), 407–424. http://doi.org/10.1111/0022-4537.00175
The Water Footprint Network: Resources: Product gallery. Retrieved from http://waterfootprint.org/en/
United Nations Conference on Environment & Development, Rio de Janeiro, Brasil (1992). Agenda 21: programme of action for sustainable development; Rio Declaration on Environment and Development; Statement of Forest Principles: the final text of agreements negotiated by governments at the United Nations Conference on Environment and Development (UNCED), 3-14 June 1992, Rio de Janeiro, Brasil. New York: United Nations Division for Sustainable Development. Retrieved from https://sustainabledevelopment.un.org/content/documents/Agenda21.pdf
United Nations Department of Economic and Social Affairs, Population Division (2015). World Population Prospects: The 2015
Revision, Key Findings and Advance Tables. Working Paper No. ESA/P/WP.24. New York: United Nations. Retrieved from:
Venckute, M., Silva, M. M., & Figueiredo, M. (2017).
Education as a tool to reduce the water footprint of young people. Millenium, 2(4), 101-111.
m
4
11
1
United Nations Development Programme (2013). Human Development Report. The Rise of the South: Human Progress in a Diverse World. New York: United Nations Development Programme. Retrieved from: http://hdr.undp.org/sites/default/files/reports/14/hdr2013_en_complete.pdf
Van Oel, P.R., & Hoekstra, A.Y. (2010). The green and blue water footprint of paper products: methodological considerations and quantification. In Value of Water Research Report Series Nº. 46, Delft, UNESCO-IHE, Instituto for Water Education. Acedido em https://ris.utwente.nl/ws/files/5146588/IHE-46_2010.pdf