I
Capital Structure and the impacts of legal systems
Paulo Alexandre da Silva PereiraDissertation
Master in Finance and Taxation
Supervised by
Prof. Doctor António Cerqueira (a) Prof. Doctor Elísio Brandão (a)
(a) University of Porto, School of Economics and Management
I
Biographical note
Paulo Alexandre da Silva Pereira is as Portuguese national born on 18th of May of 1995 in Barcelos. In 2013 he began to study Economics at the School of Economics and Management, University of Porto (FEP) in which he concluded in 2016, with a final grade of 16.
In the same year, he enrolled in Master of Finance and Taxation in FEP, to which he now candidates to obtain the master’s degree.
On a professional level, Paulo Pereira started working at KMPG Portugal in September 2017 as an Assistant Tax Consultant.
II
Acknowledgements
First, I would like to thank my advisers PhD Antonio Cerqueira and PhD Elísio Brandão for all guidance they gave me, from the beginning of my master, until the end, with the elaboration of my dissertation.
I would also like to thank all my colleagues in the Master of Finance and Taxation, for their cooperation and teamwork through these two years, as without them this master would have been much harder.
Finally, but not least, I would like to thank my family for their unconditional love and support, as well as my friends, specially Rita Sousa, who were responsible for all that I am to this day. This master was an amazing period of my life, but only because my family and friends made it possible.
III
Abstract
Firm financing decisions have been a constant object of study in the world of corporate finance in the last decades. In this paper we examine the determinants of capital structure previously studied by several authors, including either firm characteristics and institutional environment variables. We estimate our models using panel data and OLS (Ordinary Least Squares) estimator, fixed effects (cross-section and period) and industry effects. Our sample includes 1743 non-financial firms from seven different countries over the period of 2005 to 2016. We use three different dependent variables, for different debt maturities, namely, short-term leverage, long-term leverage and total leverage.
We analyse our results in the framework provided by the major capital structure theories, namely, the trade-off theory, the agency theory, the pecking order theory and the market timing theory. In our work, we find evidence of higher relevance of the pecking order theory, obtaining results for profitability and firm growth consistent with this theory expected outcome. Other important conclusion of this research, is the negative association between creditor legal protection and firm leverage, suggesting that stronger creditor protection contributes to lower levels of leverage.
Keywords: Capital structure, trade-off theory, agency theory, pecking order theory, market timing theory, institutional environment
IV
Resumo
As decisões de financiamento das empresas têm sido constante objecto de estudo no mundo das finanças empresariais, nas últimas décadas. Neste artigo, examinamos certos determinantes da estrutura financeira das empresas previamente estudadas por diversos autores, incluindo características das empresas e variáveis do ambiente institucional em que as empresas se encontram inseridas. Os nossos modelos são estimados utilizando dados em painel, o estimador OLS (Ordinary Least Squares), efeitos fixos e efeitos sectoriais. A nossa amostra inclui 1743 empresas não financeiras de sete países diferentes ao longo do período de 2005 a 2016. Usámos três variáveis dependentes diferentes, considerando diferentes maturidades de dívida, nomeadamente, short-term leverage, long-term leverage e total leverage.
Analisámos os nossos resultados no framework estabelecido pelas principais teorias da estrutura de capitais das empresas, ou seja, the trade-off theory, the agency theory, the pecking order theory e the market valuation theory. No nosso trabalho, encontrámos evidência de uma maior relevância da pecking order theory, obtendo resultados para profitability e firm growth consistentes com as previsões da mesma. Outra conclusão importante deste trabalho é a associação negativa encontrada entre creditor legal protection e firm leverage, sugerindo que uma maior protecção legal do credor contribui para níveis mais baixos de alavancagem
financeira.
Palavras-chave: Capital structure, trade-off theory, agency theory, pecking order theory, market timing theory, institutional environment
Códigos JEL: C33, G32
Index of Content
Biographical note ... I Acknowledgements ... II Abstract ... III Resumo ... IV 1. INTRODUCTION... 1 2. LITERATURE REVIEW ... 32.1. Theories of Capital Structure ... 3
2.2. Institutional Environment ... 7 3. RESEARCH METHODOLOGY ... 8 3.1. Hypotheses development ... 8 3.1.1. Firm-level Hypotheses ... 8 3.1.2. Country-level Hypothesis ... 12 3.2. Variables ... 15 3.2.1. Dependent Variables ... 15 3.2.2. Firm-level Variables ... 16 3.2.3. Country-level Variables ... 18 3.3. Sample ... 20 3.4. Methodology ... 21 4. EMPIRICAL RESULTS ... 23 4.1. Univariate Results ... 23 4.2. Multivariate analysis ... 29 5. CONCLUSION ... 34 REFERENCES ... 36
Index of tables
Table 1: Country firms ... 20
Table 2: Hausman Test ... 22
Table 3: Descriptive statistics for firm-level variables ... 23
Table 4: Descriptive statistics for country-level variables ... 26
Table 5: Pearson's correlations ... 27
1
1. INTRODUCTION
Firm financing decisions have been a constant object of study since the seminal work presented by Modigliani & Miller (1958), which has grown substantially in the last few decades.
Financing decisions are a major aspect of a company capital structure. It represents how a company can finance their investments through the combination of equity and debt. In their seminal work, Modigliani & Miller (1958) postulated that the financing decisions of a firm had no relevancy on its value, under a vast set of assumptions, namely, the absence of taxes and bankruptcy costs.
Following their work, many researchers challenged this theory, eliminating gradually Modigliani & Miller (1958) assumptions and presenting different theories. However, only a few of the theoretical perspectives have obtained many supporters, namely, the trade-off theory, the agency theory, the pecking order theory and most recent the market timing theory. During this period, most of the research focuses on the effects of firm-level variables, such as firm size or profitability, ignoring the fact that capital structure choices are also probable to be affected by a firm’s institutional environment.
In fact, to the best of our knowledge, only approximately 4 decades after the work of Modigliani & Miller, Rajan & Zingales (1995) mentioned the importance of studying the effects of a firm’s institutional environment in a firm’s financing decisions. Few years later, La Porta et al. (1998) consider the effects of a firm’s legal environment in its financing decisions.
In this paper, we analyse the determinants of capital structure of firms in the United Kingdom, Portugal, Greece, Spain, Finland, Sweden and Norway, for a period of twelve years, from 2005 to 2016. The United Kingdom is the only common law-based country of our sample, which tends to foment a market-oriented financial system, where firms have easier access to capital markets. The remaining countries are qualified as civil law origin, as classified in the work of La Porta et al. (1998).
Moreover, the capital structure research tends to focus on long-term leverage or total leverage, as for example, Frank & Goyal (2009), not considering how the determinants affect the short-term leverage. Facing this, in our work we present three measures for leverage, in order to perceive if there are debt maturity effects in place.
2 Therefore, our aim is to analyse the determinants of capital structure at a firm and country-level and frame the results obtained within the theoretical theories developed. For this, we develop a multivariate analysis using OLS (ordinary least squares) estimator using three equations, one for each of the specifications of leverage considered (short-term, long-term and total leverage). In our models, we use panel data and fixed effects, when considering only firm-level variables for easier comparison with other studies, and Panel Unbalanced Least Squares estimator when considering country-level variables, with and without industry dummies for capturing potential industry effects. The sample is composed of financial and market information collected on Thomson Datastream database, covering the periods from 2005 to 2016.
Our paper contributes to the existing literature on the capital structure of firms on an empirical level. First, we evaluate the effects of firm-level determinants of the capital structure together with institutional determinants, such as the legal system. Secondly, we compare the different results obtained for all the measures of leverage considered, which considering the different maturities, could expectably present different results. Finally, our paper contributes with a broad a recent sample period, ranging from 2005 to 2016.
The evidence obtained supports the theoretical predictions of the pecking order theory and the market valuation theory and that the firm’s institutional environment has significant impact on firm’s financing decisions, finding clear evidence that stronger creditor protection contributes to lower leverage ratios.
This paper is organised as follows. Section 2 is a brief review of literature and describes different capital structure theories; Section 3 describes the research methodology; including the hypothesis development, variables definition, the sample selection criteria and the methodology used, Section 4 presents the statistical analysis and empirical results and finally, in Section 5 it is made a summary of the conclusions of our work and suggestions for future research.
3
2. LITERATURE REVIEW
2.1. Theories of Capital Structure
The capital structure of firms has been a recurrent subject of study, inspired, in the last decades, by the theoretical developments present in the Modigliani and Miller (1958) seminal work. This subject addresses the problem of how the companies choose to finance their activities, trying to find an optimal capital structure between the use of debt and equity, which would represent the minimal cost of capital, as well as maximizing their market value. In their work, Modigliani and Miller (1958) were based on a set of key assumptions, namely: absence of taxes; absence of transaction costs; absence of bankruptcy costs; the borrowing costs for companies and investors are equivalent; cash flows are perpetual and constant; symmetry of market information, which translates to companies and investors having the same information.
In this context, these authors considered that a company’s value is not influenced by their capital structure choices, but rather by the overall performance of the firm and the income generated through its assets. As such, they concluded that a company’s capital structure does not affect its value or its weighted average cost of capital. In result, their theorem would be later known as “The Irrelevance Proposition Theorem”.
In 1963, the abovementioned authors included in their initial model, the effect of corporate taxes and the tax deduction of financial expenses associated with the use of debt, concluding that higher leverage increased the company’s value and decreased the weighted average cost of capital. This way, the company’s optimal capital structure is achieved with the minimum of equity, therefore maximizing the company’s market value.
Since this, several authors challenged this theory, progressively deleting the initial assumptions and presenting new theories with different theoretical perspectives on the subject at hand.
Consequently, many theories on the determinants of the company’s capital structure have been proposed, with only a selected few achieving many supporters, namely, the trade-off theory, the agency theory, the pecking order theory and the market timing theory.
The trade-off theory is a theoretical development of the theorem presented by Modigliani and Miller (1958), originated by disregarding some of the key assumptions presented by the referred authors, namely, the absence of taxes and bankruptcy costs.
4 According to this theory, the company’s capital structure is determined taking in consideration the costs and benefits associated with the use of debt and equity, maximizing its value when the marginal benefit of using debt equals its marginal cost.
Under the referred theory, emerged several contributions regarding the costs and benefits of using debt and the way they can influence the capital structure of firms.
At this respect, Kraus & Litzenberger (1973) introduced the tax-bankruptcy trade-off perspective, considering bankruptcy costs as a determinant of the capital structure, arguing that when companies increase their debt load, the risk of bankruptcy increases, resulting in a higher cost of financing its activities through debt, since the risk is now higher for the lender. These authors considered that firms balance the benefits related to debt tax shields and the bankruptcy penalties associated, maximizing their value when the marginal present value of future tax shields equals the marginal present value of future bankruptcy costs.
Following this, Titman (1984) considered the existence of indirect costs associated with bankruptcy, namely, the liquidation costs which the firms will impose on its customers in the future represented by lower prices on its products in the present. Bradley et al (1984) developed a model, which shows that the level of leverage is inversely related to the costs of financial distress, including both the bankruptcy costs and the agency costs of debt, and the use of non-debt tax shields.
In another approach, Jensen & Meckling (1976) further developed the study of Modigliani & Miller (1963) and introduced the agency costs trade-off perspective, which would be called the agency theory. These authors considered the impact of agency costs in achieving an optimal capital structure. The referred costs, which comprises monitoring and control costs with the firm’s managers and agents, and the opportunity cost associated with the impact of debt in future investment decisions, result from two potential conflicts, namely, conflicts between shareholders and managers, and conflicts between shareholders and bondholders.
Agency costs between shareholders and managers arise from the necessity of the shareholders to control the managers, to ensure that the latter seek to maximize the former’s wealth. To that end, the use of debt disciplines the managers, as they will avoid using free cash flow in inadequate investments, since it needs to be repaid. In this case, the increase of the use of debt decreases the agency costs arising between shareholders and managers (Jensen 1986).
5 On another note, agency costs between shareholders and managers result when a firm invests in projects with higher risk or negative net present value, resulting in the expropriation of wealth by the shareholders. In this case, high debt levels will aggravate the potential conflicts between shareholders and bondholders (Stulz, 1990).
Contrary to the assumptions present in the trade-off perspectives, which assumes the existence of a relationship between the debt and equity levels, emerged a new strand in the literature, identified as the pecking order theory. This theory, developed by Myers & Majluf (1984), based on the existence of adverse-selection costs of issuing securities, caused by information asymmetry, assumes that firms have a preference hierarchical order over the financing sources available. In fact, the referred theory establishes that the information asymmetry will cause additional costs when obtaining financing through external funds, as investors would require an incentive to invest, since they would have less knowledge about the firm than its managers did.
At this respect, the pecking order theory posits that internal funds, under the form of retained earnings, avoids the above adverse-selection problem resulting in the best financing choice. On contrary, issuing equity has serious adverse-selection, since it represents investing in riskier securities, as it is commonly accepted that equity securities are riskier than debt securities. Therefore, when choosing to finance their investments, firms will first use internal funds available, and if insufficient, then by debt and hybrid securities and lastly by equity.
Considering the above, in this theory there is no optimal capital structure, as companies do not have a debt ratio target (Shyam-Sunder & Myers, 1999). In this way, a firm’s leverage ratio is the effect of hierarchical financing over time.
The pecking order theory is usually associated with adverse-selection costs derived from information asymmetry, however the adverse-selection problem and the subsequent preference hierarchy of financing can result from other considerations, such management optimism (Heaton, 2002) or tax and agency consideration (Frank and Goyal, 2008).
6 Recently, the market timing theory, rooted on the capital markets approach, has seen a surge in popularity. This theory, articulated by Baker & Wurgler (2002), is founded on the assumption that managers aim to time the opportune moment to issue new securities. According to this idea, firms aim to issue new shares when their market value is overvalued compared to the accounting value and repurchase shares when their market valuation is undervalued. In result, these authors argue that a firm’s capital structure is the aggregated effect of practicing market timing over time.
Consequently, this theory supports that the decisive factor in a firm’s capital structure strategy is the choice of the optimal moment to issue new shares. This practice is noted in several works, such as Rajan and Zingales (1995) when found empirical evidence of a significant correlation between leverage and market-to-book ratio.
7 2.2. Institutional Environment
The studies of firm capital structure decisions usually focus on the importance of firm-level characteristics, examining corporate financing decisions within individual countries, overlooking the fact that these decisions are probably influenced by a firm’s institutional environment or a country’s infrastructure.
This, among other reasons, lead to a growing literature focusing on the interaction between firm characteristics and the institutional environment, such as the legal system, shareholder and creditor rights, banking development or financial development. In this respect, and to the best of our knowledge, Rajan and Zingales (1995), were the first to mention the importance of studying country-level determinants regarding a firm’s financing decisions.
Subsequently, other authors researched this subject, such as, Booth et al. (2001) examined firm’s capital structure choices in ten developing countries, finding that determinants of capital structure do not differ between developed and developing countries, La Porta et al. (1998) discovered that the legal environment and framework represents an important factor in the development of the capital markets, because of its impacts on shareholder’s and creditor’s rights, which in turn affect the firm’s choices of capital structure, or, more recently, Fan et al. (2011) considered the impact of some institutional characteristics, namely, corruption, taxes, inflation and legal and political institutions on firm’s capital structure choices, finding that public governance and the legal system affect firm capital structure and that weaker laws and increased government corruption are associated with higher leverage ratios..
8 3. RESEARCH METHODOLOGY
3.1. Hypotheses development
3.1.1. Firm-level Hypotheses
Firm Size
Most capital structure theories argue that firm size influences its capital structure choice. Notwithstanding, the literature is not clear about the relationship between firm size and leverage, presenting evidence supporting the existence of a positive relationship (Shenoy & Koch, 1996 and Oztekin, 2015), as well as of a negative relationship (Titman & Wessels, 1988).
According to the trade-off theory and the agency theory, there should exist a positive relationship between firm size and the leverage ratio. In fact, the trade-off theory proposes that larger firms tend to be more diversified and as such are less probable of going bankrupt (Rajan & Zingales, 1995 and Frank & Goyal, 2009). Also, bankruptcy costs are, in general, more fixed, resulting in larger firms having, in principle, lower bankruptcy costs than smaller firms (Warner, 1977 and Marsh, 1982). Additionally, according to the agency theory, financial institutions, usually, have less information regarding smaller firms, resulting in larger firms facing lower debt related agency costs (Hall et al., 2004).
Framed in the pecking order theory, Harris & Raviv (1991) consider a positive relationship between firm size and the leverage ratio, because larger firms tend to provide more information for the markets and in result obtain more easily new funding from investors.
On the other hand, the costs of issuing equity securities and long-term debt, usually referred as transaction costs, tend to be higher for small firms. Thus, small firms will use significantly more debt, namely short-term debt, than large firms (Titman & Wessels, 1988). Taking all the above in consideration, we will test the following hypothesis in this work:
9 Profitability
According to the existent literature, the effect of profitability on the leverage ratios is more ambiguous. The pecking order theory suggests that firms prefer to raise funds, first from internal funds, second from debt, and third from issuing new equity securities. Hence, more profitable firms tend to have more earnings available to be retained, which indicates a negative relationship between profitability and leverage (Hall et al., 2004). Rajan & Zingales (1995) found evidence of a negative relationship between profitability and leverage, arguing that companies with higher profits tend to use the internal resources generated to finance their new investments.
In contrast, the trade-off theory suggests that profitable firms face lower costs of financial distress, as well as considering the debt tax shields more valuable, which predicts higher leverage ratios for profitable firms (Frank & Goyal, 2009). Moreover, the agency costs theory argues that profitable firms benefit more from the disciplinary role of debt (Jensen, 1986), predicting a positive relationship between profitability and use of debt.
In our work, based on the findings of several authors and the arguments present in the pecking order theory, we will test the following hypothesis:
H2: Profitability has a negative impact on leverage ratio. Tangibility
A vast majority of the research point to the existence of correlation between the type of assets owned by a firm and the use of debt. Tangible assets, such as property, plant and equipment, can easily take the role of collateral when issuing debt, lowering the risk of the lender, and thus may have lower costs of debt (Shenoy & Koch, 1996). Additionally, is easier for outsiders to evaluate tangible assets than intangibles, diminishing the expected distress costs (Frank & Goyal, 2009), as such the consequent lower debt related agency costs and the smaller costs of financial distress suggest a positive relationship between tangibility and debt. On another perspective, for the pecking order theory, Gaud et al. (2005) found the existence of a positive relationship between tangible assets and leverage, because there is less problems of information asymmetry and reduce the risk of credit.
In this way, we will test the following hypothesis: H3: Tangibility has a positive impact on leverage ratio.
10 Growth
Concerning the effects of growth on leverage, this is again a contentious issue, between the theoretical predictions from the trade-off theory and the pecking order theory. The trade-off theory predicts that firms with higher growth opportunities should face increased costs of financial distress (Frank & Goyal, 2009). Additionally, firms with more growth opportunities cannot access external financing as easily than firms with more assets in place, therefore these firms should have lower leverage ratios (Myers (1977)). In result, under the trade-off theory is expected the existence of a negative relationship between growth and the use of debt.
Opposing this, the pecking order theory and the agency theory predict a positive relationship between growth and leverage, the former because firms with higher growth opportunities have a bigger tendency to exhaust internal funds and thus use more debt (Michaelas et al, 1999) and the latter because in order to minimize agency costs between shareholders and managers originated by the firm’s growth, they use debt to discipline the managers.
Therefore, and based on the exposed theoretical arguments, we will test the following hypothesis:
H4: Growth has a positive impact on leverage ratio. Non-debt Tax Shields
As previously mentioned, the trade-off theory predicts that a firm’s optimum debt level is when the marginal benefit of debt equals its marginal cost, thus resulting in a trade-off between the tax advantages of debt and the increasing costs of financial distress.
However, DeAngelo & Masulis (1980) presented a model of optimal capital structure, which incorporated the impact of non-debt related tax shields. These authors argued that non-debt related tax shields, such as accounting depreciation deductions and investment tax credits, are substitutes for the tax benefits derived from debt. Consequently, firms with larger non-debt related tax shields should choose to raise less funds through debt, therefore is expected that non-debt related tax shields to be negatively related to leverage.
11 In fact, in their work, Bradley et al. (1984) and Cortez & Susanto (2012) found empirical evidence of the negative relationship between non-debt tax shields and leverage on firms classified according to a two-digit SIC code and non-financial firms in Japan, respectively.
In this way, we will test the following hypothesis:
H5: Non-debt tax shields have a negative impact on leverage ratio. Market Valuation
The market timing theory articulated by Baker & Wurgler (2002) proposes that firms tend to finance their activities through new issues of equity when the firm’s market value is high and are more prone to raise funds through debt when the firm’s market value is low.
In their work, Baker & Wurgler (2002) suggested the indicator market-to-book ratio as a proxy for the analysis of the relationship between firm’s market timing practice and the use of debt to finance its activities.
Rajan & Zingales (1995) used the market-to-book ratio as a proxy for growth opportunities, finding evidence of a negative relationship between the market-to-book ratio and the leverage ratio, arguing that firms will issue new shares of equity to finance their activities, when the firm’s market value is high (overvalued) and hence diminishing the level of leverage.
Therefore, based on the theoretical predictions of the market timing theory and the empirical evidence found, we will test the following hypothesis:
12 3.1.2. Country-level Hypothesis
Legal System
The similarities between the legal systems of different countries allow, according to most comparative legal scholars, to classify national legal systems as belonging to one of the major families of law. According to the criteria used for defining legal families, which is, usually, a point of discord between the scholars, there is a consensus that there are two major legal systems: common law and civil law.
Common law-based legal system is based on the Stare decisis principle – the principle that similar cases should be decided according to similar principled rules, so it achieves similar results. As such, the common law-based legal system is formed by the precedents from past judicial decisions. Historically, this legal system originated in England, and through the British Empire, it has spread to the former British colonies.
The origins of civil law-based legal systems are attributed to the ancient Roman law, which was based on statutes and comprehensive codes, elaborated by legal scholars. Several centuries later, under Napoleon was written the French Commercial Code, which was later distributed around the world. There is a consensus, that emerged three different legal regimes from civil law, namely the French, the German and the Scandinavian.
However, La Porta et al. (1998) concluded that countries with common law origin tend to have a stronger investor protection rules than civil law origin countries and therefore higher valuations of securities. As such, many studies tend to only classify the countries as common law-based or civil law-based and do not proceed to a greater desegregation (see for example Gao & Zhu., 2015).
Gao & Zhu (2015) found evidence that information asymmetry tends to be lower if firms are situated in common law-based countries and that the positive relationship between information asymmetry and market leverage is more accentuated for firms in countries with strong banking systems. Demirgüç-Kunt & Levine (1999) concluded that countries with common law origin provide greater incentives for market-based financial systems, which are positively related to the creation of wealth.
In this way, we will test the following hypothesis:
13 Shareholder Rights
The rights associated to some form of securities, which can be either equity securities or debt securities, represents an important determinant of a firm capital structure. These rights are not an intrinsic characteristic of the securities per se, but rather the result of the legal rules adopted by the jurisdictions in which the securities are issued.
As such, the existence of differences in the shareholder rights attributed by different countries may help explain why firms located in one country prefer to raise funds through debt and other firms in other country prefer to finance their activities issuing new shares of equity (La Porta et al., 1998).
In fact, Jiraporn & Gleason (2007) argued that firms located in countries with restricted shareholder rights are more likely to incur in higher agency costs, derived from the fact that weak shareholder rights are much easier exploited by the managers. These authors found evidence that weaker shareholders rights are associated with firms obtaining more debt to finance their activities.
Pereira Alves & Ferreira (2011) also concluded that the institutional environment, specially, the shareholder’s rights, are an important determinant of a firm’s capital structure.
Consequently, in our work we will test the following hypothesis:
H8: Stronger shareholder rights have a negative impact on the leverage ratio. Creditor Rights
As previously mentioned, recent literature defends that investor protection greatly influences the firm’s choices of financing sources, greatly shaping their leverage levels. Notwithstanding, and as presented by Cho et al. (2014), prior studies tended to focus on the importance of the protection provided to shareholders and its impacts in corporate decisions across the world (see for example Demirgüç-Kunt & Maksimovic, 1998) and in result the literature about the importance of creditor rights is in its early stages.
14 At this respect, is important to mention that creditor rights are far more complex than shareholder rights, and the literature tend to diverge focusing either on the supply-side forces or the demand-side in the debtor-creditor relationship. The theories regarding the supply-side forces in the debtor-creditor relationship defends that a stronger protection of the creditor rights will be positively associated with the use of debt, as the creditors will more easily concede credit. Gungoraydinoglu & Öztekin (2011) suggest that creditor protection has a positive impact on leverage. Houston et al. (2010) found evidence that strong creditor protection is associated with greater risk-taking by financial institutions.
Regarding the demand-side forces in the debtor-creditor relationship, Cho et al. (2014) suggest that a stronger creditor protection can lead to a precarious relation between managers and shareholders with the creditors, discouraging firms to finance their activities using debt. Vig (2013) shows an association between the reduction in the leverage ratios of firms in India and the increase of creditor protection, resulting from financial reforms.
Therefore, and based on the theoretical and empirical evidence presented by Cho et al. (2014), we will test the following hypothesis:
15 3.2. Variables
3.2.1. Dependent Variables
To analyse the effects of the determinants in a firm’s capital structure, we will use as the dependent variable the level of leverage of the firm. However, in the literature, there have been used many alternatives of leverage, with most of them considering some sort of a debt ratio (Frank & Goyal, 2009).
The referred debt ratios may differ, whether we considered book values or market values, or can also differ when debt maturity differentiation is considered. According to several theories, the consideration of different type of debt ratios, may result in different observed impacts (Titman & Wessels, 1988).
In our work, we will use measure debt in according to book value rather than market value, because firms tend to be more concerned with book leverage ratios than market leverage ratios, as debt covenants are usually established in function of book values, see for example Harvey et al. (2004).
Regarding the debt maturity, many authors only tend to consider long-term debt or total debt, such as Frank & Goyal (2009), not considering short-term debt as a measure of leverage. Cho et al. (2014) argued that firms tend to use short-term debt to finance current assets or cover some temporary shortness of liquidity, being less sensitive to determinants that affect a firm’s capital structure. On contrary, Kahl et al. (2015) suggested that some firms use short-term debt as a transactional instrument for long-term debt. The use of different types of ratios allow to analyse the implications of the debt maturity on a firm’s capital structure.
In this regard, we will take in consideration three dependent variables, namely the short-term leverage ratio (ST_LEV), the long-term leverage ratio (LT_LEV) and the total leverage ratio (T_LEV).
ST_LEVi,t = Short-term Debti,t / Total Assetsi,t, of the company i in year t
LT_LEVi,t = Long-term Debti,t / Total Assetsi,t, of the company i in year t
16 3.2.2. Firm-level Variables
Firm Size
Many authors have used different indicators to represent firm size, such as the natural logarithm of net sales (Titman and Wessels, 1988 and Daskalakis et al., 2016) “the behaviour of SME”) or the natural logarithm of total assets (Oztekin, 2015).
In our work, considering the very high correlation between these two indicators, see Titman and Wessels (1988), we measure firm size (SIZE) as the natural logarithm of total assets.
SIZEi,t = Ln(Total Assetsi,t), of the company i in year t
Profitability
Several authors through the years have measured profitability (PROF) as earnings before interests, taxes, depreciation and amortization (EBITDA) over total assets, such as, Rajan & Zingales (1995) and Pereira Alves & Ferreira (2011).
Taking the above in consideration, we will measure profitability through the same ratio.
PROFi,t = EBITDAi,t / Total Assetsi,t, of the company i in year t
Tangibility
There are several authors that argue that inventories should be also considered when measuring the tangibility of assets, since in many situations they can represent a significant part of the firm’s value at the time of liquidation (Gaud et al, 2005).
However, like some recent authors, namely Cho et al (2014), for the purpose of our work, tangibility (TANG) is measured as net property, plant and equipment (PPE) over total assets.
17 Growth
In the recent years, several indicators have been considered adequate for measuring the effect of growth in a firm’s capital structure, such as the annual growth in total assets, capital expenditures over total assets or, considering that, usually, firms engage in research and development to generate new investments, as research and development expenses over sales (Titman & Wessels, 1988).
For the present work, we will measure growth (GRA) as the annual growth of total assets.
GRAi,t = Ln(Total Assetsi,t) – Ln(Total Assetsi,t-1), of the company i in year t
Non-debt Tax Shields
For the present study, we use the interpretation of Titman & Wessels (1988) and Cortez & Susanto (2012), measuring non-debt tax shields (NDTS) as the ratio between depreciation and amortization over total assets.
NDTSi,t = Depreciation & amortizationi,t / Total Assetsi,t, of the company i in year t
Market Valuation
In order to measure the practice of market-timing by the firm’s managers, Baker & Wurgler (2002) proposed the market-to-book ratio as a proxy for the analysis of the relationship between the capital structure of the firms and the market timing practice. Their findings supported that this indicator was adequate for testing the market timing theory.
In result, we will use the variable (MB) in our work to test the market timing theory. MBi,t = Market value of Assetsi,t / Book value of Assetsi,t, of the company i in year t
Where,
Market value of Assets = Total Assets – Common equity + Market Capitalization Book value of Assets = Total Assets
18 3.2.3. Country-level Variables
Legal System
For this work, we classified the firm’s countries in our sample into legal families based on the classification of La Porta et al. (1998), which is vastly assumed as uncontroversial, specifically, the classification of the countries present in our sample.
In this regard, we use a legal origin dummy variable (LAW), which takes the value of 0 for common law-based countries and 1 for civil law-based countries.
LAWi,t = Dummy variable (0 common and 1 civil), of the company i in year t
Shareholder Rights
La Porta et al. (1998) defined an index of shareholder rights, usually referred as antidirector rights, in order to measure how strongly the legal framework favours and protects minority shareholders against dominant shareholders and the company’s administration, which is comprised by the following rights:
• the country allows shareholders to mail in proxy votes;
• shareholders are not required to deposit their shares prior to a general shareholder meeting;
• cumulative voting or proportional representation of minorities on the board of directors is allowed;
• an underrepresented minorities mechanism is in place;
• shareholders have pre-emptive rights that can only be waived by a shareholder vote;
• shares of 10% or less entitle a shareholder to call for an extraordinary shareholders’ meeting;
Each of the aforementioned antidirector rights are measured as 1 if the country protects the minority shareholders according to this measure or 0 if not. In result, the present index ranges from 0 to 6, 6 representing the strongest legal system that favours and protects minority shareholders.
In our work, and as other authors such as Pereira Alves & Ferreira (2011), we will use the variable (SR) as the index of shareholder rights defined La Porta et al. (1998).
19 Creditor Rights
Similar to our approach regarding the shareholder rights, in our analysis we also consider an index of creditor rights defined by La Porta et al (1998).
The referred index takes into consideration the two strategies to deal with a firm in default, adding up the scores of the rights attributed to each strategy, partly due to almost all countries relying on both strategies.
The creditor rights index, as defined by La Porta et al. (1998), is formed by controlling if a country imposes certain legal restrictions to firms, namely:
• creditor consent or minimum dividends, to file for reorganisation;
• secured creditors are able to gain possession of their security once a reorganisation petition has been approved (no automatic stay);
• secured creditors are ranked first in the distribution of the proceeds resulting from the disposition of the assets of a bankrupt firm;
• and the debtor does not maintain administration of his property pending the resolution creditor rights reorganisation.
The present index ranges 0 to 4, 4 representing the strongest legal system that favours and protects creditors.
The present study, our variable (CR) is measured by the creditor rights index defined by La Porta et al. (1998).
20 3.3. Sample
The sample used in our work was constructed with data available on Thomson Datastream database. The initial sample contained data of 2679 firms from the United Kingdom, Finland, Greece, Norway, Portugal, Spain and Sweden, with financial and market information, during the period 2005-2016.
From the initial sample, we have excluded financial firms, such as banks and insurance companies, because this type of firms is usually subject to specific regulations that influence their leverage. Therefore, we removed all the firms included in the following sectors: banks, equity investment instruments, financial services, life insurance, nonequity investment instruments, nonlife insurance and real estate investment trusts. We also excluded firms that do not have complete information for at least seven periods.
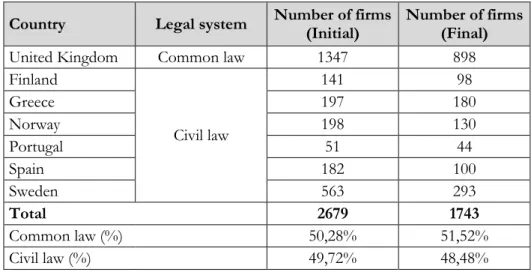
After this, our sample included 1743 firms, with 898 firms from United Kingdom, and 845 firms from the other remaining countries. In our sample there are one common law-based country (United Kingdom) and six civil law-law-based countries (Portugal, Greece, Spain, Finland, Sweden and Norway), however, as demonstrated, the number of firms avoid any bias, since both legal systems are almost equally represented. Table 1 summarizes the sample of the firms considered.
Additionally, to try to reduce the impact of possible outliers, we trimmed all the variables presented in our equations at the respective 5th and 95th percentiles of own variable distribution.
Table 1: Country firms
Country Legal system Number of firms (Initial) Number of firms (Final)
United Kingdom Common law 1347 898
Finland Civil law 141 98 Greece 197 180 Norway 198 130 Portugal 51 44 Spain 182 100 Sweden 563 293 Total 2679 1743 Common law (%) 50,28% 51,52% Civil law (%) 49,72% 48,48%
21 3.4. Methodology
The main objective of our work is to analyse the determinants of capital structure of listed companies in the considered sample of countries, including both firm-level and country-level determinants.
For this effect, we organized our data in a panel data with two dimensions, being the panel variable, the firms present in our sample and the time variable, the years in analysis. We obtained an unbalanced panel data, since some data is missing for at least one entity in one period.
As such, we estimated, using the Ordinary Least Squares (OLS) estimator, the following panel data regressions:
𝑆𝑇_𝐿𝐸𝑉 𝑖,𝑡 = 𝛽0+ 𝛽1𝑆𝐼𝑍𝐸𝑖,𝑡+ 𝛽2𝑃𝑅𝑂𝐹𝑖,𝑡 + 𝛽3𝑇𝐴𝑁𝐺𝑖,𝑡+ 𝛽4𝐺𝑅𝐴𝑖,𝑡+ 𝛽5𝑁𝐷𝑇𝑆𝑖,𝑡 + 𝛽6𝑀𝐵𝑖,𝑡+ 𝛽7𝐿𝐴𝑊𝑖,𝑡+ 𝛽8𝑆𝑅𝑖,𝑡+ 𝛽9𝐶𝑅𝑖,𝑡 + 𝜀𝑖,𝑡 (1) 𝐿𝑇_𝐿𝐸𝑉 𝑖,𝑡 = 𝛽0+ 𝛽1𝑆𝐼𝑍𝐸𝑖,𝑡+ 𝛽2𝑃𝑅𝑂𝐹𝑖,𝑡+ 𝛽3𝑇𝐴𝑁𝐺𝑖,𝑡+ 𝛽4𝐺𝑅𝐴𝑖,𝑡+ 𝛽5𝑁𝐷𝑇𝑆𝑖,𝑡 + 𝛽6𝑀𝐵𝑖,𝑡+ 𝛽7𝐿𝐴𝑊𝑖,𝑡+ 𝛽8𝑆𝑅𝑖,𝑡+ 𝛽9𝐶𝑅𝑖,𝑡 + 𝜀𝑖,𝑡 (2) 𝑇_𝐿𝐸𝑉 𝑖,𝑡 = 𝛽0+ 𝛽1𝑆𝐼𝑍𝐸𝑖,𝑡+ 𝛽2𝑃𝑅𝑂𝐹𝑖,𝑡+ 𝛽3𝑇𝐴𝑁𝐺𝑖,𝑡+ 𝛽4𝐺𝑅𝐴𝑖,𝑡 + 𝛽5𝑁𝐷𝑇𝑆𝑖,𝑡 + 𝛽6𝑀𝐵𝑖,𝑡+ 𝛽7𝐿𝐴𝑊𝑖,𝑡+ 𝛽8𝑆𝑅𝑖,𝑡+ 𝛽9𝐶𝑅𝑖,𝑡 + 𝜀𝑖,𝑡 (3) Where “i” represents the individual firms and “t” the year.
All the variables considered in the above regressions were previously identified in section 3.2., except for the variable εi,t, which represents the error term of the model, also
designated as disturbance term.
However, since the majority of the literature tends to concentrate their focus on the firm-level variables and for an easier comparison of the results at firm-level, first we estimated the aforementioned regressions excluding the country-level variables.
Since we are working with panel data and had not decided between using fixed or random effects in cross-section and in period effects, we performed the Hausman test (1978) for the three regressions, excluding the country-level variables, to choose between the type of effects, fixed or random.
The Hausman test allow us to verify that there are not unobservable individual effects correlated with the independent variables. If we reject the null hypothesis, then is probable that there unobservable individual effects correlated with the independent variables, which means that the fixed effects model is more appropriate.
22 Table 2: Hausman Test
Dependent Variable Random effects
T_LEV 69,144***
ST_LEV 104,368***
LT_LEV 34,769***
*, ** and *** denotes coefficients significance at 10%, 5% and 1%, respectively.
Considering the results exposed in Table 2, we rejected the null hypothesis at a significant level of 1% and therefore, the best model to use is the fixed effects model.
After analysing the regression with only firm-level variables, we introduced the country-level variables, which consists of a dummy variable and two index values that do not vary between firms of a same country and between years. This leads to the impossibility of estimating the considered regressions using the fixed effects model, as there is a problem of multicollinearity between the fixed effects and the country-level variables.
Facing this problem, we proceed to estimate the considered regressions using Panel Unbalanced Least Squares, since this allow us to bypass the multicollinearity problem presented by the fixed effects model and considering random effects does not guarantee better results.
Finally, and to perform a more robust analysis, we proceed to estimate our models considering industry effects, like the work of Nenova et al. (2000), in order to verify if the industry sector in which the firms are inserted has some impact on the determinants of capital structure.
23
4. EMPIRICAL RESULTS
4.1. Univariate Results
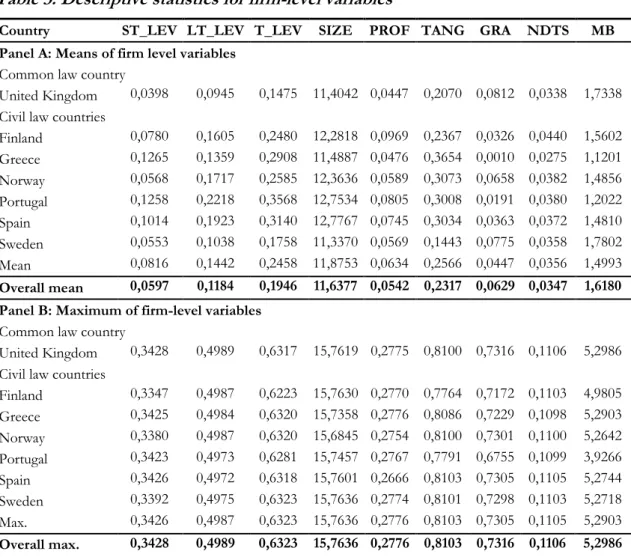
Table 3 presented below provides some descriptive statistics about the firm-level variables under analyse, which allows us to study some of the main characteristics of our sample. As such, Table 3 contains details about the mean, maximum value, minimum value, standard deviation and number of observations for each firm-level variable, including our dependent and some of the independent variables, and for each of the 7 countries of our sample (United Kingdom, Finland, Greece, Norway, Portugal, Spain and Sweden. Then, Table 4 will provide some summary statistics about our country-level variables that will allow us to obtain a general picture of our sample. Finally, Table 5 presents Pearson’s correlations coefficients between the dependent and independent variables.
Table 3: Descriptive statistics for firm-level variables
Country ST_LEV LT_LEV T_LEV SIZE PROF TANG GRA NDTS MB
Panel A: Means of firm level variables
Common law country
United Kingdom 0,0398 0,0945 0,1475 11,4042 0,0447 0,2070 0,0812 0,0338 1,7338 Civil law countries
Finland 0,0780 0,1605 0,2480 12,2818 0,0969 0,2367 0,0326 0,0440 1,5602 Greece 0,1265 0,1359 0,2908 11,4887 0,0476 0,3654 0,0010 0,0275 1,1201 Norway 0,0568 0,1717 0,2585 12,3636 0,0589 0,3073 0,0658 0,0382 1,4856 Portugal 0,1258 0,2218 0,3568 12,7534 0,0805 0,3008 0,0191 0,0380 1,2022 Spain 0,1014 0,1923 0,3140 12,7767 0,0745 0,3034 0,0363 0,0372 1,4810 Sweden 0,0553 0,1038 0,1758 11,3370 0,0569 0,1443 0,0775 0,0358 1,7802 Mean 0,0816 0,1442 0,2458 11,8753 0,0634 0,2566 0,0447 0,0356 1,4993 Overall mean 0,0597 0,1184 0,1946 11,6377 0,0542 0,2317 0,0629 0,0347 1,6180
Panel B: Maximum of firm-level variables
Common law country
United Kingdom 0,3428 0,4989 0,6317 15,7619 0,2775 0,8100 0,7316 0,1106 5,2986 Civil law countries
Finland 0,3347 0,4987 0,6223 15,7630 0,2770 0,7764 0,7172 0,1103 4,9805 Greece 0,3425 0,4984 0,6320 15,7358 0,2776 0,8086 0,7229 0,1098 5,2903 Norway 0,3380 0,4987 0,6320 15,6845 0,2754 0,8100 0,7301 0,1100 5,2642 Portugal 0,3423 0,4973 0,6281 15,7457 0,2767 0,7791 0,6755 0,1099 3,9266 Spain 0,3426 0,4972 0,6318 15,7601 0,2666 0,8103 0,7305 0,1105 5,2744 Sweden 0,3392 0,4975 0,6323 15,7636 0,2774 0,8101 0,7298 0,1103 5,2718 Max. 0,3426 0,4987 0,6323 15,7636 0,2776 0,8103 0,7305 0,1105 5,2903 Overall max. 0,3428 0,4989 0,6323 15,7636 0,2776 0,8103 0,7316 0,1106 5,2986
24
Table 3 (Continued)
Country ST_LEV LT_LEV T_LEV SIZE PROF TANG GRA NDTS MB
Panel C: Minimum of firm level variables
Common law county
United Kingdom 0,0000 0,0000 0,0000 7,8372 -0,4780 0,0031 -0,4199 0,0004 0,6372 Civil law countries
Finland 0,0000 0,0000 0,0000 7,8372 -0,4416 0,0030 -0,3841 0,0004 0,6605 Greece 0,0000 0,0000 0,0000 7,8947 -0,4609 0,0033 -0,4092 0,0004 0,6379 Norway 0,0000 0,0000 0,0000 7,8470 -0,4647 0,0032 -0,4197 0,0004 0,6395 Portugal 0,0000 0,0000 0,0000 8,0631 -0,2528 0,0034 -0,3959 0,0007 0,6374 Spain 0,0000 0,0000 0,0000 7,9502 -0,4170 0,0035 -0,4053 0,0004 0,6416 Sweden 0,0000 0,0000 0,0000 7,8383 -0,4774 0,0031 -0,4198 0,0004 0,6426 Min. 0,0000 0,0000 0,0000 7,8372 -0,4774 0,0030 -0,4198 0,0004 0,6374 Overall Min. 0,0000 0,0000 0,0000 7,8372 -0,4780 0,0030 -0,4199 0,0004 0,6372
Panel D: Standard deviation of firm-level variables
Common law country
United Kingdom 0,0618 0,1244 0,1590 2,0040 0,1468 0,2093 0,2172 0,0241 0,9450 Civil law countries
Finland 0,0692 0,1206 0,1536 1,8784 0,0908 0,1906 0,1581 0,0238 0,7508 Greece 0,0931 0,1292 0,1725 1,4285 0,0823 0,2117 0,1407 0,0186 0,5087 Norway 0,0655 0,1583 0,1964 1,8324 0,1286 0,2609 0,2272 0,0245 0,8023 Portugal 0,0890 0,1371 0,1640 1,6988 0,0768 0,1985 0,1471 0,0235 0,4578 Spain 0,0807 0,1416 0,1694 1,7374 0,0900 0,2142 0,1698 0,0236 0,7292 Sweden 0,0702 0,1269 0,1706 2,0484 0,1428 0,1684 0,2107 0,0237 0,9336 Std. Dev. 0,0823 0,1386 0,1820 1,8986 0,1147 0,2212 0,1875 0,0233 0,8069 Overall Std. Dev. 0,0753 0,1338 0,1773 1,9666 0,1319 0,2168 0,2036 0,0237 0,8873
Panel E: Number of observations of firm-level variables
Common law country
United Kingdom 9701 9650 9776 9056 8604 8862 8134 8906 8619 Civil law countries
Finland 1093 1108 1113 1079 1072 1106 1000 1092 1090 Greece 1729 1975 1891 2064 2019 1982 1885 1984 1782 Norway 1355 1271 1325 1348 1247 1224 1146 1274 1233 Portugal 461 476 445 479 503 493 451 472 463 Spain 1059 1062 1031 969 1074 1107 988 1077 1049 Sweden 3098 3086 3194 2959 2903 2932 2740 2920 2786 Total 8795 8978 8999 8898 8818 8844 8210 8819 8403 Total overall 18496 18628 18775 17954 17422 17706 16344 17725 17022
ST_LEV is defined as short-term debt divided by total assets, LT_LEV is defined as long-term debt divided by total assets and T_LEV is defined as total debt divided by total assets, SIZE is defined as logarithm of total assets, PROF is defined as earnings before interest, taxes, depreciation and amortisation divided by total assets, TANG is defined as property, plant and equipment divided by total assets, GRA is defined as the annual rate of change in total assets, NDTS is defined as depreciation and amortization divided by total assets and MB is defined as the result of total assets minus book equity plus market capitalisation divided by total assets. Sample period is from 2005 to 2016, with GRA only taking values from 2006 to 2016. The legal system classification is from the work of La Porta et al. (1998).
25 As we can see in Table 3, the information about the mean, maximum value, minimum value, standard deviation and number of observations is presented in the Panels A, B, C, D and E, respectively.
Focusing on the Panel A, we can observe that the average of the variable total leverage is 19,46%, the average of the variable long-term leverage is 11,84% and the average of the variable short-term leverage is 5,97%, of total assets. For all the measures of leverage considered, United Kingdom presents the lowest average values of all countries, with leverage levels of 14,75%, 9,45% and 3,98%, respectively. Regarding the measure of T_Lev, which considers the total leverage, Portugal presents the highest average value with 35,68% of total assets. These univariate results seem to indicate that there are some country effects in place, which contribute to lower levels of leverage in the United Kingdom, a common law-based country, when compared to the other countries.
On average, the market valuation is approximately 162% of book value of the companies, with Sweden and the United Kingdom claiming the highest average values of approximately 178% and 173%, respectively. In the period under analysis, the firm’s assets grow approximately 6,3% on average. On average, the variables of profitability, tangibility and not-debt tax shields, represent approximately 5,42%, 23,17% and 3,47% of total assets, respectively.
The differences on maximum values and minimum values, presented in Panel B and Panel C, respectively, are not relevant. We want only to highlight that in Panel C, we can observe that in our sample period, there are firms presenting negative levels of profitability and asset’s growth rate.
Finally, in Panel E, we can verify that, for all firm-level independent variables considered, there are an identical number of observations for each variable between United Kingdom and the civil law-based countries present in our sample, registering only insignificant differences of less than 300 observations. Regarding our dependent variables, there are some larger differences in the number of observations, with United Kingdom having more, approximately, 900 observations than the civil law-based countries, but given our sample size, these differences are not relevant.
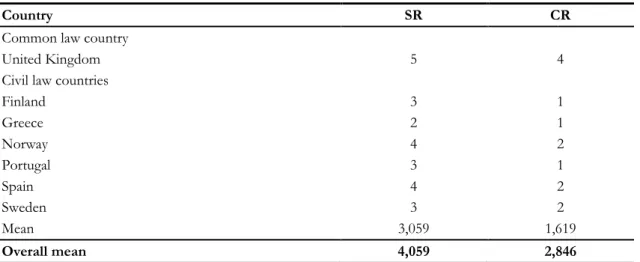
26 Table 4: Descriptive statistics for country-level variables
Country SR CR
Common law country
United Kingdom 5 4
Civil law countries
Finland 3 1 Greece 2 1 Norway 4 2 Portugal 3 1 Spain 4 2 Sweden 3 2 Mean 3,059 1,619 Overall mean 4,059 2,846
SR is from the index of shareholder rights defined by La Porta et al. (1998) and CR is from the index of creditor rights defined by La Porta et al. (1998). The legal system classification is from the work of La Porta et al. (1998).
Table 4 shows the values that each country-level variable takes for each country, as well as the overall mean of the full sample and of the sub-set of the Civil law countries. In this context, shareholder rights vary from the lowest value of 2 for Greece to the highest of 5 for United Kingdom and creditor rights vary between the low 1 for Finland, Greece and Portugal to a high of 4 for United Kingdom.
This distribution seems to evidence a significative relationship between the legal system origin of a country and the shareholder and creditor rights established by a country legal rules. In fact, as evidenced by La Porta et al. (1998), exists a significative relationship between the legal system origin and shareholder rights, with civil law countries presenting a lower index value for this variable. However, the same relationship is not found between creditor rights and the legal system origin, as with a larger sample of countries, La Porta et al. (1998) do not find clear evidence of that relationship.
Regarding our sample, is clear that the United Kingdom offers stronger legal protection for both shareholders and creditors than the civil law countries considered, with an index of shareholder and creditor rights of 5 and 4, respectively, in contrast to the average index of 3,059 and 1,619, respectively.
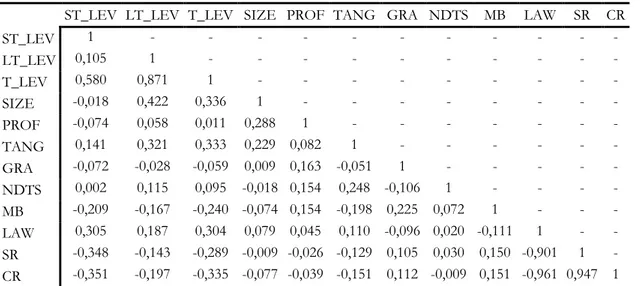
27 Table 5: Pearson's correlations
ST_LEV LT_LEV T_LEV SIZE PROF TANG GRA NDTS MB LAW SR CR
ST_LEV 1 - - - - LT_LEV 0,105 1 - - - - T_LEV 0,580 0,871 1 - - - - SIZE -0,018 0,422 0,336 1 - - - - PROF -0,074 0,058 0,011 0,288 1 - - - - TANG 0,141 0,321 0,333 0,229 0,082 1 - - - - GRA -0,072 -0,028 -0,059 0,009 0,163 -0,051 1 - - - - - NDTS 0,002 0,115 0,095 -0,018 0,154 0,248 -0,106 1 - - - - MB -0,209 -0,167 -0,240 -0,074 0,154 -0,198 0,225 0,072 1 - - - LAW 0,305 0,187 0,304 0,079 0,045 0,110 -0,096 0,020 -0,111 1 - - SR -0,348 -0,143 -0,289 -0,009 -0,026 -0,129 0,105 0,030 0,150 -0,901 1 - CR -0,351 -0,197 -0,335 -0,077 -0,039 -0,151 0,112 -0,009 0,151 -0,961 0,947 1 ST_LEV is defined as short-term debt divided by total assets, LT_LEV is defined as long-term debt divided by total assets and T_LEV is defined as total debt divided by total assets, SIZE is defined as logarithm of total assets, PROF is defined as earnings before interest, taxes, depreciation and amortisation divided by total assets, TANG is defined as property, plant and equipment divided by total assets, GRA is defined as the annual rate of change in total assets, NDTS is defined as depreciation and amortization divided by total assets and MB is defined as the result of total assets minus book equity plus market capitalisation divided by total assets, LAW is a dummy variable (0 common and 1 civil), SR is from the index of shareholder rights defined by La Porta et al. (1998) and CR is from the index of creditor rights defined by La Porta et al. (1998). Sample period is from 2005 to 2016, with GRA only taking values from 2006 to 2016. The legal system classification is from the work of La Porta et al. (1998).
Table 5 shows Pearson’s correlation coefficients between all dependent and independent variables. As we can see the correlations between the dependent variables and all the independent variables is very low, with the correlation between long-term leverage and firm size having the highest coefficient of 0,422. Concerning the correlations between the independent variables, in general, the correlations are not substantial, except for the correlation between the country-level variables, which gives support to the strong relationship between the legal system and the legal protection provided to investors.
The dependent variable ST_LEV, used in our sample, has a positive correlation with the independent variables TANG, NDTS and LAW and a negative correlation with the remaining variables.
28 Regarding the dependent variable LT_LEV, Table 4 shows a positive correlation between the referred variable and the variables SIZE, PROF. TANG, NDTS and LAW and a negative correlation with GRA, MB, SR and CR. We would like to highlight the inverse of the correlation of SIZE regarding ST_LEV and LT_LEV, which is consistent with the theory presented by Titman and Wessels (1988), that small firms will tend to use more short-term debt than larger firms, due to the high transaction costs.
Finally, the above table shows that the dependent variable T_LEV has a positive correlation with the variables SIZE, PROF, TANG, NDTS and LAW and a negative correlation with the variables GRA, MB, SR and CR.
29 4.2. Multivariate analysis
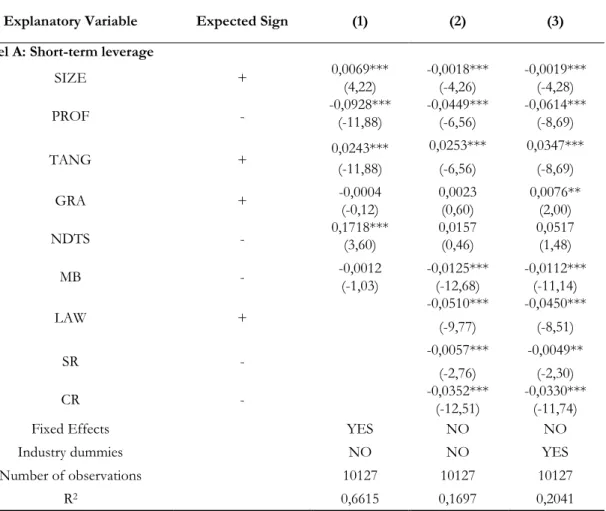
We present the main results of our model in Table 6. The results are reported in Panels A-C of Table 6 for equation 1-3, respectively, considering different measures of firm leverage, namely, short-term leverage, long-term leverage and total leverage. In column (1) of Panels A-C of Table 6 are presented the results that were estimated considering only firm-level variables with fixed effects (cross-section and period).
The results obtained from considering both firm and country-level variables are presented in column (2) of Panels A-C of Table 6, which were estimated using Panel Unbalanced Least Squares. Finally, column (3) of Panels A-C of Table 6 reports the results obtained from the estimation of equations 1-3 considering dummies for each of the industry groups in the sample, since in addition to the impact of firm and country characteristics, is important to note that firm leverage may be influenced by the industry group affiliation of the company (Nenova, 2000).
Table 6: Regression analysis of firm leverage
Explanatory Variable Expected Sign (1) (2) (3)
Panel A: Short-term leverage
SIZE + 0,0069*** (4,22) -0,0018*** (-4,26) -0,0019*** (-4,28) PROF - -0,0928*** (-11,88) -0,0449*** (-6,56) -0,0614*** (-8,69) TANG + 0,0243*** (-11,88) 0,0253*** (-6,56) 0,0347*** (-8,69) GRA + -0,0004 (-0,12) 0,0023 (0,60) 0,0076** (2,00) NDTS - 0,1718*** (3,60) 0,0157 (0,46) 0,0517 (1,48) MB - -0,0012 (-1,03) -0,0125*** (-12,68) -0,0112*** (-11,14) LAW + -0,0510*** (-9,77) -0,0450*** (-8,51) SR - -0,0057*** -0,0049** (-2,76) (-2,30) CR - -0,0352*** (-12,51) -0,0330*** (-11,74)
Fixed Effects YES NO NO
Industry dummies NO NO YES
Number of observations 10127 10127 10127
30
Table 6 (Continued)
Explanatory Variable Expected Sign (1) (2) (3)
Panel B: Long-term leverage
SIZE + 0,0353*** (15,05) 0,0255*** (39,13) 0,0246*** (36,97) PROF - -0,0829*** (-7,41) -0,0807*** (-7,63) -0,11*** (-10,19) TANG + 0,0713*** (5,87) 0,1078*** (18,20) 0,1233*** (18,17) GRA + 0,0184*** (3,73) 0,025*** (4,19) 0,0307*** (5,27) NDTS - 0,2659*** (3,83) 0,5135*** (9,76) 0,5367*** (9,98) MB - -0,0086*** (-5,17) -0,0132*** (-8,58) -0,0098*** (-6,35) LAW + 0,0145* (1,80) 0,0166** (2,06) SR - 0,0216*** 0,0164*** (6,80) (5,14) CR - -0,0248*** (-5,69) -0,0201*** (-4,67)
Fixed Effects YES NO NO
Industry dummies NO NO YES
Number of observations 10279 10279 10279
R2 0,7361 0,2543 0,3023
Panel C: Total leverage
SIZE + 0,037*** (14,58) 0,0238*** (28,65) 0,0228*** (27,06) PROF - -0,2224*** (-18,45) -0,1592*** (-11,75) -0,2214*** (-16,07) TANG + 0,1861*** 0,1666*** 0,1954*** (14,64) (22,34) (22,90) GRA + 0,0146*** (2,76) 0,0153** (2,01) 0,0279*** (3,77) NDTS - 0,3775*** (5,11) 0,467*** (6,94) 0,5243*** (7,68) MB - -0,0059*** (-3,26) -0,0264*** (-13,44) -0,0203*** (-10,33) LAW + -0,0452*** -0,0336*** (-4,38) (-3,28) SR - 0,0044 0,0026 (1,07) (0,62) CR - -0,0574*** (-10,28) -0,0506*** (-9,23)
Fixed Effects YES NO NO
Industry dummies NO NO YES
Number of observations 10307 10307 10307
31 ST_LEV is defined as short-term debt divided by total assets, LT_LEV is defined as long-term debt divided by total assets and T_LEV is defined as total debt divided by total assets, SIZE is defined as logarithm of total assets, PROF is defined as earnings before interest, taxes, depreciation and amortisation divided by total assets, TANG is defined as property, plant and equipment divided by total assets, GRA is defined as the annual rate of change in total assets, NDTS is defined as depreciation and amortization divided by total assets and MB is defined as the result of total assets minus book equity plus market capitalisation divided by total assets, LAW is a dummy variable (0 common and 1 civil), SR is from the index of shareholder rights defined by La Porta et al. (1998) and CR is from the index of creditor rights defined by La Porta et al. (1998). Sample period is from 2005 to 2016, with GRA only taking values from 2006 to 2016. The legal system classification is from the work of La Porta et al. (1998). Coefficient values are listed at the first row and t-statistics are in parentheses. *, ** and *** denotes coefficients significance at 10%, 5% and 1%, respectively.
The results obtained, by the different specifications of firm leverage, do not differ significantly between the Panels A-C of Table 6, with only some different results in some variables. For all the models represented in column (1), the R2 is higher than R2 for the
remaining models represented in columns (2) and (3). However, this difference is explained by the fact that column (1) uses the OLS estimator using fixed effects (cross-section and period). In fact, the R2 value present in column (2) and (3) are as expected and in line with
other works, for example Pereira Alves & Ferreira (2011) and Nenova (2000).
Focusing in Panel A, the coefficients of all the firm-level variables are statistically significant at 1% and 5% level, except for GRA in column (1) and (2), MB in column (1) and NDTS in column (2) and (3). Regarding the expected signs, only SIZE, when considering country-level variables, and NDTS present coefficients contrary to our expected sign.
The former result may be explained by the theory of Titman & Wessels (1998) in which they argue that the costs of issuing equity securities and long-term debt, usually referred as transaction costs, tend to be higher for small firms, therefore, small firms will use significantly more short-term debt than large firms. Regarding the latter, Bradley et al (1984) found the same result, claiming that amortization and depreciation expenses relate to investments in tangible assets, which contributes to the increase of leverage.
On the other hand, all the country-level variables present statistically significant results and have the expected signs, except for the dummy variable LAW. The fact that LAW has a negative and significant association with short-term leverage, seems to indicate that civil law-based countries impact the firm’s capital structure, giving incentive for firms to obtain long-term instead of short-term debt. As a matter of fact, given the positive association between this variable and long-term debt, presented in Panel B, the results indicate that firms in civil law-based countries favour the use of long-term debt over short-term debt.