Children indoor exposures to (ultra)fine particles in an urban area: comparison between school and home environments
Klara Slezakovaa,b, Cátia Texeiraa, Simone Moraisb, Maria do Carmo Pereiraa,* aLEPABE, Departamento de Engenharia Química, Faculdade de Engenharia, Universidade do Porto, R. Dr. Roberto Frias, 4200-465 Porto, Portugal
bREQUIMTE, Instituto Superior de Engenharia do Porto, Instituto Politécnico do Porto, R. Dr. António Bernardino de Almeida 431, 4200–072 Porto, Portugal
*Corresponding author
Maria do Carmo Pereira – phone: +351 22 508 1590; fax: +351 22 508 1449; e-mail: [email protected]
Klara Slezakova – phone: +351 22 041 4946; fax: +351 22 508 1449; e-mail: [email protected]
Cátia Texeira – phone: +351 22 508 1590; fax: +351 22 508 1449, e-mail: [email protected]
Simone Morais – phone: +351 228340500; fax: +35122-8321159; e-mail: [email protected]
This article was published in Journal of Toxicology and Environmental Health - Part A: Current Issues, 78(13), 886-896, 2015
Abstract 22
Due to their detrimental effects on human health, the scientific interest in ultrafine 23
particles (UFP) has been increasing but available information is far from 24
comprehensive. Children, who represent one of the most vulnerable groups of society, 25
spend the majority of their time in schools and homes. Thus, the aim of this workis to 26
assess indoor levels of particle number concentrations (PNC) in ultrafine and fine range 27
at school and home environments and to compare the indoor respective dose rates for 28
3–5 years old children. Indoor particle number concentrations in range of 20–1000 nm 29
were consecutively measured during 56 days at two preschools (S1 and S2) and three 30
homes (H1–H3) situated in Porto, Portugal; at both preschools different indoor 31
microenvironments (classrooms, canteens) were evaluated. The results showed that the 32
total mean indoor PNC (determined for all indoor microenvironments) were 33
significantly higher (p < 0.05) at S1 than at S2. At homes the indoor levels of PNC 34
(with means ranging between 1.09×10⁴ and 1.24×10⁴ particles cm–3) were 10–70% 35
lower than total indoor means of preschools (1.32×10⁴ to 1.84×10⁴ particles cm–3). 36
Nevertheless, estimated dose rates of particles were at homes 1.3–2.1 times higher than 37
those of preschools, mainly due to longer period spent at home. Furthermore, daily 38
activity patterns of 3–5 years old children significantly influenced overall dose rates of 39
particles. 40
41
Keywords: (Ultra)fine particles, children, indoor air, schools, residential environment, 42
exposure. 43
INTRODUCTION 45
During the last two decades, there has been considerable interest in the health 46
effects of exposure to airborne particulate matter (Brunekreef et al., 2009; Krewski et 47
al., 2003; Krewski & Rainham 2007; Samet & Krewski 2007). As the knowledge about 48
the size dependency of particle toxicity has grown (Kelly & Fussel, 2012), the ongoing 49
research has focused its attention on ultrafine particles (UFP) (Morawska et al., 2013). 50
UFP represent a fraction of particulate matter (PM) with particles of aerodynamic 51
diameter smaller than 0.1 µm (Morawska et al., 2013). Unlike coarse particles, UFP 52
contribute little to PM mass but they dominate number concentrations. Due to their 53
small size, high number concentrations, high surface area, and ability to penetrate into 54
the interstitial spaces of the lungs (Bakand et al., 2012; Pereira Gomes et al., 2012), 55
UFP can cause various adverse health effects. Clinical and epidemiological studies have 56
linked exposure to ambient UFP with adverse respiratory outcomes (impaired lung 57
function and pulmonary defense mechanisms, inflammatory responses and worsening 58
of respiratory diseases), and possibly with cardiovascular health effects (Bakand et al., 59
2012; Heal et al., 2012; Ibald-Mulli et al., 2002) though the evidence is not consistent 60
(Rückerl, et al., 2011). While more epidemiological studies on UFP fraction are needed, 61
exposure assessment issues for UFP (such as spatial variability, indoor sources, 62
infiltration of UPF from various outdoor emission sources, seasonal variability in 63
concentrations and composition) are being further addressed (Azarmi et al., 2014; Bekö 64
et al., 2013; Rivas et al., 2015; Viana et al., 2014, 2015; Wang et al., 2013). 65
In view of the evidences of negative health impacts of UFP, research has focused 66
on investigation of main sources and processes affecting the levels and size distributions 67
of these particles in ambient air of urban areas (Kumar et al., 2010; Morawska et al., 68
2008; Solomon, 2012). UFP can be formed by condensation of semi-volatile organic 69
aerosols, photochemically induced nucleation, and/or nucleation through gas-to particle 70
conversion (Morawska et al., 2008, 2013). Concerning the indoor air, UFP originate 71
from combustion processes which includes cooking (namely boiling, stewing, frying, 72
baking, grilling), smoking and use of candles (Bekö et al., 2013; Morawska et al., 2013), 73
and as result from occupant–related activities such as use of consumer products, use of 74
painting and cleaning products (Bhangar et al., 2011; Long et al., 2000). 75
Young children represent one of the most vulnerable group with regard to 76
potentially harmful effects induced by airborne particulate exposure (Schüepp & Sly, 77
2012). As their physiological and immunological systems are still developing, young 78
children receive a higher dose of airborne particles relative to lung size compared to 79
adults (Burtscher & Schüepp, 2012; Laiman et al., 2014; Mazaheri et al., 2014; 80
Morawska et al., 2013). Children spend a significant percentage of their time at schools 81
and at homes. Specifically in Portugal, young children spend at school approximately 82
30% of their time (8-9 h/day). Therefore, the knowledge and understanding of indoor 83
air pollution in these specific environments is important in order to child health. As a 84
pollutant of both indoors and ambient air, UFP have the potential to harm children's 85
health (Burtscher & Schüepp, 2012; Moreno et al. 2014; Reche et al., 2014; Rivas et al. 86
2014; Schüepp & Sly, 2012; Viana et al. 2014), yet the information concerning the 87
children exposure to UFP is limited. 88
The aim of this work is to assess the indoor exposure to particles in (ultra)fine 89
range (20-1000 nm) of 3–5 years old children, living in urban areas. The specific 90
objectives of this work are: (i) to measure the levels of indoor particle number 91
concentrations (PNC) in two preschools and three homes situated in urban low-92
moderately trafficked zones of Oporto Metropolitan Area (Portugal); and (ii) to 93
compare the dose rates of the indoor (ultra)fine particles at schools and home 94
environments. 95
96
MATERIALS AND METHODS 97
Characterization of sampling sites 98
Particle number concentrations in ultrafine (20-100 nm) and fine (> 100-1000 99
nm) ranges were consecutively measured at two preschools and three homes, all of them 100
situated in urban low-moderately trafficked zones of Oporto Metropolitan Area in 101
Paranhos district (north of Portugal). The sample collection was conducted for 56 days. 102
Both preschools (S1 and S2) and homes (H1–H3) were situated in an urban zone; 103
previously studies that evaluated ambient air pollution demonstrated that emissions 104
from vehicular traffic are the main pollution source in these areas (Slezakova et al., 105
2011, 2013). 106
In each preschools, PNC were simultaneously measured at different indoor 107
microenvironments (classrooms, canteens, and, if existent, gymnasium or playroom); 108
all microenvironments were assessed using the identical sampling methodology and 109
during the same amount of time. At homes sampling of (ultra)fine particles was 110
conducted in living rooms that were used also as dining rooms; all meals/snacks were 111
served there. 112
All indoor places were naturally ventilated through open windows. The 113
characteristic of the studied preschools and homes, the traffic density data, as well as 114
the duration of the sampling at each place are summarized in Table 1. 115
116
Sample collection 117
Particle number concentrations in size range 0.02–1 µm were measured by 118
condensation particle counters – TSI P-Trak™ (UPC 8525; TSI Inc., MN, USA). The 119
instrument operates on the principle of condensing 100% grade isopropyl alcohol 120
(Sigma-Aldrich, Steinheim, Germany) onto ultrafine particles in order to increase their 121
dimensions to a detectable size. At preschools, PNC were measured daily between 8:30 122
a.m. to 5:30 p.m. which corresponded to the period that children were at preschools, 123
whereas at homes PNC of (ultrafine) particles were measured continuously during 24 124
h. Intake flow of 0.7 L.min–1 was used and logging interval was 60 s accordingly to 125
previous studies (Diapouli et al., 2007; Norbäck et al., 2011; Zhang & Zhu, 2012). 126
Instruments were mounted onto supports so that air was sampled from a height of 0.8 127
to 1.1 m (in order to simulate children breathing zone). In each indoor environment, 128
particles counters were placed as far as possible from windows or doors, and from other 129
probable sources of particles (heating equipment, blackboards, printers, etc.) in order 130
to minimize direct influence of any source. All requirements to maintain child safety 131
were fulfilled. 132
At both preschools a researcher was present during sample collection in order to 133
keep a record of room occupancy, ventilation systems (door and window positions), 134
and potential source activities; information concerning child activities and schedules at 135
preschools were also registered by a researcher. At homes all information including 136
child activities were recorded by the parents/child responsible. In addition, teachers, 137
staff and parents were daily inquired regarding the occurrence of additional sources and 138
activities. Furthermore, detailed questionnaires were used daily for better description 139
of the studied indoor environments (both preschools, homes). The first questionnaire 140
was dedicated to registering potential sources of particles where the occupants marked 141
time when these sources/activities were used / conducted in order to cross-reference 142
them with concentration levels. The second questionnaire focused to the 143
occupancy/activities of room where sampling equipment was placed. The last 144
questionnaire focused on schedule of children’s activities and their physical activity 145
during the sampling. All necessary permissions were obtained from administrative 146
boarders of each preschool and directly from parents. 147
148
Dose rate analysis 149
Particle dose rates for children were calculated using Equation 1 (Castro et al., 150
2011; Slezakova et al., 2014): 151
Dose rate (D) = (BRWA/BW) ×CWA × OF × N (1)
where D is the age-specific dose rate (particle number kg–1 day–1); BR
Wa is the age-153
specific weighted average breathing rate (L min–1); BW is age-specific body weight 154
(kg); CWA is the age-specific weighted average concentration of particles (number of 155
particles L–1); OF is the occupancy factor (i.e. percentage of residents likely to be in the 156
microenvironment at a given interval; it was considered 1, as children kept their 157
schedules and associated locations tightly); and N is the total time per day spent by age-158
specific children in the respective indoor environment (min day–1). Particle dose rates 159
were estimated for 3–4 and 5 years old children. The daily activity patterns of children 160
were analyzed throughout each day. Locations in which the different activities 161
happened during the day were identified. Total daily residence time of children spent 162
in each micro-environment (home, preschool) and the types of performed activities 163
were registered. Each activity was characterized in terms of intensity level in order to 164
assess the corresponding BR. An example of children timetable and activity patterns is 165
shown in Table 2. As the information concerning the Portuguese population is not 166
available, the age–specific factors (BW, BR) were retrieved from USEPA data 167
(USEPA, 2011) considering the mixed population (both male and females). BW of 18.6 168
kg for 3–5 years old children was used. The values of BR were selected as the 169
followings: 4.3 L min–1 for rest or sleep; 4.5 L min–1 for sedentary or passive activities; 170
11.0 L min–1 for light intense activity, and 37.0 L min–1 for highly intense activities 171
(running, etc.). BRWA was estimated then as weighted average, i.e. considering the 172
intensity of each performed activities and the amount of time. The dose rates were then 173
estimated using the average indoor concentrations of each microenvironment (and 174
considering the real amount of time that children spent in each place). 175
176
Statistical analysis 177
For the data treatment, the Student’s t-test was applied to determine the statistical 178
significance (p<0.05, two tailed) of the differences between the determined means. All 179
statistical analyses were performed using IBM® SPSS® Statistics software. 180
181
RESULTS 182
Particle number concentrations 183
Total means of particle number concentrations and the statistical parameters 184
(minimum and maximum values, 25th, and 75th percentile) at the two preschools and 185
three homes are shown in Figure 1. These parameters of (ultra)fine particles were 186
determined using all measured data of all existent indoor environments. Concerning 187
two preschools, mean of indoor PNC was significantly (1.4 times) higher (p < 0.05) at 188
S1 (1.84×10⁴ particles cm–3) than at S2 (mean of 1.32×10⁴ particles cm–3). 189
At all three homes, obtained means of indoor (ultra)fine particles (Table 1) were 190
rather similar; the results showed that the total indoor means of PNC at three homes 191
were not statistically different (p < 0.05). Overall, the highest mean and the ranges of 192
PNC were observed at H1 with mean concentration 1.1 times higher than at H2 and H3. 193
194
Dose rates 195
The activities that children conducted during their school time were alike at both 196
preschools. However, the dose rates of indoor particles were estimated for 2 age 197
categories, namely 3–4 years old and 5 years old children because their daily schedules 198
slightly differed. Children spent the majority of their preschool time in classrooms 199
(approximately 70–75% for 3–4 years old, and 57%–70% for 5 years old). The younger 200
children rested (i.e. slept which was an activity associated with the lowest breathing 201
rates) after lunch for 2–2.5 hours whereas older children performed indoors more 202
frequently physical activities (such as running, playing, exercising, use of climbers, 203
swings and slides). In addition, the 5 years old children spent less time (0.75–1.75 h) 204
indoors. Overall, the daily activity patterns of children at three homes were remarkably 205
similar. On average, children spent 13 h at home, out of which 3 h took place in a living 206
room (sedentary or light activities; studying, games playing, drawing, or eating). 207
Morning and evening routines (breakfast, bath, and etc.) took approximately for 1 h 208
whereas child sleep accounted for about 9 h. 209
Dose rates associated with inhalation exposure to (ultra)fine particles (20–1000 210
nm) number concentrations at two preschools and three homes were estimated for two 211
different age categories of children. The results are shown in Table 3. Concerning 212
preschools, the results clearly show that: (i) for both age categories the highest dose 213
rates of PNC were found at S1; and ii) for both schools the highest values of PNC total 214
dose rates were observed for 5 years old children. Furthermore, the results in Table 3 215
clearly show that for 3–4 years and 5 years old children dose rates at homes were 1.3– 216
2.1 times higher than at schools. 217
218
DISCUSSION 219
As children represent one of the most vulnerable groups in society, more 220
information concerning the air pollutants to which they are adversely exposed in 221
schools and home environments is needed. Overall, levels of (ultra)fine particles at the 222
two Portuguese preschools were in similar ranges to those reported for indoor air of 223
schools in Greece (2.4×10⁴ particles cm–3; Diapouli et al., 2008), Italy (1.95–2.04×10⁴ 224
particles cm–3;Buonanno et al., 2012, 2013a), Spain (1.56×10⁴ particles cm–3; Reche 225
et al.. 2014; Rivas et al.; 2014), South Korea (1.82×10⁴ particles cm–3; Kim et al., 226
2011;) or Australia (1.21–1.69×10⁴ particles cm–3; Rumchev et al., 2007). In addition, 227
large ongoing epidemiological study of UFP in schools has been conducted in 228
Melbourne (Australia). The authors reported emission rates of UFP as well as 229
deposition of UFP in lungs so direct comparison with levels in air was not possible. 230
Other studies from Europe, namely from Denmark, Germany, and Sweden, (Clausen et 231
al., 2012; Fromme et al., 2007; Norbäck et al., 2011) reported much lower levels of 232
ultrafine particles (0.7×10³–6.5×10³ particles cm–3) than in present work. Different 233
levels of urbanization and development of area surrounding schools, meteorological 234
conditions or seasonal influences could account for some of these differences 235
(Morawska et al., 2009). It is also necessary to point that the majority of the existent 236
studies on UFP in educational settings focused on assessments in classrooms (Clausen 237
et al., 2012; Fromme et al., 2007; Guo et al., 2010; Mullen et al., 2011; Norbäck et al., 238
2011; Weichenthal et al., 2008). Only one study (Zhang & Zhu, 2012) reported the 239
information on ultrafine particles also in other school microenvironments (gymnasium, 240
canteen, libraries), being otherwise inexistent. In this work, classrooms were the 241
microenvironment associated with lower particle number concentrations at both 242
preschools (mean of 9.31×10³ and 1.13×10⁴ particle cm–3 at S1 and S2, respectively), 243
which is reassuring, considering that they are the places where children spend the 244
majority of their school time. The major identified sources of (ultra)fine particles, based 245
on the daily registered information, were: classroom cleaning, children activities during 246
classes (such as sculpturing, and etc.) and combustion sources; levels of (ultra)fine 247
particles in ambient air ranged from 2.4 × 10³ to 4.3 × 10⁴ (Slezakova et al., 2014). On 248
the contrary, at both preschools PNC in canteens (mean of 5.17×10⁴ and 3.28×10⁴ 249
particle cm–3 at S1 and S2, respectively) were the highest ones. Although, children 250
spend in canteens rather short periods of time (18 and 19% of their school time at S1 251
and S2, respectively) the exposures in this type of indoor microenvironment might be 252
relevant for overall child school exposure. Furthermore, exposure to high levels of 253
ultrafine particles numbers, even if during a limited period of time, may pose some risks 254
to child health (Burtscher & Schüepp, 2012). In agreement with these findings, Mullen 255
et al. (2011) previously reported that cooking events were the most significant indoor 256
sources (during normal occupancy) at six schools in California (USA). The importance 257
of cooking and eating activities have been also demonstrated in more recent studies 258
evaluating particle deposition in the alveolar and tracheobronchial region (Buonanno et 259
al., 2011, 2012; 2013b; Mazaheri et al., 2013). 260
At three homes the mean concentrations of particles number ranged between 261
1.09×10⁴ and 1.24×10⁴ particles cm–3. These levels of PNC were similar to mean 262
concentrations reported in literature for homes in Germany (0.9×10⁴ particles cm–3; 263
Fittschen et al., 2013), Greece (1.3–1.4×10⁴ particles cm–3; Diapouli et al., 2011), 264
Canada (0.8–1.03×10⁴ particles cm–3; Kearney et al., 2011; Wheeler et al., 2011), and 265
Australia (1.24×10⁴ particles cm–3; Morawska et al., 2003). However, recently Bekö et 266
al. (2013) conducted a large study that assessed UFP in 56 residences in Denmark. 267
These authors reported UFP approximately three times higher than in Portuguese homes 268
(mean of 2.91×10⁴ particle cm–3; Bekö et al., 2013). Different study design (sampling 269
period, duration, number of homes) and/or different particle size ranges of measured 270
ultrafine fraction could also contribute to these differences (Morawska et al., 2013). 271
Overall, the highest mean of PNC as well maximal levels (i.e. 2.1×10⁵ particle 272
cm–3) were observed at H1. Based on the analysis of information available from the 273
questionnaires, the indoor sources of UFP at H1 included: cooking (boiling and frying), 274
use of toaster and oven, use of cleaning products, vacuuming and ironing. Certainly the 275
frequency and durations of these indoor activities might have influenced the respective 276
levels. However, it is also necessary to remark that contrary to the other two homes, at 277
H1 the room where the sampling was conducted was directly connected with a kitchen. 278
In addition, occupants of this home maintained doors between kitchen and living room 279
almost constantly opened. Thus, PNC from cooking emissions easily penetrated to the 280
sampling area (Bordado et al., 2012; Buonanno et al., 2013b), and accounted for the 281
high concentrations at this home. The variation of time and location (room type) can 282
account for the obtained differences of (ultra)fine particles (Bekö, et al., 2013). 283
Overall, the levels of PNC at three homes were 10–70% lower than at 284
preschools. However, activities (and the levels of their physical intensity) that are 285
typically performed in an educational institution vary greatly from those of home. 286
Therefore, the dose rates resulting from a stay in these two environments might differ 287
considerably. 288
The highest doses of PNC at preschools were found for children of S1 (Table 3). 289
Although levels of PNC in classrooms were the highest at S2, doses of UFP resulting 290
from school exposure were higher (up to 50%) for children at S1, probably due to the 291
higher levels of PNC in the canteen of the respective preschool. These findings thus 292
demonstrate that all potential microenvironments should be considered when assessing 293
children exposure to PNC in preschools and schools. 294
The estimated dose rates of indoor PNC at both schools were compared between 295
both age groups of children. The results in Table 3 show that at S2 the dose rates were 296
higher for 5 years old children. As mentioned previously, older children performed 297
more frequently physical activities which were associated with the highest breathing 298
rates and consequently led to higher inhalation doses of particles. On the contrary 3–4 299
years old children spent more time in classrooms where levels of PNC were the lowest. 300
Furthermore, after the lunch 3–4 years old children slept in the classrooms which was 301
an activity associated with the lowest breathing rates. At S1, the estimated dose rates 302
were not statistically different (p < 0.05) between 3–4 years old and 5 years old children, 303
which was probably due to the different activity patterns; older children spent indoors 304
less 1.75 h and contributions resulting from the outdoor exposure was not considered 305
in this work. Therefore, in future work when assessing children a period spent during 306
school daytime outdoors should be considered as it might be relevant to child overall 307
school exposure. 308
When evaluating the three homes (Table 3), the highest dose rates of particles 309
were observed for children at H1 due to the highest levels of UFP at this home. When 310
in use, particles samplers make minor noise. Therefore, in order to maintain soundless 311
rest of children it was not possible to conduct measurements directly in children 312
bedrooms. The obtained dose rates of PNC at H1–H3 thus represent an approximation 313
of child home exposure and need to be interpreted carefully. 314
Finally, dose rates of particles in (ultra)fine range at homes were higher than those 315
of preschools. Although number concentrations (ultra)fine particles at the three homes 316
were lower than total levels at both preschools (Figure 1), children spent at homes 317
approximately 13 h (opposed to 9 h at preschools). The longer exposure time could 318
account for the obtained values. These results thus show that daily activity patterns 319
significantly influenced overall doses to PNC in 3–5 years old children. 320
The dose rates of in (ultra)fine particles estimated in this work were due to indoor 321
exposure at preschools and homes only. However, children spend on a daily basis some 322
of their time in other microenvironments (transportation modes, extracurricular 323
activities, and etc.) where they are exposed to UFP from additional sources. Therefore, 324
characterization of the respective exposures to UFP for children in these 325
microenvironments is of upmost importance. Furthermore, future studies focusing on 326
the health effects of airborne pollutants should always account for children exposures 327
in different microenvironments (homes, schools, transportation modes, and etc.) in 328
order to obtain a correct representation of child’s overall exposure. 329
330
Acknowledgments 331
This work was supported by Fundação para Ciência e Tecnologia with grant number 332
SFRH/BPD/65722/2009. It also received financial support from the European Union 333
(FEDER funds through COMPETE) and National Funds (Fundação para a Ciência e 334
Tecnologia) through project Pest-C/EQB/LA0006/2013. 335
References 337
Azarmi, F., Kumar, P., and Mulheron, M. 2014. The exposure to coarse, fine and 338
ultrafine particle emissions from concrete mixing, drilling and cutting activities. J. 339
Hazard. Mater. 279:268–279. 340
Bakand, S., Hayes, A., and Dechsakulthorn, F. 2012. Nanoparticles: A review of 341
particle toxicology following inhalation exposure. Inhal. Toxicol. 24(2): 125–135. 342
Bhangar, S., Mullen, N. A., Hering, S. V., Kreisberg, N. M., and Nazaroff, W. W. 2011. 343
Ultrafine particle concentrations and exposures in seven residences in northern 344
California. Indoor Air 21(2): 132–144. 345
Bekö, G., Weschler, C. J., Wierzbicka, A., Karottki, D. G., Toftum, J., Loft, S., and 346
Clausen, G. 2013. Ultrafine particles: Exposure and source apportionment in 56 Danish 347
homes. Environ. Sci. Technol .47(18): 10240–10248. 348
Bordado, J. C., Gomes J. F., and Albuquerque P. C. 2012. Exposure to airborne ultrafine 349
particles from cooking in Portuguese homes. J. Air Waste Manag. Assoc. 62(10): 1116– 350
126. 351
Brunekreef, B., Beelen, R., Hoek, G., Schouten, L., Bausch-Goldbohm, S., Fischer, P., 352
Armstrong, B., Hughes, E., Jerrett, M., and van den Brandt, P. 2009. Effects of long-353
term exposure to traffic-related air pollution on respiratory and cardiovascular mortality 354
in the Netherlands: the NLCS-AIR study. Res. Rep. Health Eff. Inst. 139: 5–71. 355
Buonanno, G., Fuoco, F. C., Morawska, L., and Stabile, L. 2013a. Airborne particle 356
concentrations at schools measured at different spatial scales. Atmos. Environ. 67: 38– 357
45. 358
Buonanno, G. Giovinco, G., Morawska, L., and Stabile, L. 2011. Tracheobronchial and 359
alveolar dose of submicrometer particles for different population age groups in Italy. 360
Atmos. Environ. 45:6216–6224. 361
Buonanno, G., Marini, S., Morawska, L., and Fuoco, F. C. 2012. Individual dose and 362
Buonanno, G., Morawska, L, Stabile, L., Wang, L., and Giovinco, G. 2012. A 364
comparison of submicrometer particle dose between Australian and Italian people. 365
Environ. Pollut. 169:183–189. 366
Buonanno, G., Stabile, L., Morawska, L., and Russi, A. 2013b. Children exposure 367
assessment to ultrafine particles and black carbon: The role of transport and cooking 368
activities. Atmos. Environ. 79: 53–58. 369
Burtscher, H., and Schüepp, K. 2012. The occurrence of ultrafine particles in the 370
specific environment of children. Paediatr. Respir. Rev. 13(2): 89–94. 371
Castro, D., Slezakova, K., Delerue-Matos, C., Alvim-Ferraz, M. C., Morais, S., and 372
Pereira, M. C. 2011. Polycyclic aromatic hydrocarbons in gas and particulate phases of 373
indoor environments influenced by tobacco smoke: Levels, phase distributions, and 374
health risks. Atmos. Environ. 45(10): 1799–1808. 375
Clausen, G., Høst, A., Toftum, J., Bekö, G., Weschler, C., Callesen, M., Buhl, S., 376
Ladegaard, M. B., Langer, S., Andersen, B., Sundell, J., Bornehag, C. G., and 377
Sigsgaard, T. 2012. Children's health and its association with indoor environments in 378
Danish homes and daycare centres – methods. Indoor Air 22(6): 467–475. 379
Diapouli, E., Chaloulakou, A., and Spyrellis, N. 2007. Levels of ultrafine particles in 380
different microenvironment—implications to children exposure. Sci. Total Environ. 381
388: 128–136. 382
Diapouli, E., Eleftheriadis, K., Karanasiou, A. A., Vratolis, S., Hermansen, O., 383
Colbeck, I., and Lazaridis, M. 2011. Indoor and outdoor particle number and mass 384
concentrations in Athens. Sources, sinks and variability of aerosol parameters. Aerosol 385
Air Qual. Res. 11(6): 632–642. 386
Diapouli, E., Chaloulakou, A., Mihalopoulos, N., and Spyrellis, N. 2008. Indoor and 387
outdoor PM mass and number concentrations at schools in the Athens area. Environ. 388
Fittschen, U. E. A., Santen, M., Rehmers, A., Durukan, I., and Wesselmann, M. 2013. 390
Indoor aerosol determination with respect to a soiling phenomenon in private 391
residences. Environ. Sci. Technol. 47(1), 608–615. 392
Fromme, H., Twardella, D., Dietrich, S., Heitmann, D., Schierl, R., Liebl, B., and 393
Rüden, H. 2007. Particulate matter in the indoor air of classrooms-exploratory results 394
from Munich and surrounding area. Atmos. Environ. 41(4): 854–866. 395
Guo, H., Morawska, L., He, C., Zhang, Y. L., Ayoko, G., and Cao, M. 2010. 396
Characterization of particle number concentrations and PM2.5 in a school: Influence of 397
outdoor air pollution on indoor air. Environ. Sci. Pollut. Res. 17: 1268–1278. 398
Heal, M. R., Kumar, P., and Harrison, R. M. 2012. Particles, air quality, policy and 399
health. Chem. Soc. Rev. 41(19): 6606–6630. 400
Ibald-Mulli, A., Wichmann, H. E., Kreyling, W., Peters, A. 2002. Epidemiological 401
evidence on health effects of ultrafine particles. J. Aerosol. Med. 15(2): 189–201. 402
Kearney, J., Wallace, L., MacNeill, M., Xu, X., Vanryswyk, K., You, H., Kulka, R., 403
and Wheeler, A. 2011. Residential indoor and outdoor ultrafine particles in Windsor, 404
Ontario. Atmos. Environ. 45(40): 7583–7593. 405
Kelly, F. J., and Fussell, J. C. 2012. Size, source and chemical composition as 406
determinants of toxicity attributable to ambient particulate matter. Atmos. Environ. 60: 407
504–526. 408
Kim, J.-L., Elfman, L., Wieslander, G., Ferm, M., Torén, K., and Norbäck, D. 2011. 409
Respiratory health among Korean pupils in relation to home, school and outdoor 410
environment. J. Korean Med. Sci. 26(2): 166–173. 411
Krewski, D., Burnett, R. T., Goldberg, M. S., Hoover, B. K., Siemiatycki, J., Jerrett, 412
M., Abrahamowicz, M., and White, W. H. 2003. Overview of the Reanalysis of the 413
Harvard Six Cities Study and American Cancer Society study of particulate air pollution 414
and mortality. J. Toxicol. Env. Health A 66(16–19): 1507–1551. 415
Krewski, D., and Rainham, D. 2007. Ambient air pollution and population health: 416
Overview. J. Toxicol. Env. Health A 70 (3–4): 275–283. 417
Kumar, P., Robins, A., Vardoulakis, S., and Britter, R. 2010. A review of the 418
characteristics of nanoparticles in the urban atmosphere and the prospects for 419
developing regulatory controls. Atmos. Environ. 44(39): 5035–5052. 420
Laiman, R., He, C., Mazaheri, M., Clifford, S., Salimi, F., Crilley, L. R., Megat 421
Mokhtar, M. A., and Morawska, L. 2014. Characteristics of ultrafine particle sources 422
and deposition rates in primary school classrooms. Atmos. Environ. 94:28–35. 423
Long, C. M., Suh, H. H., and Koutrakis, P. 2000. Characterization of indoor particle 424
sources using continuous mass and size monitors. J. Air Waste Manag. Assoc. 50: 425
1236–1250. 426
Mazaheri, M., Clifford, S., Jayaratne, R., Megat Mokhtar, M. A., Fuoco, F., Buonanno, 427
G., and Morawska, L. 2014. School children's personal exposure to ultrafine particles 428
in the urban environment. Environ. Sci. Technol. 48(1):113–120. 429
Morawska, L., Afshari, A., Bae, G. N., Buonanno, G., Chao, C. Y. H., Hänninen, O., 430
Hofmann, W., Isaxon, C., Jayaratne, E. R., Pasanen, P., Salthammer, T., Waring M., 431
and Wierzbicka A. 2013. Indoor aerosols: from personal exposure to risk assessment. 432
Indoor Air 23(6): 462–487. 433
Morawska, L., He, C., Hitchins, J., Mengersen, K., and Gilbert, D. 2003. Characteristics 434
of particle number and mass concentrations in residential houses in Brisbane, Australia. 435
Atmos. Environ. 37: 4195–4203. 436
Morawska, L., He, C., Johnson, G., Guo, H., Uhde, E., and Ayoko, G. 2009. Ultrafine 437
particles in indoor air of a school: possible role of secondary organic aerosols. Environ. 438
Sci. Technol. 43(24): 9103–9109. 439
Morawska, L., Ristovski, Z., Jayaratne, E. R., Keogh, D. U., and Ling, X. 2008. 440
Ambient nano and ultrafine particles from motor vehicle emissions: characteristics, 441
ambient processing and implications on human exposure. Atmos. Environ. 42(35): 442
8113–8138. 443
Moreno, T., Rivas, I., Bouso, L., Viana, M., Jones, T., Àlvarez-Pedrerol, M., Alastuey, 444
A., Sunyer, J., and Querol, X. 2014. Variations in school playground and classroom 445
atmospheric particulate chemistry. Atmos. Environ. 91:162–171. 446
Mullen, N. A., Bhangar, S., Hering, S. V., Kreisberg, N. M., and Nazaroff, W. W. 2011. 447
Ultrafine particle concentrations and exposures in six elementary school classrooms in 448
northern California. Indoor Air 21(1): 77–87. 449
Norbäck, D., Wieslander, G., Zhang, X., and Zhao, Z. 2011 Respiratory symptoms, 450
perceived air quality and physiological signs in elementary school pupils in relation to 451
displacement and mixing ventilation system: an intervention study. Indoor Air 21(5): 452
427–437. 453
Pereira Gomes, J. F., Moura Bordado, J. C., and Silva Albuquerque, P. C. 2012. On the 454
assessment of exposure to airborne ultrafine particles in urban environments. J. Toxicol. 455
Env. Health A 75(22–23): 1316–1329. 456
Reche, C., Viana, M., Rivas, I., Bouso, L., Àlvarez-Pedrerol, M., Alastuey, A., Sunyer, 457
J., and Querol, X. 2014. Outdoor and indoor UFP in primary schools across Barcelona. 458
Sci. Total Environ. 493:943–953. 459
Rivas, I., Viana, M., Moreno, T., Bouso, L., Pandolfi, M., Alvarez-Pedrerol, M., Forns, 460
J., Alastuey, A., Sunyer, J., and Querol, X. 2015. Outdoor infiltration and indoor 461
contribution of UFP and BC, OC, secondary inorganic ions and metals in PM2.5 in 462
schools. Atmos. Environ. 106:129–138. 463
Rivas, I., Viana, M., Moreno, T., Pandolfi, M., Amato, F., Reche, C., Bouso, L., 464
Àlvarez-Pedrerol, M., Alastuey, A., Sunyer, J., and Querol, X. 2014. Child exposure to 465
indoor and outdoor air pollutants in schools in Barcelona, Spain. Environ. Int. 69:200– 466
212. 467
Rückerl, R., Schneider, A., Breitner, S., Cyrys, J., and Peters, A. 2011. Health effects 468
of particulate air pollution: A review of epidemiological evidence. Inhalation. Toxicol. 469
23(10): 555–592. 470
Rumchev, K., Ourangui, R., Bertolatti, D., and Spickett, J. 2007. Indoor air quality in 471
old and new schools. WIT Trans. Biomed. Health 11: 25–32. 472
Samet, J., and Krewski, D. 2007. Health effects associated with exposure to ambient air 473
pollution. J. Toxicol. Env. Health A 70 (3–4): 227–242. 474
Schüepp, K., and Sly, P. D. 2012. The developing respiratory tract and its specific needs 475
in regard to ultrafine particulate matter exposure. Paediatr. Respir. Rev. 13(2): 95–99. 476
Schwab, M., McDermott, A., and Spengler, J. D. 1992. Using longitudinal data to 477
understand children's activity patterns in an exposure context: Data from the Kanawha 478
County Health Study. Environ. Int. 18(2): 173–189. 479
Slezakova, K., Castro, D., Begonha, A., Delerue-Matos, C., Alvim-Ferraz, M. C., 480
Morais, S., and Pereira, M. C. 2011. Air pollution from traffic emissions in Oporto, 481
Portugal: Health and environmental implications. Microchem. J. 99 (1): 51–59. 482
Slezakova, K., Fonseca, J., Morais, S., and Pereira, M. C. 2014. Ultrafine particles in 483
ambient air of an urban area: Dose implications for elderly. J. Toxicol. Env. Health A 484
77 (14–16): 827–836. 485
Slezakova, K., Pires, J. C. M., Castro, D., Alvim-Ferraz, M. C. M., Delerue-Matos, C., 486
Morais, S., and Pereira, M. C. 2013. PAH air pollution at a Portuguese urban area: 487
Carcinogenic risks and sources identification. Environ. Sci. Pollut. Res. Int. 20 (6): 488
3932–3945. 489
Solomon, P. A. 2012. An overview of ultrafine particles in ambient air. EM issue May: 490
18–23. 491
United States Environmental Protection Agency (USEPA) 2011. Exposure Factors 492
Handbook: 2011 edition. EPA/600/R–09/052F, Washington, DC: USEPA Office for 493
Research and Development. 494
Viana, M., Rivas, I., Querol, X., Alastuey, A., Álvarez-Pedrerol, M., Bouso, L., Sioutas, 495
C., and Sunyer, J. 2015. Partitioning of trace elements and metals between quasi-496
ultrafine, accumulation and coarse aerosols in indoor and outdoor air in schools. 497
Atmos. Environ. in presss, doi: 10.1021/es403721w. 498
Viana, M., Rivas, I., Querol, X., Alastuey, A., Sunyer, J., Álvarez-Pedrerol, M., Bouso, 499
L., and Sioutas, C. 2014. Indoor/outdoor relationships and mass closure of quasi-500
ultrafine, accumulation and coarse mode particles in Barcelona schools. Atmos. Chem. 501
Phys.14:4459–4472. 502
Wang, Y., Hopke, P. K., Chalupa, D. C., and Utell, M. J. 2011. Long-term study of 503
urban ultrafine particles and other pollutants. Atmos. Environ. 45(40):7672–7680. 504
Weichenthal, S., Dufresne, A., Infante-Rivard, C., and Joseph, L. 2008. Characterizing 505
and predicting ultrafine particle counts in Canadian classrooms during the winter 506
months: model development and evaluation. Environ. Res. 106(3): 349–360. 507
Wheeler, A. J., Wallace, L. A., Kearney, J., Van Ryswyk, K., You, H., Kulka, R., 508
Brook, J. R., and Xu, X. 2011. Personal, indoor, and outdoor concentrations of fine and 509
ultrafine particles using continuous monitors in multiple residences. Aerosol Sci. 510
Technol. 45(9): 1078–1089. 511
Zhang, Q., and Zhu, Y. 2012. Characterizing ultrafine particles and other air pollutants 512
at five schools in South Texas. Indoor Air 22(1): 33–42. 513
Figure Captions 515
FIGURE 1. Levels of (ultra)fine particles at two schools (S1, S2) and three homes (H1– 516
H3): minimum and maximum values, average, 25th, and 75th percentile. Particle number 517
concentrations were determined considering the measured levels in all indoor 518
microenvironments existent in each school and home. 519
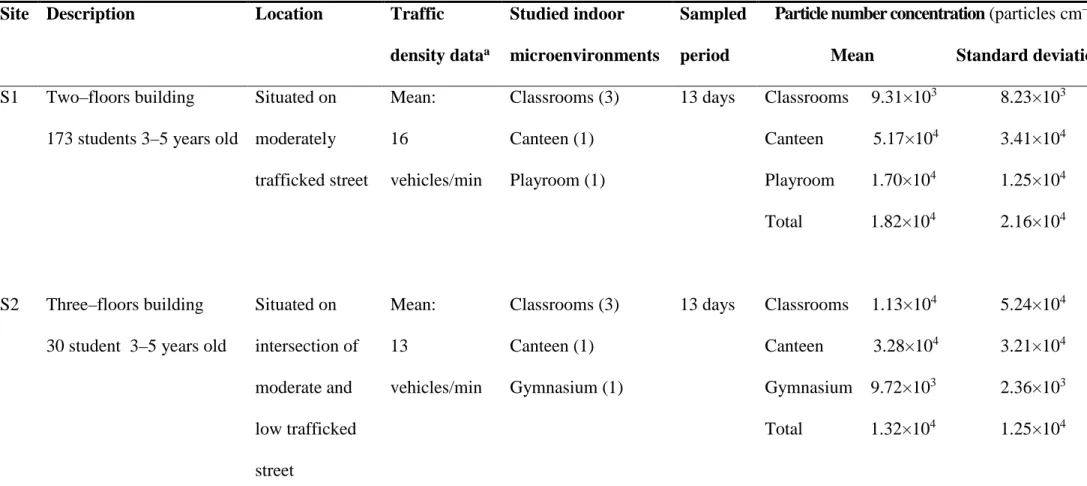
TABLE 1. Characterization of the studied environments (preschools and homes) and obtained concentrations of (ultra)fine particles.
Site Description Location Traffic density dataa
Studied indoor microenvironments
Sampled period
Particle number concentration (particles cm–3) Mean Standard deviation
S1 Two–floors building Situated on
moderately trafficked street Mean: 16 vehicles/min Classrooms (3) Canteen (1) Playroom (1) 13 days Classrooms 9.31×10³ 8.23×10³
173 students 3–5 years old Canteen 5.17×10⁴ 3.41×10⁴
Playroom 1.70×10⁴ 1.25×10⁴
Total 1.82×10⁴ 2.16×10⁴
S2 Three–floors building Situated on
intersection of moderate and low trafficked street Mean: 13 vehicles/min Classrooms (3) Canteen (1) Gymnasium (1) 13 days Classrooms 1.13×10⁴ 5.24×10⁴
30 student 3–5 years old Canteen 3.28×10⁴ 3.21×10⁴
Gymnasium 9.72×10³ 2.36×10³
H1 Multi–unit apartment building Situated on intersection of two low trafficked street Mean: 3 vehicles/min
Living room 10 days 1.24 ×10⁴ 1.28 ×10⁴
Situated on 4th floor
4 occupants (2 children of 3 and 5 years old)
H2 Multi–unit apartment
building
Situated nearby highly
trafficked road
Not available Living room 9 days 1.11 × 10⁴ 1.15 × 10⁴
Situated on 4th floor
4 occupants (1 child of 5 years old)
H3 Two–floors house Situated in
suburban zone with moderate traffic Mean: 4 vehicles/min
a Data was obtained by manual counts during 10 min of each hour (between 5 a.m. to 12p.m.) on two consecutive days (avoiding Mondays and
Fridays). The location distance between the counting point and main entrance/building outside wall was 5 and 8 m at S1 and S2, respectively and 3–4 m at H1 and H3.
4 occupants (1 child of 5 years old)
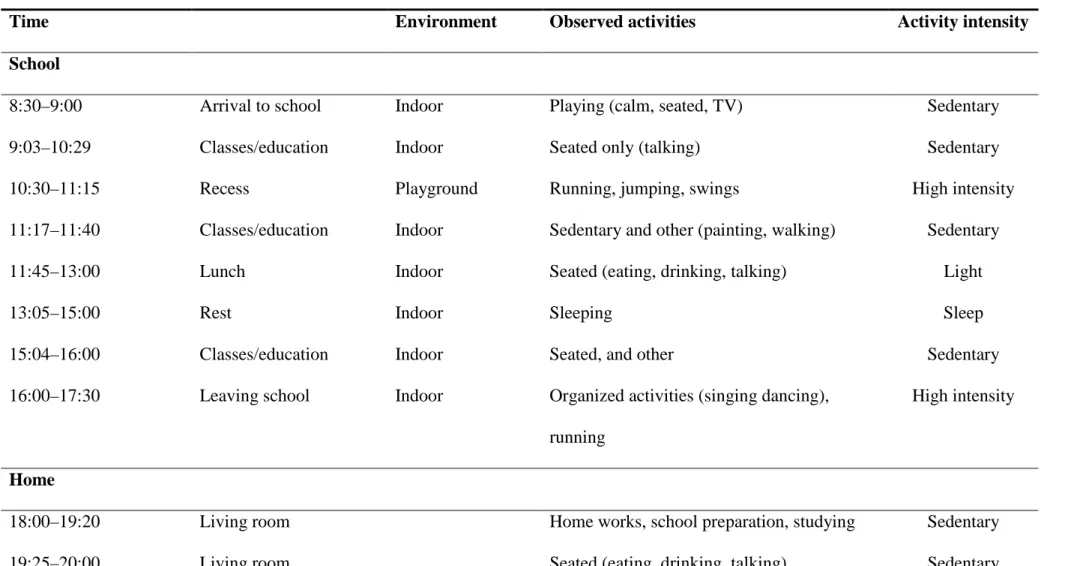
TABLE 2. Timetable and child activity patterns during a weekday: an example for 3–4years old children at school and a home.
Time Environment Observed activities Activity intensity
School
8:30–9:00 Arrival to school Indoor Playing (calm, seated, TV) Sedentary
9:03–10:29 Classes/education Indoor Seated only (talking) Sedentary
10:30–11:15 Recess Playground Running, jumping, swings High intensity
11:17–11:40 Classes/education Indoor Sedentary and other (painting, walking) Sedentary
11:45–13:00 Lunch Indoor Seated (eating, drinking, talking) Light
13:05–15:00 Rest Indoor Sleeping Sleep
15:04–16:00 Classes/education Indoor Seated, and other Sedentary
16:00–17:30 Leaving school Indoor Organized activities (singing dancing),
running
High intensity
Home
18:00–19:20 Living room Home works, school preparation, studying Sedentary
20:05–:22:00 Living room Playing games, painting, walking Light
22:00–6:50 Bedroom Sleeping Sleep
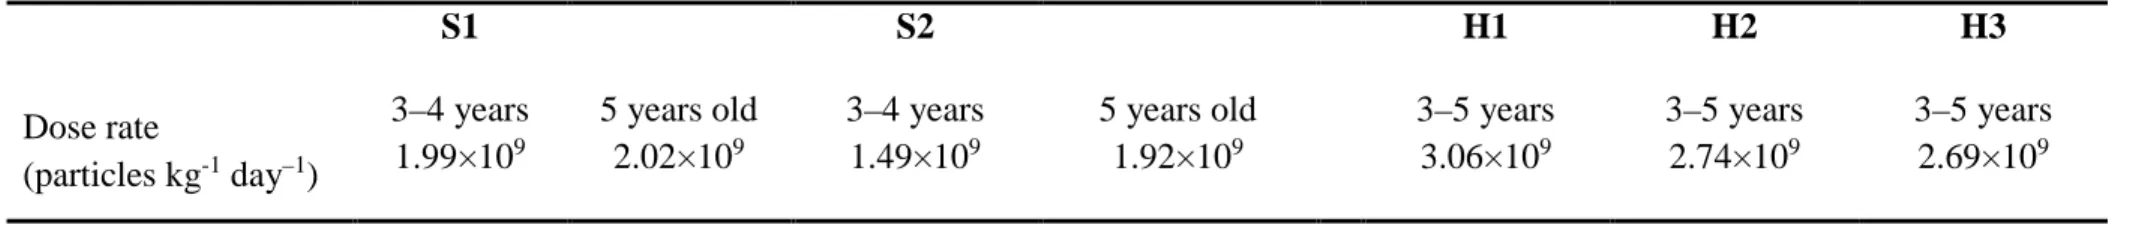
TABLE 3. Age–specific dose rates (particles kg-1 day–1) to UFP for 3–4 years and 5 years old children at two preschools (S1 and S2) and three homes (H1–H3).
S1 S2 H1 H2 H3
Dose rate
(particles kg-1 day–1)
3–4 years 5 years old 3–4 years 5 years old 3–5 years 3–5 years 3–5 years
FIGURE 1 1.0E+03 1.0E+04 1.0E+05 1.0E+06