Universidade de Trás-os-Montes e Alto Douro
Using Real-Time-Ultrasound to estimate body composition of
tilapia (Oreochromis niloticus Linnaeus)
Dissertação de Mestrado em Engenharia Zootécnica
Catarina Alexandra Peixoto Gonçalves
Orientadores: Professor Doutor Severiano José Cruz da Rocha e Silva
Professor Doutor Paulo José de Azevedo Pinto Rema
Composição do Júri:
Professor Doutor José Júlio de Gonçalves Barros Martins
Professora Doutora Cristina Vitória de Miranda Guedes
As doutrinas apresentadas são da exclusiva responsabilidade do autor.
“Blackbird singing in the dead of night Take these broken wings and learn to fly All your life You were only waiting for this moment to arise. Blackbird singing in the dead of night Take these sunken eyes and learn to see All your life You were only waiting for this moment to be free. Blackbird fly Blackbird fly Into the light of the dark black night”.
i
Acknowledgements
Ao concluir mais uma etapa da minha vida, apercebo-me da sorte que tenho pelas pessoas que se cruzaram no meu caminho, mais ainda pelas que escolheram caminhar comigo. Assim sendo, não podia deixar de escrever esta nota com muito carinho e gratidão. Aos meus pais, pela motivação e por todas as oportunidades que me deram.
À minha avó Miquelina, porque grande parte do que sou a ela o devo e à avó Teresinha, pela fé inabalável que sempre teve em mim. Ao avô, por ser avô, pai e tantas outras coisas. Por cuidar de mim sempre, mesmo quando eu já tinha idade para ter juízo.
Aos meus primos, que se conseguem transformar em irmãos e amigos quando mais preciso. À minha irmã Raquel, que me faz querer ser o melhor exemplo possível.
Aos meus orientadores, Professor Severiano Silva e Professor Paulo Rema, por tornarem este trabalho possível, por todo o apoio e muita paciência.
Ao Sr. António e à Sara Basto, por toda a ajuda com a parte experimental.
Aos meus amigos que, com o passar dos anos, se foram tornando na minha pequena família. Por acreditarem em mim mesmo quando eu não conseguia, por toda a força e apoio incondicional.
Aos meus colegas de casa deste último ano, devo-vos muito, nada seria possível sem vocês.
iii
Abstract
The knowledge of fish composition using non-destructive methods is an important issue for nutrition, genetics and physiology fields. In this way this study was undertaken with the objective to predict tilapia fillet (Oreochromis niloticus) using real-time ultrasonography and image analysis. A heterogeneous group of tilapia (Oreochromis niloticus) was used for this experiment (n= 51, mean weight= 167.35 ± 56.09 g, range from 47.35 to 305.07 g). All animals were under mild anaesthesia, during the scanning procedure. They were scanned with a real-time ultrasound (RTU), equipped with a linear array transducer of 7.5 MHz. The RTU images were taken in six cross-sectional slices. The dorsal fillet area was determined using Fiji software. The RTU fillet weight was determined by taking into account the value of 1.0798 g/cm3 for tilapia fish muscle specific density. The correlation between determined fillet weight and volume and the RTU equivalent measurements is significant (r ranged between 0.94 and 0.96; P<0.001). The linear model can explain 89% of the variation of the fillet volume.
In conclusion, the obtained results suggest that RTU and image analysis is a viable non-destructive and non-invasive method for fillet volume evaluation in Oreochromis niloticus.
iv
Resumo
O conhecimento da composição dos peixes usando métodos não destrutivos é uma questão importante para os campos da nutrição, genética e fisiologia. Desta forma, este estudo foi realizado com o objetivo de predizer o filete de tilápia (Oreochromis niloticus) utilizando ultrassonografia em tempo real e análise de imagens. Um grupo heterogéneo de tilápia (Oreochromis niloticus) foi utilizado para este trabalho (n = 51, peso médio = 167,35 ± 56,09 g, variando de 47,35 a 305,07 g). Todos os animais estavam sob anestesia leve, durante o procedimento de obtenção das imagens de ultrassom. Os animais foram examinados com um ultrassom em tempo real (UTR), equipado com uma sonda linear de 7,5 MHz. As imagens da UTR foram tiradas em seis cortes transversais. A área do filete dorsal foi determinada usando o software Fiji. O peso do filete de UTR foi determinado tendo em conta o valor de 1,0798 g / cm3 para a densidade específica de músculo de peixe tilápia. A correlação entre o peso e o volume do filete determinado e as medidas equivalentes da UTR é significativa (r variou entre 0,94 e 0,96; P <0,001). O modelo linear pode explicar 89% da variação do volume de filete. Em conclusão, os resultados obtidos sugerem que a UTR e a análise de imagens são um método não destrutivo e não invasivo viável para avaliação do volume de filete em Oreochromis niloticus.
v
Contents
Acknowledgements ... i Abstract ... iii Resumo ... iv Contents ... vList of Figures ... vii
List of Tables ... vii
List of Abbreviations ... viii
1- Introduction ... 1
1.1- Nile Tilapia ... 2
1.2- The importance of body composition evaluation in fish ... 4
2- Non-invasive techniques for body composition evaluation ... 5
2.1- Computed tomography ... 6
2.2- Magnetic Resonance Imaging ... 8
2.3- Real-time ultrasound ... 9
3- Materials and methods ... 12
3.1- Animals and experimental procedures ... 12
3.2- Image acquisition ... 12
3.3- Dissection and volume determination ... 13
3.4. RTU fillet volume... 14
3.5- Statistical analysis ... 15
4- Results and discussion ... 16
5- Conclusion ... 18
vi Página propositadamente deixada em branco.
vii
List of Figures
Figure 1: Distribution map of Nile tilapia ... 2
Figure 2: Global production of tilapia throughout the years ... 3
Figure 3: Specimen of the Nile tilapia fish, Oreochromis niloticus ... 3
Figure 4: Example of multi-object CT scanning system with Tilapia fish. ... 7
Figure 5: MRI cartography of fat fractions (in g/g) on a salmon cutlet. ... 9
Figure 6: Images showing the use of ultrasound technology on live mirror carp. ... 11
Figure 7: Example of a RTU image of the dorsal fillet section. ... 13
Figure 8: Dissected fillet of Oreochromis niloticus. ... 13
Figure 9: Graduated glass for fillet volume determination. ... 14
Figure 10: Example of a tilapia fish image with arrows indicating the RTU image capture points. ... 15
Figure 11: Relationship between RTU fillet volume and determined fillet volume. ... 17
List of Tables
Table 1: Mean, standard deviation (sd), minimum, maximum and coefficient of variation (CV) for fish weight, fillet measurements (volume and weight) and RTU fillet measurements (volume and weight), (n=51) ... 16viii
List of Abbreviations
CT- Computed tomography CV- Coefficient of variationDXA- Dual-energy X-ray absorptiometry MRI- Magnetic resonance imaging R2- Coefficient of determination RSD- Residual standard deviation RTU- Real-time ultrasound SD- Standard deviation US- Ultrasound
1- Introduction
There are approximately 567 aquatic species farmed worldwide, and direct human consumption of fresh fish represents more than 75% of the global fish production (FAO, 2016). Nowadays, almost half the market for fishery products is based on fresh fish, followed by frozen, canned and cured fish. Due to over one-third of global fish production being traded internationally, it is fundamental to guarantee the safety and quality of products (FAO, 2016). Therefore, the creation of precise methods to estimate carcass composition of fish and is essential for implementing a value-based marketing system, breeding selection programs and performance testing (Silva et al., 2016; Silva, 2017). Among many imaging modalities, real-time ultrasonography (RTU) has come forth as a technique with tremendous potential for the prediction of carcass traits both in farm species and fish (Silva and Cadavez, 2012; Akdag et al., 2015; Knap and Kause, 2018). The ultrasound technique has been seen as a useful tool that allows the prediction of carcass-related traits in vivo (Silva, 2017). Additionally, RTU is a non-invasive imaging technique and less expensive than other imaging modalities, such as computed tomography (CT) or magnetic resonance imaging (MRI) (Mathiassen et al., 2011; Wu et al., 2015; Che, 2017). However, it is not surprising that those techniques allow different information, but all of them are useful in the identification of phenotypic fish information (Knap and Kause, 2018). Another feature that values RTU is its portability. Using portable technologies has the advantage of providing a rapid and reliable in situ analyses of fish (Grassi et al., 2018). Furthermore, RTU can be used as a preliminary approach followed by another procedure such as CT to improve the accuracy of the predictions (Silva, 2017).
It is in this context that this dissertation is equated and aims to assess the suitability of the RTU as a non-destructive method, for fillet volume evaluation of Nile tilapia (Oreochromis niloticus).
2
1.1-
Nile Tilapia
Nile tilapia (Oreochromis niloticus) is a tropical and freshwater species that is adapted to shallow water. The production of tilapia dates back to the Ancient Egyptians over 4000 years ago (FAO, 2005).This species is originally from Africa, as shown in figure 1 (Gupta and Acosta, 2004). Nowadays it is a highly popular farming fish, found in over 100 countries (Yuan et al., 2017).
Figure 1: Distribution map of Nile tilapia (source: fao.org)
Tilapia is the second most farmed fish in the world, with the potential to overcome carp production at a future time (Fitzsimmons, 2013). Due to its ability to tolerate environmental fluctuations such as pH, salinity, dissolved oxygen and temperature, these fishes can live in different habitats and prevail over native species (Côa et al., 2017). It is the most successful fish living in tropical and subtropical waters (Alsaggaf et al., 2017).
Nile tilapia can be used in various sorts of farming systems, from extensive to highly intensive, monoculture and polyculture (Gupta and Acosta, 2004). Throughout the last decade, the production of tilapia has tripled, since the consumers became more acceptant and aware of its increasing quality (Alsaggaf et al., 2017). The evolution of the production of tilapia is shown in Figure 2.
Target weight for tilapia depends on the type of product, for whole fish is between 400-500 g which is reached at 8 to 10 months of age, whereas for fillet the desired weight is from 700 up to 1000 g (11 to 14 months) (Gjerde et al., 2012).
Changes in fish chemical composition are said to be associated with various factors, for instance, the living area, fish size, sex, nutrition, catching season, spawning cycles and other environmental conditions (Alsaggaf et al., 2017).
3
Figure 2: Global production of tilapia (tonnes) throughout the years (source: fao.org)
It reaches sexual maturity at 10-30 cm, approximately at 5-6 months of age, provided that food is available and it only reproduces when the temperature is over 20ºC. The optimal temperature for tilapia is between 31 and 36ºC, temperatures below 11-12ºC and above 42ºC are considered lethal (FAO, 2005).
Its body is usually laterally compressed to oval and deep. It has regular and definitive stripes on the caudal fin and a dark margin on the dorsal fin (Figure 3). These fishes change colour depending on dietary, environmental and physiological causes also, during breeding season, males’ fins, pectoral, dorsal and caudal, become reddish (FAO, 2005). It can live up to 10 years and weigh over 5 kg (FAO, 2005).
4
1.2- The importance of body composition evaluation in fish
The prediction of body composition plays an important part not only in breeding programs but also in scientific studies concerning nutrition, growth, genetics and animal welfare (Scholz et al., 2015). Thus, allowing for more efficient meat production, due to genetic analysis of animal growth and tissue deposition, such as muscle, fat and bone (Kušec et al., 2016). For this reason, an objective evaluation of animals’ characteristics is required, since they are difficult to assess just by looking at them (Gupta et al., 2013).
Furthermore, the evaluation and identification of animals with higher meat yields can be used as a tool to select superior stock and speed up genetic enhancement (Gupta et al., 2013). Invasive techniques such as dissection have been deprecated in favour of non-invasive classification methods (Scholz et al., 2015). Direct procedures for carcass evaluation require animal slaughter, which is a setback for meat yield selection. Therefore, using non-destructive methods to assess muscle deposition in live fish, leads to a more efficient selection and improved meat quality. As a consequence, there will be an increase in retail product per unit weight of live fish produced(Silva et al., 2010).
Due to the existing competition within the fish industry, the search for technological solutions to increase output and profit is essential, especially for countries with high production costs (Mathiassen et al, 2011). Farmers are expected to produce fish that satisfies quality requirements, while ensuring profitability by improving fillet yield, growth rates and optimising feed conversion (Davidson et al., 2014).
The value of the final product can vary, depending on the proportions of tissues in the carcass, such as fat and muscle (Kušec et al., 2016). Processing costs may be reduced due to genetic improvement of fillet, meat and carcass yields. Leading to the same amount of products with fewer live fish. Therefore, these characteristics are of considerable economic importance for the industry (Turra et al., 2012).
According to several authors (Gjerde et al., 2012; Nguyen et al., 2010) improving fillet weight is of little importance, so increasing fillet yield of tilapia is considered to be of minor economic importance than body weight (Ma et al., 2012).On the other hand, since additional trims and deeper skinning have been requested by some customers, improving fillet yield may have a substantial economic value for the processing industry (Ma et al., 2012).
Some characteristics such as taste, nutritional value, firmness and odour are highly valuable for chefs and consumers, whereas fillet size, fat content, maturity and sex are key factors for wholesalers, distributors and retailers (Rasmussen, 2001). There has been a rising search for quality certified products. For this reason, it is essential for the industry to have access to
5 trustworthy information during the entire production process, so it can provide first-rate products for consumers (Damez and Clerjon, 2013).
This experiment was carried out in order to develop a non-destructive method to estimate fillet volume in live fish, using RTU and image analysis (Silva et al., 2010).
2- Non-invasive techniques for body composition evaluation
The possibility of studying living animals without harming them is the most important advantage of using non-destructive techniques. Therefore, these methods are convenient for multiple studies of the same object (Kušec et al., 2016). There are several non-destructive methods capable of estimating body composition on living animals, such as CT, magnetic resonance imaging (MRI) and RTU (Szabo et al., 1999).
Non-invasive techniques run on electromagnetic or mechanical energies. The signal generated by the device could be in the form of radio frequency waves (MRI), X-radiation (CT and DXA, dual-energy X-ray absorptiometry), sound waves (ultrasound, US). These have the ability to scan body tissues and bone, by passing fully or partially trough them (Scholz et al., 2015). These methods have become significantly important over the years, due to being quick and easy to use, both as research tools and for animal production itself (Sitaula, 2013).
The X-radiography was the first non-invasive imaging method to be experimented on farm animals. Specifically the use of X-radiography to study pelvis shape of different breeds in swine (Kronacher and Hogreve, 1936) and the adipose tissue deposition of fattening pigs (Hogreve, 1938; Scholz et al., 2015). CT and MRI are not appropriate for field work, since these techniques require highly trained staff. The cost of the equipment and its preservation is also a setback, for both machines (Ellis, 2001). Also, CT is the most precise followed by MRI, DXA and RTU. The latter is suitable for field work and can be used for farm animals of all sizes. While CT, RTU and MRI are able to present volume data, DXA is the only technology able to provide instant whole-body composition results without image manipulation (Scholz et al, 2015). Throughout this chapter, a brief description of selected imaging technologies will take place.
6
2.1- Computed tomography
The first computed tomography machine was created by Hounsfield in 1969, for medical purposes, but it was only from 1980 onwards that this technique became popular for testing, material analysis and identification of defects (De Chifre et al., 2014).
This is a non-destructive technique, which facilitates the determination of inner and outer characteristics (De Chifre et al., 2014). In addition, this method is less expensive than chemical analysis (Romvári et al., 2002).
The CT scanner uses ionizing radiation and measures the absorption of x-rays (De Chifre et al., 2014). It generates a cross-sectional image of the distribution of x-ray attenuation (Brodie, 1988). It allows multiple views of a specific location, providing 2-dimensional scans of the area (Mackey et al., 2008).The CT image is generated by the rotation of a circular frame around the anesthetised patient. The frame is called the gantry, it has an x-ray tube on one side and a sensor on the other side, which detects the x-rays sent by the tube that have passed through the patient (Mackey et al., 2008).
While the x-ray tube rotates around the patient, it sends a fan-shaped beam of x-rays from multiple sites (1000 or more). This process originates a “slice” of the imaged anatomy. The patient is moved further into the gantry to obtain the next slice. This process is repeated until the region of interest has been scanned (Mackey et al., 2008).
The scanner has an incorporated computer, which develops a map of the x-ray attenuating structures. It uses the x-ray dose collected by the x-ray sensors in the multiple positions. The structures are shown on a screen, represented in shades of grey (Mackey et al., 2008). The most attenuating structures such as bones show up almost white, while fat and gas, the least attenuating, appear closer to black (Mackey et al., 2008).
The CT can scan any surface, considering that its density and thickness do not interfere with the X-ray’s ability to penetrate the surfaces. It also provides high information density (De Chifre et al., 2014). On the other hand, there are some disadvantages such as the difficulty of scanning multi-material objects, the existence of measurement errors which reduce its efficiency, limitations on object dimension due to maximum penetrable material thickness (De Chifre et al., 2014). To overcome the difficulty of scanning multiple objects, Lambe et al used a specially designed fish system that allows the analysis of several fishes at a time (Figure 4). This approach optimises the use of the CT machine.
7
Figure 4: Example of multi-object CT scanning system with Tilapia (Bunger et al., 2014).
In addition, the use of CT on smaller animals like fish could have unfavourable effects due to the existing radiation (Wu et al., 2015). Through the years this technology has suffered multiple enhancements, including shorter scan times, improved resolution and image manipulation (Mackey et al., 2008). Nowadays, this procedure delivers more than 100 slices per rotation, whose minimal thickness has decreased from 5mm to < 0.5mm. Furthermore, the gantry size can reach up to 90cm allowing for bigger animals to be scanned (Scholz et al., 2015). The first application of CT in animal research was performed by Skjervold et al. (1981), for the prediction of body composition in pigs (Romvári et al., 2002).
This technology has been successfully used for diagnoses, prognoses and treatment plans in numerous animal species, when combined with other imaging techniques (Mackey et al., 2008). In spite of not being a standard procedure for studies in fish, Gjerde (1987) experimented CT scanning for breeding selection programs of rainbow trout. This study found a high correlation between the observed and predicted values of protein (0.68), water (0.88) and fat (0.89). Nevertheless, in order to predict the composition of the whole carcass, it was necessary more than one scan position (Romvári et al., 2002).
A study conducted by Rye (1991) to predict carcass composition of Atlantic salmon, estimated fillet fat and crude protein content with R2 = 0.88 and 0.87 accuracies respectively (Romvári et al., 2002).
8
2.2- Magnetic Resonance Imaging
Magnetic resonance imaging (MRI) is a technology that creates an image of the internal structure of an object (Flamig and Harms, 1994). It is a diagnostic device, which allows the visualisation of almost all body regions, initially created for human medicine (Baulain, 1997). In addition, MRI is a non-invasive and non-destructive technique (Kirtil et al., 2017).Therefore, this technology has contributed to an improved visualisation of anatomical and pathological alterations in vivo (Baulain, 1997). Magnetic resonance imaging is based on the properties of the hydrogen atoms. It relies on the principle that an atomic nucleus will absorb and reemit radio waves when placed in a magnetic field (Baulain, 1997).
The procedure generally starts with a localiser scan with the purpose of defining the position of the slice (Scholz et al., 2015). This imaging technique uses a strong magnetic field in order to align the magnetisation of atoms in the imaged object (Mathiassen et al., 2011). Since the nuclei have a tendency to align with external magnetic fields when placed under such conditions (Flamig and Harms, 1994). Then, the scanner detects the magnetic field created by the nuclei and records the data, which is used to produce an image of nucleus density of the scanned area (Mathiassen et al., 2011). To obtain important information for body composition measurements a quantitative analysis of the acquired image is required (Scholz et al., 2015). This technology is high-priced and has slow data acquisition process, which limits its utilisation. There is also the need to provide a stable environment, without temperature oscillation, vibrations and external magnetic fields (Kirtil et al., 2017).
This methodology has been used on fish (Brix et al., 2009; Collewet et al., 2013; Toussaint et al., 2005) for instance, for studies concerning fat in fish flesh (Wu et al., 2015). Considering this technique provides contrast between muscle and fat regardless of the colour of the flesh, its use is adequate for all types of fish (Collewet et al., 2013). In addition, MRI provides not only cross-sectional images of the whole fish, but also of fillets or processed fish products (Mathiassen et al., 2011). The Figure 5 shows an example of salmon fillet image after scanning in an MRI device.
9
Figure 5: MRI cartography of fat fractions (in g/g) on a salmon cutlet (Picaud et al., 2014).
2.3- Real-time ultrasound
Ultrasound is the name given to sound humans are not able to hear. It refers to sound waves with frequencies higher than 20 KHz, which corresponds to the upper limit of human hearing (Gupta et al., 2013).
In the late 1800’s the Curie brothers discovered the piezoelectric properties of some crystals. They acknowledged that the application of electricity to the crystals caused an alteration, responsible for the generation of sound with higher frequencies than 20 KHz (ultrasound). On the other hand, the application of ultrasound to the crystals turned mechanical energy into electricity (King, 2006).
RTU imaging has been used as a medical diagnostic tool since the 1940’s, but it was not until 1966 that it had its first veterinary application, for pregnancy diagnosis in sheep (King, 2006). The first applications of ultrasound as a medical tool used Amplitude or A-mode US. However,
10 Brightness or B-mode and Doppler have become more frequently used than A-mode (Medan and El-Aty, 2010). Since the first application of RTU in animals, it has undergone some changes regarding equipment quality, which along with the understanding of its advantages as an imaging method, led to a rising popularity for veterinary use (King, 2006). Ultrasound imaging can be used on humans and animals, for both clinical and research purposes. It is a real-time and non-damaging procedure, with inferior costs than other imaging techniques (Che et al., 2017).
This technology serves multiple purposes other than just diagnostic, including disease screening, herd management, clinical research, conservation projects and commercial services (King, 2006). RTU is an instrument that can perform a non-destructive evaluation of carcass and live animals (Gupta et al., 2013). It develops cross-sectional slices from several parts of the carcass without damaging it, allowing for an improved measurement of muscle area, fat and muscle depth. This technology can be used to determine body composition of all farm animals (Houghton and Turlington, 1992).
RTU allows an objective measurement of fat, lean and marbling in live animals. In the near future it could play an important role in determining the ideal time for slaughter, which would have a positive effect on carcass quality (Gupta et al., 2013). When the transducer is adequately positioned on the animal, the sound waves pass through the tissues and reflect off the edges between hide, fat and muscle. As soon as the probe captures the reflected sound waves, the US screen shows a cross-sectional image, which can be used to measure carcass traits (Houghton and Turlington, 1992).
The ultrasound is reflected when it hits the boundaries of tissues, having apparently no negative effects on the organism. Therefore it could replace X-ray in certain situations (Kane and Sternheim, 1988).This technique is usually pain-free and neither object nor technician are exposed to ionizing radiation (Che et al., 2017).
Images provided by the ultrasound machine have significant shadowing and noise, which make its analysis and registration more intricate than for CT or MRI. Therefore, multiple image pre-processing algorithms have been used on RTU images to help registration (Che et al., 2017). This type of imaging generates a continual stream of images, which are frequently registered all together for posterior evaluation (Che et al., 2017). This type of examination forms an almost immediate image, by using repeated scans. In order to update de information at a real-time, the image frame must be displayed in 33 ms or less (Silva, 2017).
This device has the advantage of being quite portable, which makes it suitable for field application. However, in comparison to MRI and CT, the ultrasound neither performs with the same precision nor does it give the same amount of information (Szabo et al., 1999).
11 According to several studies RTU is suitable to predict body composition traits in fish (Silva et al., 2016).
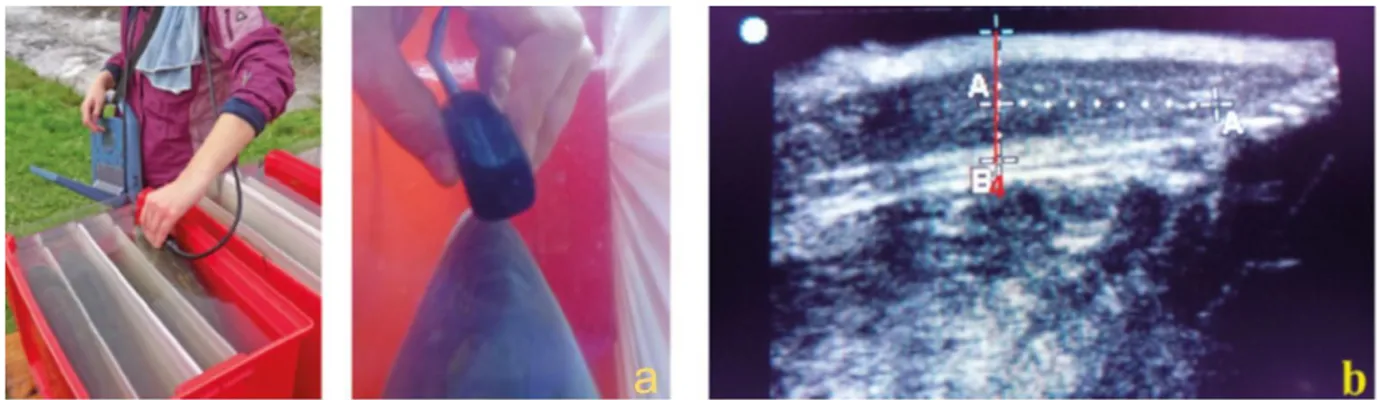
By performing the ultrasonography with fish in water, the animal stress is minimised and image acquisition becomes facilitated due to the fact that water acts as a coupling mechanism, between transducer and fish. The Figure 6 shows and example of application of RTU to carp fish. In addition, this technique has the advantage of being less expensive, time-saving and simpler to utilise. Thus, suggesting a possible relevance for use in fish body composition evaluation (Silva et al., 2016).
Figure 6: Images showing the use of ultrasound technology on live mirror carp (Cyprinus carpio) (a)
and RTU images showing the measurement of the back fat in the region of the dorsal fin (b) (Mass et al., 2015).
12
3- Materials and methods
3.1- Animals and experimental procedures
A group of tilapia (Oreochromis niloticus) was used for this experiment (n= 51, mean weight= 167.35 ± 56.098 g, range from 47.35 to 305.07 g) . The animals were randomly selected. The trial was carried out in the research facilities at the University of Trás-os-Montes and Alto Douro (Vila Real, Portugal).
The animals were divided into 3 groups and confined in fibreglass tanks (300 L volume capacity) supplied with a closed water recirculating system. All of which under the same environmental conditions (temperature: 23.9 ± 1.4 ºC, dissolved O2: 6.9 ± 0.3 mg/L, pH: 6.8 ± 0.1 and photoperiod: 16 h (light), 8 h (dark)).
A commercial extruded diet was provided twice a day (10.00 am and 3.00 pm), throughout the 30 days preceding this experiment. However, the animals were deprived of food for 24 hours before it.
The guidelines of EU directive number 2010/63/ EU regarding animal care were followed, and all RTU examinations were executed under the supervision of a highly trained scientist with accreditation by FELASA, category C.
3.2- Image acquisition
The scans were obtained with an Aloka SSD 500V real-time scanner (Tokyo, Japan) equipped with a linear array transducer of 7.5 MHz (UST-5512U-7.5; 38 mm, Tokyo, Japan). To obtain the images, the RTU scanner was connected to a video camera (Sony DCR-HC96E, Tokyo, Japan). The images were saved in TIFF format (720×480 pixels) for posterior analysis. Prior to scanning the animals were placed in a container with water (column: 3 cm) and phenoxyethanol (0.3 mL L -1), for about 60 to 90 seconds. Their live weight and body length was recorded, while under mild anaesthesia.
The RTU images were taken in cross-sectional slices, from the end of the operculum to the beginning of the caudal fin. In order to obtain proper images, the probe was positioned perpendicular to the fish’s major axis and slid along its length, in a craniocaudal movement. The transducer was placed in the same relative position for every animal, depending on its size. Thus, the cross-sectional locations were similar among individuals.
A gel standoff was placed between the transducer and fish, which is used not only to minimise tissue distortions but also to provide near field visualisation. Furthermore, the gel standoff is
13 responsible for reflecting the curved shape of the fish in RTU images, allowing for better tissue identification and posterior measurements during image analysis (Figure 7).
Figure 7: Example of a RTU image of the dorsal fillet section.
3.3- Dissection and volume determination
After completion of the recordings, the animals were killed by phenoxyethanol overdose (500 gm L-1). Then, the right dorsal fillet of each fish was cautiously dissected, in the interest of having a standardised extraction procedure (Figure 8).
14
.
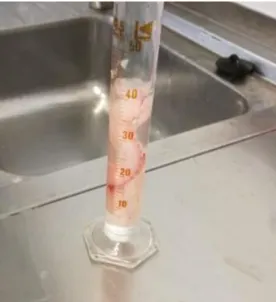
The fillets were dissected in muscle and skin, and their weight and length were recorded. For fillet volume determination it was followed a similar procedure as described by Silva et al. (2010). Briefly, the fillet volume was determined according to the Archimedes' principle. The fillets were submerged in water and the water displaced by this action was measured. For this procedure a graduated cylinder glass was used (Figure 9).
Figure 9: Graduated glass for fillet volume determination.
3.4. RTU fillet volume
The RTU fillet volume was calculated using the Cavalieri principle and following the Silva et al. (2010) procedure. Briefly, the fillet muscle volume was calculated by multiplying the dorsal fillet areas obtained by RTU by the slice lengths (Figure 10). The dorsal fillet area was determined using Fiji software. The RTU fillet weight was determined taking into account the value of 1.0798 g/cm3 for tilapia fish muscle specific density.
All samples were stored in labelled plastic bags and frozen at -20 ºC for posterior chemical analysis.
15
Figure 10: Example of a tilapia fish image with arrows indicating the RTU image capture points and
the respective RTU images.
3.5- Statistical analysis
The data were subjected to descriptive statistics and to correlation and regression analysis to study relationships between RTU fillet volume and the measured fillet volume. The model was evaluated based on the determination of the coefficient (R2) and the residual standard deviation (RSD). All analyses were performed with JMP-SAS software (v.13; JMP-SAS Institute Inc. Cary, NC).
16
4- Results and discussion
Descriptive statistics for fish weight, fillet weight and volume and RTU fillet weight and volume are presented in Table 1.
Table 1: Mean, standard deviation (sd), minimum, maximum and coefficient of variation (CV)
for fish weight, fillet measurements (volume and weight) and RTU fillet measurements (volume and weight), (n=51)
Fish traits Mean sd Minimum Maximum CV (%)
Fish weight (g) 167.20 57.81 47.35 305.07 34.57
Fillet volume (cm3) 16.49 6.39 6.00 30.50 38.75
Fillet weight (g) 17.70 6.91 5.72 32.80 39.03
RTU Fillet volume (cm3) 16.68 6.13 6.00 28.70 36.76
RTU Fillet weight (g) 18.01 6.62 6.48 30.99 36.75
Fish weight presented a range of variation below the tilapia’s European target market weight, which is over 600 g (Rutten et al., 2005). Nevertheless, the information reported herein is perfectly usable for heavier fish. Fillet volume and fillet weight, both determined and predicted by RTU, exhibit a CV close to those of fish weight (35 to 39%).
The correlation analysis between fillet weight and volume and the RTU equivalent measurements is significant (r ranged between 0.94 and 0.96; P<0.001).
The relationship between determined volume and RTU volume is presented in Figure 11. The linear model can explain 89% of the variation. These results are aligned with other published works in fish (Silva et al., 2010), as well as in other species (Silva et al., 2007; Silva and Cadavez, 2012) which reported a coefficient of determination over 0.8 to predict muscle volume with RTU.
17
Figure 11: Relationship between RTU fillet volume and determined fillet volume (R2=0.89; RSD=2.14
cm3).
A previous study by Bosworth et al. (2001), whose experiment was a starting point for the use of US for body composition determination in fish, showed high correlations among the US muscle measurements and dissected muscle measurements (r = 0.84 to 0.94, P < 0.001). Concluding that US imaging could be used for the in vivo prediction of carcass traits in American catfish (Ictalurus punctatus). These techniques were also applied by Silva et al. (2016), who found a high correlation among RTU measurements and skin fat, fillet muscle fat and whole body fat (0.815 to 0.922, P< 0.01) in senegalese sole (Solea senegalensis). The results found in the present work are also in line with other studies of prediction of carcass or fish meat characteristics using different techniques. In fact, comprehensive studies using image techniques such as CT (Romvári et al., 2002; Hancz et al., 2003a; Kolstad et al., 2004), or MRI (Collewet et al., 2001, 2013; Wu et al., 2015 ) show the ability of these techniques to accurately predict (R2> 0.80) fish body composition traits.
From a practical point of view, the time taken to acquire and analyse data is critical. Actually, this is a concern of several authors using RTU (Maas et al., 2015, Silva et al., 2016), the CT (Romvári et al., 2002; Hancz et al., 2003a, 2003b) as well as the MRI (Veliyin et al., 2005; Wu et al., 2015) when the research aims to predict fish composition traits. To minimise the time of examination Maas et al. (2015) developed a system where various fishes were scanned at the same time using RTU, while Bunger et al. (2014), created a method for examination of several fishes with CT.
Although the images were recorded in video, which reduced significantly the overall time of examination, this subject should be given more attention in future works with RTU.
18
5- Conclusion
The results obtained in this study show that non-invasive and non-destructive techniques are reasonable alternatives to slaughter, for body evaluation in live fish. The RTU and image analysis methodology was able to assess effectively fillet volume, which was highly related to the determined fillet volume. This technology is suitable for commercial application, due to its portability and lower costs. Additionally, it is fast, reliable and does not require highly trained staff. Also, the obtained results suggest the RTU and image analysis is a useful non-destructive and non-invasive method for fillet volume evaluation in Oreochromis niloticus. Since the slightest improvement in fillet yield can have a tremendous impact throughout the chain, this methodology could be an advantageous opportunity for selection programs and rearing facilities. Additional research is needed in a broader fish weight and in a larger sample. Also a high frequency probe will be tested.
19
6- References
Akdag, F., Teke, B., Meral, Y., Arslan, S., & Ugurlu, M. (2015). Prediction of carcass composition by ultrasonic measurement and the effect of region and age on ultrasonic measurements. Small Ruminant Research, 133, 82-87.
Alsaggaf, M. S., Moussa, S. H., & Tayel, A. A. (2017). Application of fungal chitosan incorporated with pomegranate peel extract as edible coating for microbiological, chemical and sensorial quality enhancement of Nile tilapia fillets. International Journal of Biological Macromolecules, 99, 499-505.
Baulain, U. (1997). Magnetic resonance imaging for the in vivo determination of body composition in animal science. Computers and Electronics in Agriculture, 17, 189-203. Bosworth, B. G., Holland, M., & Brazil, B. L. (2001). Evaluation of ultrasound imagery and body
shape to predict carcass and fillet yield in farm-raised catfish. Journal of Animal Science, 79, 1483-1490.
Bunger, L., Clelland, N., Moore, K., McLean, K. A., Kongsro, J., & Lambe, N. R. (2014). Integrating computed tomography (CT) into commercial sheep breeding in the UK: cost and value. In FAIM Farm Animal Imaging, Copenhagen 2014. SRUC, Edinburgh. Brix, O., Apablaza, P., Baker, A., Taxt, T., & Grüner, R. (2009). Chemical shift based MR
imaging and gas chromatography for quantification and localization of fat in Atlantic mackerel. Journal of Experimental Marine Biology and Ecology, 376, 68-75.
Brodie, D.A (1988). Techniques of measurement of body composition Part I.Sports Medicine, 5, 11-40.
Che, C., Mathai, T. S., & Galeotti, J. (2017). Ultrasound registration: a review. Methods, 115, 128-143.
Côa, F., de Medeiros, A. M. Z., & Barbieri, E. (2017). Record of nile tilapia in the Mandira River, Cananéia, São Paulo State. Boletim do Instituto de Pesca, 43: 87-91.
Collewet, G., Bugeon, J., Idier, J., Quellec, S., Quittet, B., Cambert, M., & Haffray, P. (2013). Rapid quantification of muscle fat content and subcutaneous adipose tissue in fish using MRI. Food Chemistry, 138, 2008-2015.
Collewet, G., Toussaint, C., Davenel, A., Akoka, S., Médale, F., Fauconneau, B., Haffray, P., (2001). Magnetic resonance imaging as a tool to quantify the adiposity distribution in fish. In: Webb, G.A., Belton, P.S., Gil, A.M., Delgadillo, I. (Eds.), Magnetic Resonance
20 in Food Science. The Royal Society of Chemistry, Cambridge, pp. 252–257.
Dai, Q., Cheng, J. H., Sun, D. W., & Zeng, X. A. (2014). Potential of hyperspectral imaging for non-invasive determination of mechanical properties of prawn (Metapenaeus ensis). Journal of Food Engineering, 136, 64-72.
Damez, J. L., & Clerjon, S. (2013). Quantifying and predicting meat and meat products quality attributes using electromagnetic waves: An overview. Meat Science, 95, 879-896. Davidson, J. W., Kenney, P. B., Manor, M., Good, C. M., Weber, G. M., Aussanasuwannakul,
A., & Summerfelt, S. T. (2014). Growth performance, fillet quality, and reproductive maturity of Rainbow Trout (Oncorhynchus mykiss) cultured to 5 kilograms within freshwater recirculating systems. Journal of Aquaculture Research & Development, 5, 1. De Chiffre, L., Carmignato, S., Kruth, J. P., Schmitt, R., & Weckenmann, A. (2014). Industrial applications of computed tomography. CIRP Annals-Manufacturing Technology, 63, 655-677.
Ellis, K. J. (2001). Selected body composition methods can be used in field studies. The Journal of Nutrition, 131, 1589S-1595S.
FAO Fisheries and Aquaculture Department. (2005). Oreochromis niloticus. Cultured Aquatic
Species Information Program. Retrieved from:
http://www.fao.org/fishery/culturedspecies/Oreochromis_niloticus/en
FAO Fisheries and Aquaculture Department. (2016). Utilization and trade. Retrieved from: http://www.fao.org/fishery/utilization_trade/en
Fitzsimmons, K. (2013). Latest trends in tilapia production and market worldwide. World Aquaculture Society, Rio de Janeiro.
Flamig, D. P., & Harms, S. E. (1994). U.S. Patent No. 5,304,931. Washington, DC: U.S. Patent and Trademark Office.
Gjerde, B. (1987). Predicting carcass composition of rainbow trout by computerized tomography. Journal of Animal Breeding and Genetics, 104, 121-136.
Gjerde, B., Mengistu, S. B., Ødegård, J., Johansen, H., & Altamirano, D. S. (2012). Quantitative genetics of body weight, fillet weight and fillet yield in Nile tilapia (Oreochromis niloticus). Aquaculture, 342, 117-124.
Grassi, S., Casiraghi, E., & Alamprese, C. (2018). Fish fillet authentication by image analysis. Journal of Food Engineering, 234, 16-23.
21 Gupta, M. V., & Acosta, B. O. (2004). A review of global tilapia farming practices. Aquaculture
Asia, 9, 7-12.
Gupta, S., Kumar, A., Kumar, S., Bhat, Z. F., Hakeem, H. R., & Abrol, A. P. S. (2013). Recent trends in carcass evaluation techniques-a review. Journal Meat. Science Technology, 1, 50-55.
Hancz, C., Romvari, R., Horn, P., (2003b). Prediction of carcass quality traits of common carp by X-ray tomography. Israel Journal Aquaculture Bamidgeh, 51, 61–68.
Hancz, C., Romvári, R., Szabo, A., Molnár, T., Magyary, I., Horn, P., (2003a). Measurement of total body composition changes of common carp by computer tomography. Aquaculture Research, 34, 1–7.
Hermann Leonhardt, J., Caetano Filho, M., Frossard, H., & Machado Moreno, A. (2006). Características morfométricas, rendimento e composição do filé de tilápia do Nilo, Oreochromis niloticus, da linhagem tailandesa, local e do cruzamento de ambas. Semina: Ciências Agrárias, 27.
Hogreve, F. (1938). Ausbau eines neuen Forschungsweges zur Bestimmung der Fettwüchsigkeit und Fettleistung in verschiedenen Mastabschnitten beim lebenden Schwein verschiedener Rassenzugehörigkeit. Zeitschrift für Züchtung. Reihe B, Tierzüchtung und Züchtungsbiologie einschließlich Tierernährung, 40, 377-395.
Houghton, P. L., & Turlington, L. M. (1992). Application of ultrasound for feeding and finishing animals: A review. Journal of Animal Science, 70, 930-941.
Kane, J. W., & Sternheim, M. M. (1988). Physics. (3rd ed). New York: John Wiley & Sons. King, A. M. (2006). Development, advances and applications of diagnostic ultrasound in
animals. The Veterinary Journal, 171, 408-420.
Kirtil, E., Cikrikci, S., McCarthy, M. J., & Oztop, M. H. (2017). Recent advances in time domain NMR & MRI sensors and their food applications. Current Opinion in Food Science, 17, 9-15.
Knap, P. W., & Kause, A. (2018). Phenotyping for genetic improvement of feed efficiency in fish: lessons from pig breeding. Frontiers in Genetics, 9, 184.
Kolstad, K., Vegusdal, A., Baeverfjord, G., Einen, O., (2004). Quantification of fat deposits and fat distribution in Atlantic halibut (Hippoglossus hippoglossus L.) using computerized X-ray tomography (CT). Aquaculture 229, 255–264.
22 Kronacher, C., & Hogreve, F. (1936). Beiträge zur Kenntnis der Grundlagen der Beckenformen bei verschiedenen Schweinerassen, gewonnen an Hand röntgenologischer Studien. Zeitschrift für Züchtung. Reihe B, Tierzüchtung und Züchtungsbiologie einschließlich Tierernährung, 35, 161-190.
Kušec, G., Scholz, A. M., Baulain, U., Kušec, I. D., & Bernau, M. (2016). Non-Invasive Techniques for exact Phenotypic Assessment of Carcass Composition and Tissue growth in Domestic Animals. Acta Agriculturae Slovenica, 5, 12-17.
Ma, J. T. D. Y., Rye, M., Wang, Y. X., Bentsen, H. B., & Gjedrem, T. (2012). Genetic improvement of tilapias in China: Genetic parameters and selection responses in fillet traits of Nile tilapia (Oreochromis niloticus) after six generations of multi-trait selection for growth and fillet yield. Aquaculture, 366, 67-75.
Maas, P., Grzegrzółka, B., Kreß, P., Oberle, M., Gareis, M. & Kremer, P.V. (2015). In vivo phenotyping of carcass traits in mirror carp (Cyprinus carpio) using ultrasound, microwave and linear measurements. In FAIM Farm Animal Imaging, Edinburgh 2015. SRUC, Edinburgh.
Mackey, E. B., Hernandez-Divers, S. J., Holland, M., & Frank, P. (2008). Clinical technique: application of computed tomography in zoological medicine. Journal of Exotic Pet Medicine, 17, 198-209.
Mathiassen, J. R., Misimi, E., Bondø, M., Veliyulin, E., & Østvik, S. O. (2011). Trends in application of imaging technologies to inspection of fish and fish products. Trends in Food Science & Technology, 22, 257-275.
Medan, M. S., & El-Aty, A. A. (2010). Advances in ultrasonography and its applications in domestic ruminants and other farm animals reproduction. Journal of Advanced Research, 1, 123-128.
Nguyen, N. H., Ponzoni, R. W., Abu-Bakar, K. R., Hamzah, A., Khaw, H. L., & Yee, H. Y. (2010). Correlated response in fillet weight and yield to selection for increased harvest weight in genetically improved farmed tilapia (GIFT strain), Oreochromis niloticus. Aquaculture, 305, 1-5.
Picaud, J., Collewet, G. & Idier, J. (2014). Quantification of intramuscular fat in fish by MRI. In FAIM Farm Animal Imaging, Copenhagen 2014. SRUC, Edinburgh.
Rasmussen, R. S. (2001). Quality of farmed salmonids with emphasis on proximate composition, yield and sensory characteristics. Aquaculture Research, 32, 767-786. Romvári, R., Hancz, C. S., Petrási, Z. S., Molnár, T., & Horn, P. (2002). Non-invasive
measurement of fillet composition of four freshwater fish species by computer tomography. Aquaculture International, 10, 231-240.
23 Rutten, M. J., Komen, H., & Bovenhuis, H. (2005). Longitudinal genetic analysis of Nile tilapia (Oreochromis niloticus L.) body weight using a random regression model. Aquaculture, 246, 101-113.
Scholz, A. M., Bünger, L., Kongsro, J., Baulain, U., & Mitchell, A. D. (2015). Non-invasive methods for the determination of body and carcass composition in livestock: dual-energy X-ray absorptiometry, computed tomography, magnetic resonance imaging and ultrasound: invited review. Animal 9, 1250-1264.
Silva, S. R. (2017). Use of ultrasonographic examination for in vivo evaluation of body composition and for prediction of carcass quality of sheep. Small Ruminant Research, 152, 144-157.
Silva, S. R., & Cadavez, V. P. (2012). Real-time ultrasound (RTU) imaging methods for quality control of meats. In Computer vision technology in the food and beverage industries. Woodhead Publishing, Cambridge, UK, pp. 277-329.
Silva, S. R., Guedes, C. M., Loureiro, N., Mena, E., Dias, J., & Rema, P. (2010). Prediction in vivo of the fillet volume in senegalese sole (solea senegalensis) by multiple consecutive transverse real-time ultrasonography images. In Proceedings of the 6th International Conference on Simulation and Modelling in the Food and Bio-Industry, Bragança, Portugal, pp. 219-223.
Silva, S. R., Guedes, C. M., Rema, P., Batista, A. C., Rodrigues, V., Loureiro, N., & Dias, J. (2016). In vivo assessment of fat composition in Senegalese sole (Solea senegalensis) by real-time ultrasonography and image analysis of subcutaneous fat. Aquaculture, 456, 76-82.
Silva, S. R., Guedes, C. M., Santos, V. A., Lourenço, A. L., Azevedo, J. M. T., & Dias-da-Silva, A. (2007). Sheep carcass composition estimated from Longissimus thoracis et lumborum muscle volume measured by in vivo real-time ultrasonography. Meat Science, 77, 654-661.
Sitaula, M. (2013). Measuring the fat content in intestine of atlantic salmon by using computerized tomography. (Master's thesis) Norwegian University of Life Sciences, Ås, Norway.
Skjervold, H., Grønseth, K., Vangen, O., & Evensen, A. (1981). In vivo estimation of body composition by computerized tomography. Zeitschrift für Tierzüchtung und Züchtungsbiologie, 98, 77-79.
24 Szabo, C., Babinszky, L., Verstegen, M. W. A., Vangen, O., Jansman, A. J. M., & Kanis, E. (1999). The application of digital imaging techniques in the in vivo estimation of the body composition of pigs: a review. Livestock Science, 60, 1-11.
Toussaint, C., Fauconneau, B., Medale, F., Collewet, G., Akoka, S., Haffray, P., & Davenel, A. (2005). Description of the heterogeneity of lipid distribution in the flesh of brown trout (Salmo trutta) by MR imaging. Aquaculture, 243, 255-267.
Turra, E. M., de Oliveira, D. A. A., Valente, B. D., de Alencar Teixeira, E., de Assis Prado, S., de Alvarenga, É. R., & e Silva, M. D. A. (2012). Longitudinal genetic analyses of fillet traits in Nile tilapia Oreochromis niloticus. Aquaculture, 356, 381-390.
Veliyulin, E., Van der Zwaag, C., Burk, W. and Erikson, U. (2005), In vivo determination of fat content in Atlantic salmon (Salmo salar) with a mobile NMR spectrometer. Journal Science Food Agriculture, 85, 1299-1304.
Wu, J. L., Zhang, J. L., Du, X. X., Shen, Y. J., Lao, X., Zhang, M. L., Chen, L. Q., Du, Z. Y. (2015). Evaluation of the distribution of adipose tissues in fish using magnetic resonance imaging (MRI). Aquaculture, 448, 112-122.
Yuan, Y., Yuan, Y., Dai, Y., & Gong, Y. (2017). Economic profitability of tilapia farming in China. Aquaculture International, 25, 1253-1264.