C
ATARINA DAR
OCHAC
RUZEIROEnvironmental monitoring and molecular mechanistic
insights on pesticides in waters and in the bivalve
Scrobicularia plana, from Mondego and Tagus estuaries
and Ria Formosa Lagoon
Tese de Candidatura ao grau de Doutor em Ciências Biomédicas submetida ao Instituto de Ciências Biomédicas Abel Salazar da Universidade do Porto.
Orientador – Eduardo Jorge Sousa da Rocha Categoria – Professor Catedrático
Afiliação – Instituto de Ciências Biomédicas Abel Salazar da Universidade do Porto
Coorientadora – Maria João Tomé da Rocha Categoria – Professor Auxiliar
Afiliação – Instituto de Ciências Biomédicas Abel Salazar da Universidade do Porto
Coorientador – Luís Filipe Costa Castro Categoria – Investigador Auxiliar
Afiliação – Centro Interdisciplinar de Investigação Marinha e Ambiental
T
ABLE OFC
ONTENTSAUTHOR STATEMENT ………..……….…………..…. ii
AGRADECIMENTOS………..………….…………...…. iv
RESUMO………..…….….…………. viii
ABSTRACT………..………....………... xii
CHAPTER 1 Background and goals... 1
CHAPTER 2 Uncovering seasonal patterns of 56 pesticides in surface coastal waters of the Ria Formosa lagoon (Portugal), us-ing a GC–MS method...…….………... 81
CHAPTER 3 Occurrence and seasonal loads of pesticides in surface water and suspended particulate matter from a wetland of worldwide interest — the Ria Formosa Lagoon, Portu-gal……….……….……….. 103
CHAPTER 4 Environmental assessment of pesticides in the Mondego River Estuary (Portugal)... 129
CHAPTER 5 Seasonal-spatial survey of pesticides in the most relevant estuary of the Iberian Peninsula — The Tagus Riv-er……….…....……… 151
CHAPTER 6 Development and application of a QuEChERS-based ex-traction method for the analysis of 55 pesticides in the bivalve Scrobicularia plana by GC-MS/MS ……..………... 185
CHAPTER 7 Three-tiered matrix quantification (in aqueous phase, suspended particulate matter, and in bivalve soft tis-sues) of pesticides in the estuary of the Iberian Peninsula longest river — The Tagus………...…… 229
CHAPTER 8 A Mollusk VDR/PXR/CAR-like (NR1J) nuclear receptor provides insight into ancient detoxification mechanisms ……….. 275
A
UTHORS
TATEMENTThis Thesis includes six articles published in international journals, which are presented as Chapter 2-6, and 8 according to the references:
Cruzeiro, C., Rocha, E., Pardal, M.Â., Rocha, M.J., 2015. Uncovering sea-sonal patterns of 56 pesticides in surface coastal waters of the Ria Formosa lagoon (Portugal), using a GC-MS method. International Jour-nal of Environmental AJour-nalytical Chemistry 95, 1370-1384. doi:10. 1080/03067319.2015.1100724.
Cruzeiro, C., Pardal, M.Â., Rocha, E., Rocha, M., 2015. Occurrence and sea-sonal loads of pesticides in surface water and suspended particulate matter from a wetland of worldwide interest—the Ria Formosa La-goon, Portugal. Environmental Monitoring Assessment 187, 1-21. doi:10. 1007/s10661-015-4824-8.
Cruzeiro, C., Rocha, E., Pardal, M.Â., Rocha, M.J., 2016. Environmental as-sessment of pesticides in the Mondego River Estuary (Portugal). Ma-rine Pollution Bulletin 103, 240-246. doi:http://dx.doi.org/10.1016/ j.marpolbul.2015.12.013.
Cruzeiro, C., Rocha, E., Pardal, M.Â., Rocha, M.J., 2016. Seasonal-spatial survey of pesticides in the most significant estuary of the Iberian Pen-insula—The Tagus River Estuary. Journal of Cleaner Production. doi: 10.1016/j.jclepro.2016.03.005
Cruzeiro, C., Rodrigues-Oliveira, N., Velhote, S., Pardal, M.Â., Rocha, E., Rocha, M.J., 2016. Development and application of a QuEChERS–based extraction method for the analysis of 55 pesticides in the bivalve
Scrobicularia plana by GC–MS/MS. Analytical and Bionalytical
Cruzeiro, C., Lopes-Marques, M., Ruivo, R., Rodrigues-Oliveira, N., Santos, M.M., Rocha, M.J., Rocha, E., Castro, L.F.C., 2016. A Mollusk VDR/PXR/CAR-like (NR1J) nuclear receptor provides insight into an-cient detoxification mechanisms. Aquatic Toxicology 174, 61-69. doi: http://dx.doi.org/ 10.1016/j.aquatox.2016.02.007.
Chapter 7 is under submission to an international journal, formatted as presented here.
All the works that contributed to this Thesis were made by the candidate in close cooperation/co-authorship with supervisors and other researchers. The conception and full draft of the Introduction and the Final Remarks were the sole responsibility of the candidate, being subject to revision by the supervising team. In all other Chapters, the candidate made substantial contributions to conception, design, data acquisition, and data analysis and interpretation. The candidate drafted all Thesis Chapter and approved their final versions.
A
GRADECIMENTOSAo Professor Doutor Eduardo Rocha pela sua confiança e dedicação ao longo desta etapa que me fez crescer tanto a nível pessoal como profissional. Sempre acreditou no meu entusiamo acompanhando de perto o crescimento e desenvolvimento desta Tese. Sempre pronto para os meus surtos de dúvidas, com boa disposição, amizade e profissionalismo!
À Professora Doutora Maria João Rocha, um agradecimento especial pelo seu carinho, amizade, dedicação, disponibilidade e paciência durante estes anos. Sem dúvida, sem os seus conhecimentos eu não seria a pessoa que sou hoje.
Ao Professor Doutor Filipe Castro pelo seu arrojado espírito científico que me fez crescer e querer fazer mais e melhor. Sem dúvida, um excelente investigador e amigo que apostou no meu trabalho, levando-o a bom porto.
Não podia deixar de agradecer ao Professor Doutor Miguel Pardal, que sem a sua ajuda e colaboração teria sido inviável a realização destes trabalhos em tão larga escala. Um obrigada sincero e amigo de muitas horas de viagens por caminhos de Portugal, sempre com boa disposição e com muitos bons conselhos para me dar.
Agradeço também ao Instituto de Ciência Biomédicas Abel Salazar (ICBAS) e ao Centro Interdisciplinar de Investigação Marinha e Ambiental (CIIMAR) por terem sido a minha casa durante estes anos.
Um agradecimento especial à minha amiga de looonga data, Mónica pelo seu companheirismo, paciência, amizade e dedicação que teve para comigo durante estes anos (dentro e fora do CIIMAR) e que me ensinou o ABC da molecular! À Raquel pelo seu apoio, espírito crítico e amizade que me ajudaram a crescer e ver muitos aspetos da ciência com outros olhos; à Ivone pela sua boa disposição, ajuda (física e psicológica) e horas de conversa necessárias para a criação deste trabalho; um agradecimento especial à Alice pela sua calma e compreensão trazendo alguns momentos
irracionais para o lado da razão. Agradeço também à Nádia, que acompanhou o meu trabalho, resistindo ao meu temperamento e velocidade; à Elza que arregaçou as mangas quando foi preciso e que nunca desistiu mesmo quando os resultados não eram os melhores; à vizinha Maria João (MJ) que estava sempre lá para dúvidas existências e uns cafézitos à mistura; à Odete que me socorria sempre quando era necessário e pelas horas infindáveis na biblioteca que deram origem a esta Tese. Agradeço também à super equipa do BOGA–Hugo, Ricardo e Olga– que estavam sempre presentes quando eu precisava deles. Não poderia deixar de parte a Sofia, a Joana, o Pedro e a Emília que me acompanharam durante esta jornada; à Célia e Fernanda que estavam sempre prontas a ajudar acompanhadas sempre de boa disposição; à Paula pelo seu carinho, amizade e dedicação que tinha sempre uma palavra amiga naqueles momentos mais complicados; à Sukanlya (Koi) pela sua amizade e carinho que me ajudou a relativizar os meus problemas e ansiedades, sempre com o seu humor peculiar. À minha gêmea do Mundo da Ciência, Tânia que com a mesma genica me acompanhou durante estes anos apoiando-me e esclarecendo algumas (ou muitas?!) dúvidas existênciais, acompanhadas por alguns cappuccinos. Sem dúvida somos uma parelha imbatível!
Aos meus pais que foram os meus pilares durante todo o meu percurso e que sempre acreditaram no meu trabalho e garra para fazer aquilo que eu gosto. Aos meus avós, que estiveram desde os meus primeiros passos até à pessoa que sou hoje, mantendo sempre uma curiosidade constante e atenção por aquilo que eu faço; sempre me disseram que eu sou tanto Rocha como Cruzeiro e orgulho-me muito disso! À minha irmã Ana, que esteve sempre lá, nos bons e maus momentos, nos chás e cafés, nas noites no sofá e nas nossas conversas infindáveis; obrigada pela tua amizade e ajuda na edição desta Tese.
Ao Balázs, pelo seu verdadeiro amor e entusiasmo que me acompanhou durante estes anos; se esta Tese existe é porque acreditaste sempre em mim e no meu trabalho, estando sempre lá nas intermináveis horas de
Agradeço à FCT – Fundação para a Ciência e a Tecnologia pela concessão da bolsa de doutoramento (SFRH/BD/79305/2012), financiada por Fundo FSE através do Programa Operacional Potencial Humano. O trabalho de investigação foi financiado por Fundos FEDER através do Programa Operacional Factores de Competitividade – COMPETE e Programa Operacional Competitividade e Internacionalização - COMPETE2020 e por Fundos Nacionais através da FCT – Fundação para a Ciência e a Tecnologia no âmbito dos projetos PTDC/MAR/70436/2006 [FCOMP-01-0124.FEDER-7382], PTDC/MAR/105199/2009 (FCOMP-01-0124.FEDER-10620), EXPL/ MAR-EST/1540/2012 (FCOMP-01-0124.FEDER-29950), PEst-C/MAR/LA0015 /2013 e UID/Multi/04423/2013. O trabalho de investigação foi ainda financiado por Fundos FEDER através do Programa Operacional Regional do Norte - NORTE2020 no âmbito dos projetos de I&D&I INNOVMAR - Inovação e sustentabilidade na gestão e exploração de recursos marinhos (NORTE-01-0145-FEDER-000035, linha de investigação ECOSERVICES) e CORAL- Exploração sustentável do oceano (Norte-01-0145-FEDER-000036).
O principal objectivo desta Tese foi identificar e quantificar pesticidas de três sistemas estuarinos Portugueses, de forma a realizar um diagnóstico ambiental, tendo em conta os regulamentos Europeus, e estimar eventuais impactos nas cadeias tróficas. Devido à sua localização, os estuários e outros importantes sistemas aquáticos costeiros (como as rias) são sujeitos a concentrações significativas de contaminantes, provenientes de diversas atividades antropogénicas, criando uma “sopa tóxica” para a biota local; e até influenciar humanos. Esta Tese reporta concentrações de cinquenta e seis pesticidas, conforme avaliados em três ecossistemas e três matrizes, tendo em conta possiveis flutuações espaço-temporais.
Em 2010 e 2011 foram recolhidas amostras de águas da Ria Formosa e dos estuários dos Rio Mondego e Rio Tejo, abrangendo todas as estações do ano, de forma a realizar uma primeira avaliação nestes sistemas estuarinos. As amostras (500 mL) foram pré-concentradas 2500 vezes, por extração de fase sólida, e analizadas por cromatografia gasosa acoplada a espectrometria de massas (GC-MS). Foram quantificados quarenta e sete pesticidas na Ria Formosa, atingindo somas médias totais de 11000 ng/L; 17% dos compostos quantificados excederam os valores médios anuais de qualidade ambiental, para substâncias prioritárias e outros poluentes, definidos pela Diretiva Europeia 2013/39/EU. Foram quantificados quarenta e sete biocidas no estuário do Mondego e cinquenta e quatro no Tejo, atingindo montantes totais médios de 5750 ng/L e 2800 ng/L em cada ecossistema; comparando o total das concentrações médias com as normas de qualidade ambiental da Diretiva 2013/39/UE, 19% e 14% dos compostos estavam acima dos níveis europeus estabelecidos para as águas de transição.
Como em todas as situações se verificaram quantidades substanciais de pesticidas, sugerindo um impacto considerável, foi executada uma segunda campanha (2012-2013), para analisar com maior detalhe estes compostos, em três matrizes diferentes; duas delas — fase aquosa dissolvida (DAP) e material particulado em suspensão (SPM) — foram recolhidas de águas superficiais, enquanto a terceira visou o bivalve Scrobicularia plana, como modelo biológico para estudos ambientais. A espécie, como filtradora detritívora e séssil, é indicativa de padrões de bioacumulação locais que podem afetar níveis tróficos superiores, atingindo também os seres
Na Ria Formosa quantificaram-se quarenta e oito, trinta e um, e cinquenta e quatro pesticidas nas matrizes DAP, SPM, e bivalves, respetivamente. O perfil de contaminação entre matrizes foi marcado por somas totais médias de 1800 ng L (DAP), de 12,7 mg/kg (SPM), e 0,7 mg/kg (bivalves); várias amostras exibiram valores acima dos níveis da Diretiva 2013/39/UE.
No estuário do Rio Tejo foram quantificados dezanove pesticidas na matriz DAP, trinta e seis na matriz SPM, e cinquenta e três nas amostras de bivalves. Foram registados somas totais médias de 1750 ng/L, 22,3 mg/kg e 1,0 mg/kg, na matriz DAP, SPM, e nas amostras de bivalves. Considerando as médias anuais, 53% das amostras DAP e SPM e 64% das amostras de bivalves, excederam os níveis estabelecidos pela Directiva 2013/39/UE. Considerando os pesticidas detetados e quantificados procedeu-se ao cálculo de quocientes de risco teóricos onde foram estimados potenciais riscos para os organismos aquáticos, nomeadamente invertebrados.
Para entender melhor os mecanismos subjacentes à ação dos pesticidas em invertebrados, particularmente em bivalves, foram realizados estudos usando a S. plana. A função do receptor nuclear e a sua ligação a xenobióticos começou a ser estudada. O domínio de ligação ao ligando foi isolado pela primeira vez e identificado como NR1Jβ. Os ensaios de transactivação foram usados como uma ferramenta para a avaliação e comparação entre o receptor X do pregnano humano e o NR1Jβ da S. plana. Nesta primeira abordagem foram utilizados três compostos — dois pesticidas (esfenvalerato e triclosan), usando como composto de referência uma toxina natural (ácido ocadaico) — levando a diferentes respostas de transactivação. Os resultados indicam distintas potências de ligação e de eficácia, explicados tanto pela natureza e estrutura dos compostos-alvo como pelas concentrações testadas.
Em suma, desenvolveram-se metodologias analíticas eficazes que permitiram a identificação/quantificação de pesticidas em três grandes sistemas aquáticos costeiros portugueses, tendo em conta fatores espaciais e temporais, em três matrizes, estimando-se possíveis impactos dos poluentes. Os resultados mostram que a poluição por pesticidas existe e é bastante relevante. O trabalho subsequente iniciado por técnicas de biologia molecular
The main objective of this Thesis was to identify and quantify pesticides on three Portuguese brackish water systems, so to make an environmental diagnose of the situation, namely in view of European regulations, and to estimate eventual impacts across trophic levels. Because of their location, estuaries and other key costal water systems (like lagoons) are loaded with significant amount of contaminants, from diverse anthropogenic activities, creating a “toxic soup” for local biota; humans can be struck too. The Thesis portrays the concentrations of fifty-six pesticides in three ecosystems and matrices, with consideration to possible spatial and temporal fluctuations.
Water samples from Ria Formosa Lagoon and from Mondego and Tagus River estuaries were collected during 2010-2011, covering all year seasons, to evaluate the primary status of these estuarine systems. Samples (500 mL) were pre-concentrated 2500 times by solid phase extraction and analyzed by gas chromatography-mass spectrometry (GC-MS). Forty-seven pesticides were quantified at Ria Formosa Lagoon, attaining total average sums of 11000 ng/L; 17% of the quantified compounds exceeded the annual average envi-ronmental quality standards (EQS) set for priority substances and certain oth-er pollutants, as defined by the European Directive 2013/39/EU. In the Mondego and Tagus River estuaries, forty-seven and fifty-four biocides were quantified, respectively, reaching total average sums of 5750 ng/L and 2800 ng/L in each aquatic system; comparing the total average concentrations with the EQS set by the 2013/39/EU Directive, 19% and 14% of the compounds were above the European levels established for transitional waters.
Because all scenarios demonstrated the presence of substantial amounts of pesticides and were strongly suggestive of impacts, a second campaign (2013-2013) was conducted, to analyze these compounds more in-depth, in three different matrices; two of them — dissolved aqueous phase (DAP) and suspended particulate matter (SPM) — were collected from surface waters, while the third one applied the bivalve Scrobicularia plana as a biologic model for the environmental studies. The species, as a surface deposit and suspension feeder and sessile animal, can indicate local bioaccumulation patterns that may affect higher trophic levels, up to humans, by in/direct consumption.
Analyses at Ria Formosa Lagoon quantified forty-eight, thirty-one, and fifty-four pesticides in DAP, SPM, and bivalves matrices, respectively. The contamination profile among matrices was marked by total average sums of 1800 ng/L (DAP), 12.7 mg/kg (SPM), and 0.7 mg/kg (bivalves), respec-tively; with several samples exhibiting loads above the concentrations de-fined by the 2013/39/EU Directive.
In the Tagus River estuary, nineteen pesticides were quantified in DAP, thirty six in SPM, and fifty three in bivalve matrices. Total average sums of 1750 ng/L, 22.3 mg/kg, and 1.0 mg/kg were registered for DAP, SPM, and bivalve samples. Considering annual averages, 53% of the DAP and SPM samples and 64% of bivalve samples exceeded the defined levels estab-lished by the 2013/39/EU Directive. Considering the detected pesticides and their amounts, theoretical risk quotients pointed out potential hazards for aquatic organisms, mainly for invertebrates.
To better understand the mechanisms underlying the pesticide action in invertebrates, particularly in bivalves, further studies were carried out, us-ing S. plana. The nuclear receptor function and its connection to xenobiot-ics started to be studied. The ligand-binding domain was first isolated and identified as NR1Jβ. Transactivation assays were applied as a tool for eval-uation and comparison between the human pregnane X receptor and the NR1Jβ. In this first approach three compounds — two pesticides (esfen-varelate and triclosan) using as reference compound the natural toxin (okadaic acid) — were used, leading to different transactivation responses. The results indicate distinct ligand potency and efficacy, linked closely to the nature and structure of the target compounds and to their tested con-centrations.
In sum, the development of effective analytical methodologies allowed the identification/quantification of pesticides in three major Portuguese aquatic costal systems, considering spatial and temporal factors, in various matrices, and estimation of their potential impacts. Data show that pesti-cide pollution of importance exists. Going a step further, molecular work
I.
Persistent Organic Pollutants (POPs) – General Review
Since the industrial revolution and continuing with after World War II in-dustrial advancements and economic growth, the production of chemicals have continuously enlarged; more recently, it was found that solely in the European market approximately 100 000 substances exist, from which 30 000 have an annual production over 1 tonne [1, 2]. The chemical industry employs over 1.2 million people and contributed to the economy with 527€ billion in 2013 [3]. In 2012, from the total worldwide chemical sales, Europe represented 22% (673€ billion), the entire Asia 55% (1 724€ billion), North and South America 21% (670€ billion), and the rest of the world 2% (60€ billion) [4].
The marketed substances are used for various purposes from the indus-trial area and disease control, through crop production until different con-sumer needs [2]. However, some of these compounds brought negative un-expected effects to the environment and human health [5-8]. Due to their chemical’ nature, many of these organic substances are persistent and sub-ject to accumulation in organisms, while having characteristics prone to im-pose noxious effects to human health [7, 9]. According to their molecular structure and atoms’ nature, the substances present different properties [10], being some of them considered Persistent, Bioaccumulative and Toxic substances (PBTs) [11].
The Persistent Organic Pollutants (POPs) are defined as a subclass of PBTs with the following characteristics: (i) long life-span in soil, air and biota; (ii) easily transported by air, water and migratory species; (iii) toxic; and that (iv) bio-accumulate in terrestrial and aquatic ecosystems through the food chain, causing adverse environmental and human health effects [12]. POPs are carbon-containing and often halogenated chemical substances, charac-terized by low water solubility (hydrophobicity) and high lipid solubility (lip-ophilicity), leading to their bioaccumulation in fatty tissues [13]. Due to these characteristics and cross-border problems, international initiatives
have been taken to promote an effective regulation and management of POP compounds.
The United Nations Economic Commission for Europe (UNECE), funded at 1947, adopted in 1979 at the Convention on Long Range Transport of Air Pollution (CLRTAP) identifies the general principles for international cooper-ation on air pollution abatement and provides an institutional framework, bringing together science and policy [14]. However, only in 1990 the Exec-utive Body of the Convention agreed to establish a task force on POPs. A work plan was adopted in 1995 and a list of selected substances was created taking in consideration the following criteria:
1. Evidence of environmental persistence (compounds with low vapour pressure (P), or showing more than 2 days of half-life in the atmos-phere), and low biodegradability (i.e., 30% of the compound still exist after 28 days of its release or present in remote areas);
2. Prioritization scoring based on bioconcentration factors or octanol-wa-ter partition coefficient (KOW) and mammalian or aquatic toxicology;
3. Risk assessment.
From an initial list of 107 substances, 16 substances were identified for initial inclusion in the protocol (11 pesticides, 2 industrial products and 3 unintentional by-products; see Table 1) [11].
Subsequently, the Intergovernmental Forum on Chemical Safety (IFCS) and the International Programme on Chemical Safety (IPCS) prepared an assess-ment of the 12 worst POPs, known as the “dirty dozen”. In May 2001, the Stockholm Convention on POPs — where the United States of America to-gether with more 90 countries — agreed to reduce or eliminate the produc-tion, use, and/or release of 12 key POPs [15].
On 18 December 2009, seven more substances (see Table 1) were in-cluded and the obligations for DDT, heptachlor, hexachlorobenzene and PCBs, as well as the emission limit values (ELVs) from waste incineration were revised [16, 17].
Table 1: List of the priority substances (POPs) that have to be eliminated or substantially reduced.
Industrial products
Hexabromobiphenyl a
Polychlorinated biphenyls (PCBs) a,b
Octabromodiphenyl ether (OBDE) d
Pentabromodiphenyl ether d
Perfluorooctane sulfonates (PFOS) d
Polychlorinated naphthalenes (PCN) d
Short-chain chlorinated paraffins (SCCPs) d,e
Pesticides Aldrin a Chlordane a Chlordecone a Dieldrin a Endrin a Heptachlor a Mirex a Toxaphene a DDT a,b Hexachlorocyclohexane (HCH) a,b Hexachlorbenzene (HCB) a,c Pentachlorobenzene (PeCB) d
Unintentional by-products of combustion and industrial processes
Polycyclic aromatic hydrocarbons (PAHs) c
Polychlorinated dibenzo-p-dioxins (PCDDs) c
Polychlorinated dibenzofurans (PCDFs) c
Hexachlorobutadiene (HCBD) d
a-substances scheduled for elimination b-substances scheduled for restriction use c-substances scheduled for emission reduction by the use of best available technology (BAT) d-substances included on the protocol ECE/EB.AIR/2009/14 e-substances that meet the EPA definition
Focusing on pesticides, the main goal of this review is to compile a sig-nificant amount of representative data, mainly from Europe, and discuss the published results taking in consideration factors, such as matrix, pesticide category, and the European Directive limits. The matrices herein discussed involve total or partially aquatic systems, which are our focus.
II.
Pesticides
1. Definition and Nomenclature of the Pesticide
As mentioned before, chemicals are substances (natural or human-made) that serve many human purposes (industrial, health and agricultural field). A pesticide is a substance or mixture of substances that prevent, destroy, repel or mitigate any pest [18]. Since pesticides have different physico-chem-ical properties, chemphysico-chem-ical structure, application, and toxicity, they can be di-vided into different subclasses.
According to EXIOPOL (an integrated project funded by the European Commission under the 6th framework programme, priority 6.3 Global
Change and Ecosystems), pesticides are divided in acaricides, algaecides, bactericides, fungicides, herbicides, insecticides, molluscicides, nemati-cides, rodenticides and others [19].
Depending on the nature of the pesticides, they can be: botanic ─ ob-tained from plants, antibiotics, and synthetics ─ compounds produced by man [20].
In Europe, 1331 active substances exist and according regulation (EC) No 1107/2009 only 482 of them are approved (Figure 1). Thousands of com-mercial formulations can be prepared from them or their residues, however these ones must be innocuous for people and animal health, and with no harm to environment [21, 22].
Figure 1: Percentage of the different activity classes of 482 substances, as approved, by the European Union.
The European Chemicals Agency (ECHA) defines, evaluates, and regulates, through the Registration, Evaluation, Authorisation and Restriction of Chem-icals (REACH), the potential biological risks of chemical substances [23].
To distinguish their toxicological degree, pesticides can be grouped in five classes: extremely hazardous (class Ia); highly hazardous (class Ib); moderately hazardous (class II); slightly hazardous (Class III); unlikely to pre-sent acute hazard (U). This classification is based on the identification of a risk component that is present in a chemical substance, based on the LD50
for rats [24].
Chemically, pesticides can be classified as inorganic and organic (which can be divided into synthetics and naturals)[25]. The discovery of synthetic organic products have permitted the rising of diverse products that are clas-sified in 42 classes: organochlorines, clorophosphates, organophosphorus, carbamates, pyrethroids, sulfonylureas, triazines, and others [26, 27].
2. Sources and Pathways of Pesticides in the Environment
The current overuse and careless application of pesticides may impact diverse ecosystems, depending on: the type of usage (localized or wide-spread), spreading methodology (conventional, aerial), and usage intensity [28].
Environmentalists and scientists are aware of the hazardous effects pes-ticides may cause in the long-run. They can circulate through various mech-anisms, becoming an additional source of contamination and economic loss, among other consequences. Due to these facts, contamination can be spe-cific, in case of storage leaks, occasional drainage, improper containers and disposal procedures, or unspecific, when a widely polluted area provokes water contamination (wastewater draining into ground water) and/or drift of pesticides in the air [29].
i. Industrial Production
The main percentage of pesticides used is synthetic. In Europe, approxi-mately 540 companies produce and/or distribute these compounds [30].
Accidental seepages and insufficient wastewater treatment plant (WWTP) procedures are the main sources of pesticide output into the environment. According to the European legislation, each Member State must maintain an inventory that includes emissions, discharges, and losses of regulated sub-stances, but no limits are established by the legal document [31].
ii. Agriculture and Human Use
The exigent economic sector demands an intensive and modern agri-culture. For these reasons, pesticides serve as important tools for this sec-tor. Conversely, several adverse effects are known such as pesticide degra-dation, absorption and desorption in the soils, secondary pest growth, plant and insect resistance, agricultural seepage, and food contamination [32].
A lack of knowledge combined with non-conscious application, may lead to an excessive use of these compounds, increasing the concentrations in soil and crops. Additionally, the contamination of raw materials leads to a
farmed animals. In the last European Food Safety Authority (EFSA) report (2013), more than 80 000 samples were analysed, from which 45.4% had measurable residues and 2.6% of them had values above the established MRL [33]. Additionally, other studies confirmed the presence of persistent pesticides in diverse animal products, such as meat, milk, and eggs con-sumed in Europe [27, 34-36].
3. Fate and Occurrence of Pesticides in the Environment
Pesticides are commonly used for a specific purpose, usually linked to agronomical production. Besides the specific application, these compounds are released into the environment by evaporation, leaching, water runoff, and uptake by plants and organisms.
i. Water
The contamination of the main water bodies by anthropogenic pollutants, namely pesticides, can be resultant of surface water run-off, waste water discharge, accidental seepage, soil erosion, and/or leach from treated fields [29].
Due to their chemical structure, pesticides, when in contact with water, are susceptible to hydrolysis processes [9]. This reaction is measured by the half-life of the main compounds along time [9]. The half-life of a pesticide may be affected by temperature, pH, and other particles or compounds pre-sent in the water. In addition to possible hydrolysis processes, pesticides may be subject to microbial degradation [37]. As well as in soil, this degra-dation process is affected by the same parameters described in item 3.i [37]. The hydrolysis half-life value is an essential aspect to estimate the persis-tence of a compound in water and help us to evaluate the impact on the aquatic habitats.
The groundwater ubiquity score (GUS index) estimates the potential of pesticides to contaminate groundwater. This parameter can be calculated through the formula: GUS = log (pesticide half-life) x [4 - log (KOC)]. With this
potential indicator of pollution pesticides classify as having extremely low (<-1) to very high potential (>4) to move toward groundwaters [38, 39].
ii. Soils/sediments
Intense and frequent use of pesticides led to an accumulation and persis-tence in soils. As these compounds are mostly non-polar and hydrophobic, they tend to be less soluble and highly stable in this matrix [40]. Several phenomenon may occur when these compounds are in contact with the soil: Sorption is the phenomenon that describes the affinity of these com-pounds into the physical structure of a matrix, in this case the soil. This process is affected by organic matter content, humidity, texture [29] but also by size, hydrophobicity, charge, capacity to form hydrogen bonds, and structure arrangement [41].
The content of organic matter in the soil is linked with the amount of pesticide adsorbed (Kd). This parameter, expressed by L/kg, can be
deter-mined by the ratio beteween the amounts of pesticides measured in the soil (mg/kg) per their amount in water (mg/L). A low Kd ratio indicates more
pesticide in the solution and a higher value that the pesticide is more strongly sorbed to soil.However, in order to normalize Kd coefficient, it
should be divided by the organic matter content of the soil (sorption coeffi-cient; KOC) [42]. Values of KOC ≤ 300 indicate higher potential of pesticides to
leach or move with surface runoff [29].
The adsorption of pesticides also depends on physical and/or chemical characteristics, such as van der Waals forces and chemical bonds, estab-lished between pesticides and soils [41].
Microbial degradation by fungi, bacteria, and other microorganisms also affects the availability of these substances. Also, physicochemical environ-mental conditions such as pH, temperature, soil moisture, and aeration are important for the degradation and breakdown processes [43].
Additionally, vapour drift may also contribute to the loss of pesticides; the higher the value of the Henry's law constant (Kh) the greater the tendency
Considering these facts and based on half-life of these compounds, pes-ticides may be classified according to their persistence: low (less than 30 days), moderate (between 30-100 days), and high persistence (greater than 100 days) [44].
iii. Aquatic Organisms
Since the 1990s, the world is aware of the harmful effects of pesticides. However, the overuse of these compounds still affects the ecosystem, bring-ing devastatbring-ing consequences for organisms. Due to their characteristics, low solubility in water and high persistence, pesticides tend to accumulate in the biota.
The bioaccumulation factor (BAF) is an important attribute to evaluate the concentrations found in a living organism, when compared to concentra-tions found in the habitat [45]. BAF may be influenced by several factors, as for instance, the chemical characteristics of the pesticide, lipid content and metabolism of the organism, as well as the habitat conditions (salinity, tem-perature, water currents, and dissolved oxygen) [42]. This means the BAF is higher in case of a non-polar compound with low solubility in water (high KOW) and greater half-life values. On the other hand, the organism has to have
an elevated capacity to uptake, high lipid content, slow metabolism, and a deficient capacity to metabolize the parent compound and its metabolites [46].
Based on laboratory experiences and mathematical models, REACH de-fined the maximum values of BAF as being >2000 L/Kg for PBTs and >5000 L/Kg for very persistent and very bioaccumulative compounds (vPvBs) [23]. The use of mathematical models is a good approach but still needs to be improved. Characteristics, like the maximum diameter and molecular length of a compound, and the octanol solubility (KOW), should be considered in the
models to have a better linearity between the experimental results and the mathematical models for a broad range of pesticides [45, 47].
Definitions, like bioconcentration (uptake of a chemical available in water), and bioaccumulation (uptake from water and food), are important to understand the biomagnification processes [11].
III. European Legislation for Pesticides
To establish regulatory limits for substance residues, solid bases (credible data) are required supported by measurable quantification limits and toxic hazard effects. Depending on the matrix, the regulatory limits are different.
1. Water
Due to these characteristics, each country must define their own regula-tory limits, based on their economic and technological situation. Nonethe-less, European Union (EU) countries must follow, at least, the directives im-plemented by the Council of European Union.
The water intended for human consumption has restricted maximum lev-els, set by the Directive 98/83/EC; a maximum concentration of 0.1 µg/L and 0.5 µg/L were defined for individual and total pesticides, respectively, excluding aldrin, dieldrin, heptachlor, and heptachlor epoxide, for which limits were set to 0.03 µg/L [48].
For aquatic environments, the limits are based on Environmental Quality Standards (EQS) [31] as defined by the Directive 2008/105/EC. Nonetheless, the EU Member States are only compelled to follow the EQS values for sur-face waters. Concerning the bathing water quality, no legislation is available considering the pesticides levels [49].
Meanwhile, the 2013/39/EU, as an amending of 2000/60/EC and 2008/105/EC directives, demonstrate the importance of a strict control in other matrixes, such as soil and biota [50, 51] (Table 2).
Table 2: Environmental quality standard values for pesticides (µg/L) – Directive 2013/39/EU.
Pesticides
Annual average Maximum allowable concentration
Inland surface waters Other surface waters(b) Inland surface waters
Other surface wa-ters
Aclonifen 0.12 0.01 0.12 0.01
Alachlor 0.3 0.3 0.7 0.7
Atrazine 0.6 0.6 2 2
Bifenox 0.01 1.20E-03 0.04 4.00E-03
Chlorfenvinphos 0.1 0.1 0.3 0.3
Chlorpyrifos 0.03 0.03 0.1 0.1
Cybutryne 2.50E-03 2.50E-03 0.02 0.02
Cyclodiene pesticides (a) ∑0.01 ∑0.005 na na
Cypermethrin 8.00E-05 5.00E-06 6.00E-04 6.00E-05
4,4’-DDT 0.01 0.01 na na
DDT total 2.50E-02 2.50E-02 na na
Dichlorvos 6.00E-04 6.00E-04 7.00E-04 7.00E-05
Dicofol 1.30E-03 3.20E-05 na na
Diuron 0.2 0.2 1.8 1.8
Endosulfan 5.00E-03 5.00E-03 0.01 0.01
Heptachlor and hepta-chlor epoxide
2.00E-07 1.00E-08 3.00E-04 3.00E-05 Hexachlorobenzene (HCB) 0.01 0.01 0.05 0.05 Hexachlorocyclohexane (HCH) 0.02 2.00E-03 0.04 0.02 Isoproturon 0.3 0.3 1 1 Octylphenol 0.1 0.1 na na Pentachlorobenzene (PeCB) 7.00E-03 7.00E-04 na na Pentachlorophenol 0.4 0.4 1 1 Quinoxyfen 0.15 0.02 2.7 0.54 Simazine 1 1 4 4 Terbutryn 0.07 0.01 0.34 0.03
Tributylin compounds 2.00E-04 2.00E-04 1.50E-03 1.50E-03
Trichlorobenzenes 0.4 0.4 na na
Trifluralin 0.03 0.03 na na
(a): Aldrin, Dieldrin, Endrin, Isodrin; (b) other surface waters: transitional, coastal and territorial waters; na:
not applicable
2. Soils and Sediments
Several data have been published concerning soil contamination in Europe [52-55]. As no specific and official EU legislation exists, leading authors re-fer to the “Dutch List” (Table 3) [54, 56-59].
Table 3: Target and intervention values, for soil/sediment remediation for pesticides, ac-cording to the Dutch List.
Pesticides Target values Intervention values
mg/kg dry matter ∑DDT/DDD/DDE (total) 0.01 4 Aldrin 0.00006 - Dieldrin 0.0005 - Endrin 0.00004 - ∑Drins 0.005 4 HCH (alpha) 0.003 - HCH (beta) 0.009 - HCH (gamma) 0.00005 - ∑HCH 0.01 2 Atrazine 0.0002 6 Carbaryl 0.00003 5 Carbofuran 0.00002 2 Chlordane 0.00003 4 Endosulfan 0.00001 4 Heptachlor 0.0007 4 Heptachlor epoxide 0.000002 4 Maneb 0.002 35 MCPA 0.00005 4 Organotin compounds 0.001 2.5
3. Food and Biota
In Europe the amount of pesticide residues in food must be kept under a safe threshold for all consumers; these amounts are defined by the maxi-mum residue levels (MRLs), which are the highest levels of a pesticide resi-due that is legally tolerated in food or feed. When a specific pesticide MRL is not mentioned, a MRL of 0.01 mg/kg is applied [60].
As being aquatic organisms/biota, the new directive (2013/60/EU) estab-lished EQS of 10, 33, and 0.0067 µg/kg wet weight (ww), for hexachloro-benzene, dicofol, and the sum of heptachlor and heptachlor epoxide, re-spectively [51]. For the other pesticides a general concentration of 10 µg/kg ww was adopted.
IV. Database Analyses ─ An Up-to-Date Perspective.
This review focuses on three matrices (water─soil─aquatic organisms) to better understand the interactions between them. Since a great amount of data is available, we select a period of 15 years (from 2000 to 2016) to analyse results before and after the “dirty dozen” law [15]. All the available data ─ minimum (min), maximum (max), and average concentrations (av) ─ were collected and expressed as ng/L (water) and ng/g (soils and organ-isms). Additional information, such as the number of samples used in each study were also noted. Data was grouped by pesticide category. Europe is used as the main pillar of this study, in comparison with other continents, because is the continent with more available information about this issue. For biota data, such as species, scientific name, and identification of the used matrix, were also collected. Online databases, as Web of Science (Thomson Reuters) and PubMed (NCBI), served to access to the indexed ar-ticles used in this work.
1. Water
A total of 78 articles were collected and compiled in Table 4. During data selection were prioritized surface waters and dissolved aqueous phase ma-trices, representing a total of 78% and 7% of the collected data, respectively. This was done to reach a better correlation between matrices (sediments and aquatic organisms) that are further discussed in this review. 63% of the analysed data belong to Europe, the rest being divided between Africa, Asia (each with 15%), followed by South America and Oceania. No data was found for North America with the above presented requirements (Table 4); so, when citing herein “worldwide”, the continent will not appear. More than 46 aquatic systems were studied in Europe, from which Spain stands out with a total of 13 aquatic systems published in 12 journals.
Table 4: Pesticide concentrations (minimum, maximum and average values; ng/L) in water samples, displayed by continent, country, and aquatic system; the number of quantified pesticides and sampling year were also added.
Pesticides No.
Sampling year
min max average
References ng/L Africa Egypt Manzala Lake 13 1993 0.1 0.2 0.1 [61] Nile River 12 19;93 0.0 0.0 0.0 [61] Ghana Bosomtwi Lake 4 2004 0.3 0.9 0.1 [62] Nigeria Ikoro River 4 na 405.5 431.0 420.3 [63] Ogba River 7 na 536.7 571.6 554.7 [63] Ovia River 7 na 490.0 525.3 509.0 [63] Owan River 14 na - - 190.0 [64] South Africa Buffalo River 15 2002 - - 35.2 [65] Leiskamma River 14 2002 - - 44.6 [65] Lourens River 4 1999 25.0 135.0 77.9 [61] Swartkops River 15 2002 - - 40.7 [65] Tyhume River 14 2002 - - 47.3 [65] Asia China
Beijing Guanting
reser-voir 30 2003 3.2 27.9 9.7 [66] Jinjiang River 9 na 3.0 4.6 3.5 [67] Minjiang River 17 1999 9.7 126.7 46.6 [68] Qiantang River 13 2005 0.3 29.1 4.8 [69] Tonghui River 18 2002 14.0 246.6 41.4 [70] Yangtze River 13 2005 0.2 8.5 1.5 [71] Yellow Sea 5 2006 240.0 922.0 512.0 [72] India Bay of Bengal 10 2011 0.0 2.2 0.2 [73] Vasai creek 13 2009 41.0 127.5 87.0 [74] Macau Pearl River 18 2001 0.8 3.5 1.6 [75] Russia Obskaya bay 7 2005 - - 0.1 [76] Yenisei River 7 2003 - - 0.0 [76] Europe
Central and Eastern
Eu-rope Danube River 9 2007 - 24.1 6.3 [77] Belgium Escaut-Lys River 7 2002 - - 312.1 [78] Scheldt River 6 2004 - - 48.4 [79] Bulgaria Strymonas River 8 na 6.6 10.4 5.3 [80] France Beillant River 3 2010 - - 26.9 [81] Bretagne River 2 2007 - - 32.5 [82] Jauron River 19 2003 317.4 636.8 466.3 [83]
Pesticides No.
Sampling year
min max average
References ng/L Europe Save River 12 2008 - 727.3 140.3 [85] Seine River 6 2006 90.0 3451.7 566.7 [86] Germany
Elbe and Weiβe Elster
rivers 12 2001 - - 3.7 [87]
Elbe River 19 2001 - - 10.5 [87]
Modau River 1 2003-2006 4.0 3070.0 580.0 [88] Schwarzbach 1 2003-2006 4.0 250.0 60.0 [88]
Weiβe Elster River 17 2001 - - 9.1 [87]
Weschnitz 1 2003-2006 4.0 5600.0 540.0 [88] Winkelbach 1 2003-2006 4.0 550.0 30.0 [88]
Greece
Amvrakia lake 23 2007-2008 - 170.4 19.6 [89] Axios River 9 1996-1998 <LOQ 47.3 34.8 [90] Evros River 11 1996-1998 <LOQ 49.5 33.7 [90]
Kalamas River 3 2000 47.3 124.0 99.3 [91]
Nestos River 9 1996-1998 <LOQ 29.2 25.0 [90] Pamvotis Lake 9 1998-1999 11.6 803.3 49.9 [92] Strimonas River 9 1996-1998 <LOQ 39.9 31.6 [90]
Hungary Danube River 2 2010-2011 - - 417.1 [93] Poland Warka-Grójec region 5 2002-2003 525.4 1322.6 42.0 [94, 95] Oder River 8 2003-2004 1.3 55.6 8.5 [96] Portugal Alqueva dam 14 2006-2007 5.9 125.2 31.2 [97] Douro River 39 2010-2011 - - 134.7 [98] Lake Vela 8 2004 - - 3288.1 [99] Mondego River 56 2010-2011 4.0 550.5 89.3 [100]
Ria Formosa Lagoon 54 2010-2011 137.6 [101]
Ria Formosa Lagoon 18 2012-2013 - - 39.7 [102] Tagus River 53 2010-2011 8.8 555.0 63.4 [103]
Romania
Mures, Tarnava Mare
and Tarvana Mica 7 2004-2005 8.3 9.8 37.1 [104]
Spain
Anoia River 9 2010 <LOQ 35.8 9.6 [105]
Barcelona 5 2000 28.1 61.7 [106] Cadiz 4 2007 - - 15.0 [107] Catalan rivers 45 2007-2008 6.1 448.7 66.0 [108, 109] Duero River 5 2001 10.0 218.0 4.0 [110] Ebro River 36 2006 10.0 947.0 103.6 [39, 55, 111] Girona River 11 1996-1997 8.5 99.2 18.6 [112] Guadalquivir River 13 2010 58.4 61.8 5.0 [113] Guadalquivir River 11 2005 - - 1125.5 [114] Llobregat River 3 2009-2010 - 12.7 7.1 [105] Llobregat River 19 2003-2004 - 196.3 34.3 [115] Llobregat River 28 2000 26.7 50.3 - [106] (continued)
Pesticides No.
Sampling year
min max average
References ng/L Europe Miño River 4 2001 17.5 180.0 35.1 [110] Tinto/Odiel River 1 2005 - - 940.0 [114] Netherlands
Several aquatic systems 13 2008 34.6 79.2 43.8 [116]
Oceania
Australia
Proserpine, O'Connell,
and Pioneer rivers 6 2002 138.3 2680.0 759.1 [117] Tully–Murray Basin 7 2006 11.0 3398.6 326.9 [118]
South America
Argentina
Buenos Aires southeast
basin 8 2012 28.3 139.6 53.5 [119]
Brazil
São Lourenço River 10 1999 4.9 40.1 12.9 [120] Batalha and Vargem
Limpa River 11 2005 18.1 50.6 23.6 [121]
Symbols (na) and (-): no data found/available
Overall, the data collected between 1993 and 2012 shows average con-centrations ranging from 0.002 to 7984 ng/L (Table 4). Among the selected articles, 136 compounds were detected and quantified in Europe, 28 in Af-rica, 40 in Asia, 8 in Oceania, and 25 in South America.
On a Worldwide scale, the insecticides prevail (59%) in terms of available and quantified data when compared with both herbicides and fungicides. Per continent, the percentage of insecticides increases more than 90% in Africa and Asia, assuming approximately 40–60% in Europe and South Amer-ica. No cases were observed in North America, Oceania, and Antarctica (Fig-ure 2). The percentage of insecticides in Asia may be related to the high cereals production (more than 13 x 108 tonnes) on the continent, while in
Africa it can be linked to cereals and pulse production, plague control, and vector-borne diseases control [122-124]. The diverse percentage between categories, in Europe and South America, may be a response to diverse ag-riculture practices and industrial needs [6].
Looking at the nature of the matrix, most studies use surface water as a model (75%) the rest taken by groundwater (10%), dissolved aqueous phase (7%), and others (Figure 2).
Figure 2: Representation of the quantified pesticides in water samples (%), per category, on each continent; the right upper corner figure represents the type of matrices found world-wide.
In spite of these facts, we should be aware that these results are depend-ent on the authors’ selection, which may not correspond depend-entirely to what is present in the aquatic systems. The same is applied to the number of field samples. Here, the highest frequencies are associated to a higher number of field samples, as the probability of getting a contaminated sample in-creases; based on this we may assume that, in most cases, the number of samples are not sufficient to get representative data (Table 5).
The quantified pesticides data are also compared to the levels set by Di-rective 2013/39/EU (Table 5). Considering the pesticides with concentra-tions above these levels (n), many cases (n = 45) are registered in Africa and Asia for insecticides, while Europe has similar number of cases, for insecti-cide (n = 87) and herbiinsecti-cide (n = 107) categories. Few cases are observed for other continents.
In Europe, pesticides levels average between 5 and 562 ng/L, where Por-tugal (39%), Spain (26%), and Greece (11%) were the top three countries with published articles (from a total of 42 publications), represented in more than
260, 170 and 73 measured pesticides in different aquatic systems. Propor-tionally, Portugal (n = 80) followed by Spain (n = 46) and Greece (n = 24) had several quantifications above the directive limits [39, 89, 90, 100-102, 105-108, 110-115].
Table 5: Pesticides average concentrations (ng/L) in water samples, displayed by continent and pesticide category; Europe is presented with more detailed information; the number of field samples, as well as the number of samples above 2013/39/EU Directive levels, were also included; references are only defined for the samples above the 2013/39/EU Directive, per category. Average Amounts (ng/L) Field samples No. Samples above 2013/39/EU References Africa Fungicide 32.5 6 6 [65, 125] Herbicide 210.0 2 1 [64] Insecticide 121.0 115 44 [61-65, 125] Asia Fungicide 4.1 3 3 [66, 76] Herbicide 6.1 5 2 [66] Insecticide 37.0 152 53 [66, 68-76] Europe Fungicide Bulgaria 9.1 1 1 [80] France 127.6 9 - - Greece 31.8 8 2 [89, 90] Portugal 115.4 24 8 [100-103] Spain 562.4 5 - - Netherlands 120.0 2 - - Herbicide Central/Eastern Europe 7.1 9 4 [77] Belgium 201.6 12 8 [78, 79] France 383.9 30 7 [81-83, 85, 86] Germany 32.0 49 15 [87, 88] Greece 35.4 15 8 [89, 91, 92] Hungary 417.1 2 - - Portugal 201.3 80 30 [97-103, 126] Romania 113.5 2 1 [104] Spain 126.7 113 34 [39, 105-108, 110-115] Netherlands 23.8 8 - - Insecticide Belgium 56.0 1 1 [78] Bulgaria 4.7 7 4 [80] France 140.7 7 3 [83-86] Germany 13.6 3 3 [87] Greece 32.1 50 14 [89-92] Poland 19.7 13 6 [94-96] Portugal 219.1 164 42 [97-103] Romania 6.5 5 2 [104] Spain 84.7 57 12 [39, 105, 107-109, 111-114,
Average Amounts (ng/L) Field samples No. Samples above 2013/39/EU References Oceania Herbicide 526.4 13 5 [117, 118] South America Fungicide 39.3 3 - - Herbicide 15.1 8 5 [119, 120] Insecticide 32.1 18 5 [119-121]
Symbol (-): absence of samples above 2013/39/EU Directive
Since the number of compounds observed are quite different between the published articles, the most frequent pesticides (more than 10 observations,
i.e. quantification of pesticides in different aquatic systems or countries)
were analysed to compare the average concentrations between continents with a relevant amount of data. We observed that the most quantified pesti-cides (Table 6) belong to the priority list cited before (Table 1); this data once more indicates the attention, of researchers, to these illegal com-pounds.
The fungicide HCB is present on three continents, with similar average concentrations in Africa and Europe (40 ng/L), and lower amounts in Asia (4 ng/L). Considering the category of the herbicides, atrazine and simazine are being measured in Europe, Oceania, and South America. However, atrazine is reported with values 10 times higher in Oceania than in the other conti-nents. By the contrary, simazine concentrations range between 45 and 95 ng/L for Oceania and Europe, presenting lower values in South America (9 ng/L). Amongst insecticides, ∑DDT, ∑endosulfan, and ∑HCH residues are the most frequent in Africa, Asia, and Europe.
Comparing the total average sum of these insecticides (∑), Africa presents higher concentrations (~1500 ng/L) than Asia, Europe (~410 ng/L), and South America (~200 ng/L).
The ratios parent compound/residues are calculated for DDT, endosulfan, and heptachlor. Results demonstrate an active use of DDT in Asia, Europe, and Africa, from which the first one stands out with a ratio of 1.4. Endosul-fan presents high ratio values in Africa (6.5), Europe (3.5), and South Amer-ica (5.5). The same is observed for heptachlor in Asia (3.1) and Europe (2.4). These results intend to show that countries in these continents maintain the
Considering the 2013/39/EU Directive for transitional waters, all conti-nents documented average concentrations 15- to 40-times higher than the legal concentrations (consult Table 3).
Table 6: Average values (ng/L) of the most frequent pesticides, quantified in water samples, displayed by category and continent; data based on the references cited in Table 3; refer-ences organized by pesticide category.
Average amounts (ng/L) Africa Asia Europe Oceania South
America References Fungicides HCB 32.5 4.1 43.0 [65, 66, 76, 80, 90, 98, 100, 101, 103, 125] Herbicides Alachlor 1.7 506.7 11.0 [39, 64, 66, 77-79, 81-83, 85, 87, 89, 91, 92, 94, 97-99, 101, 102, 104-106, 108, 110-114, 117-120, 126] Atrazine 150.0 74.7 674.3 17.0 DEA 26.6 65.2 Diuron 266.1 1768.3 Simazine 95.0 45.0 9.0 Insecticides ∑DDT 868.5 215.7 134.1 105.0 [39, 61-70, 72-76, 78, 80, 83-85, 87, 90, 94-99, 101, 102, 104, 107-109, 111, 112, 120, 121, 125] 2,4´-DDD 152.7 25.1 31.0 2,4´-DDE 50.0 0.0 1.4 2,4´-DDT 212.7 63.8 4.0 6.0 4,4´-DDD 119.1 0.9 16.6 41.0 4,4´-DDE 170.4 65.4 22.3 36.0 4,4′-DDT 163.6 60.5 58.8 22.0 DDT/DDE+DDD 0.8 1.4 0.9 0.4 ∑cyclodiene 318.6 42.3 424.9 Aldrin 279.6 20.7 392.1 Endrin 39.0 21.6 32.7 ∑endosulfan 166.7 59.1 122.5 38.5 Endosulfan (alpha) 116.7 17.0 97.5 16.0 Endosulfan (beta) 50.0 42.0 25.0 22.5 Endosulfan sulfate 25.7 61.5 34.7 7.0 ∑endosulfan/endosulfan sulfate 6.5 1.0 3.5 5.5 ∑HCH 525.5 156.9 137.6 60.0 HCH (alpha) 85.08 61.0 24.7 13.0 HCH (beta) 76.86 19.3 39.1 37.0 HCH (gamma) 331.08 75.4 73.8 10.0 HCH (sigma) 32.52 1.2 ∑Heptachlor, Heptachlor epoxide 475.00 39.1 57.9 Heptachlor 45.00 29.6 41.1 Heptachlor epoxide 430.00 9.5 16.81 heptachlor/heptachlor epoxide 0.10 3.1 2.4 ∑ 1560.7 431.6 394.2 203.5
The pesticide names in bold are in the 2013/39/EU Directive ; the ratio parent/residues is presented in italic style
In Europe (Portugal, Spain, France, Netherlands, and Greece), in spite of the different number of quantified pesticides per category, the average con-centrations of fungicides, herbicides and insecticides being reported are in the same order [39, 46, 81-86, 89-92, 97-103, 105-116]. This possibly indi-cates similar agricultural practices among these countries, leading to com-parable pollution degree. However, different toxic effect may occur in each aquifer system.
The most frequent pesticides (equal or more than 10 quantifications in different aquatic systems or countries) were selected and grouped by cate-gory (Table 7), reaching a total of 22 compounds; eleven of them are above the MRLs set by 2013/39/EU Directive. The range of concentrations (min-max) was assessed to display the most substantial differences between countries. Seven pesticides (alachlor, chlortoluron, diuron, metolachlor, ter-buthylazine, aldrin, and dieldrin) stand out with higher ranges (numbers in bold, Table 7). Alachlor is present in the Iberian Peninsula at levels above the 2013/39/EU Directive limits, which may relate to a regional application of this herbicide [97-103, 126]; the same was observed for diuron, in Spain, France, and Belgium [78, 83, 86, 105, 108, 111, 114, 127]. The cyclodiene pesticides (∑aldrin and dieldrin) were above the annual average concentra-tions (∑= 5 ng/L) set by the same directive for all registered cases, present-ing extremely high amounts in Portugal (∑cyclodienes 2363 ng/L), demon-strating an abusive and illegal use of these compounds [98-101, 103].The herbicides, chlortoluron and terbuthylazine were quantified, in France, at concentrations above 300 ng/L, indicating an abusive application and/or improper waste treatment [83, 85].
Table 7: Average values (ng/L) of the most frequent pesticides, quantified in water samples, displayed by European country; referring to the most frequent pesticides. Average amounts (ng/g) Central and Eastern Eu-rope
Bel-gium Bulgaria France Germany Greece Poland Portugal
Roma-nia Spain Netherlands min-max References [77] [78, 79] [80] [81-86] [87, 88] [89, 90] [94-96] [97-103] [104] [105-109, 112-114] [116] Alachlor 41.0 36.4 66.4 795.6 380.3 36.4-795.6 Atrazine 2.0 213.7 95.6 18.6 67.9 136.4 77.0 32.6 2.0-213.7 DEA 11.0 38.1 11.1 45.3 25.0 26.3 11.0-45.3 Chlortoluron 340.5 3.3 7.8 7.4 20.0 3.3-340.5 Cyanazine 0.3 72.2 5.2 0.3-72.2 Diuron 3.0 820.0 740.0 7.1 49.5 225.4 3.0-820.0 Isoproturon 2.0 270.0 144.0 13.1 3.3 3.9 40.0 2.0-270.0 Metolachlor 327.0 96.4 4.1 53.4 9.7 4.1-327.0 Simazine 71.9 7.7 2.7 33.5 168.8 2.7-168.8 Terbuthylazine 11.0 36.0 1950.0 4.1 65.4 414.0 4.1-1950.0 Terbutryn 203.4 37.4 0.6 0.6-203.4 ∑DDT 3.7 180.5 65.8 14.1 131.6 23.6 3.7-180.5 4,4’-DDD 84.0 7.5 11.0 7.6 7.5-84.0 4,4’-DDE 30.8 0.0 24.6 3.6 0.0-30.8 4,4’-DDT 3.7 96.5 35.0 6.6 96.0 12.5 3.7-96.5 ∑cyclodiene 5.6 43.0 6.0 2363.2 6.4 5.6-2363.2 Aldrin 5.6 23.9 1.0 832.1 3.1 1.0-832.1 Dieldrin 19.2 5.0 1531.1 3.2 3.2-1531.1 Chlorpyriphos 2.5 29.1 1.9 1.9-29.1 Diazinon 93.1 62.4 20.0 9.0 9.0-93.1 Dimethoate 5.2 92.0 23.1 5.2-92.0 Endosulfan sulfate 19.1 47.2 19.1-47.2 Fenitrothion 3.3 77.9 151.5 3.3-151.5 HCH (gamma) 56.0 12.8 200.0 1.3 25.7 83.4 165.4 2.6 15.7 1.3-200.0
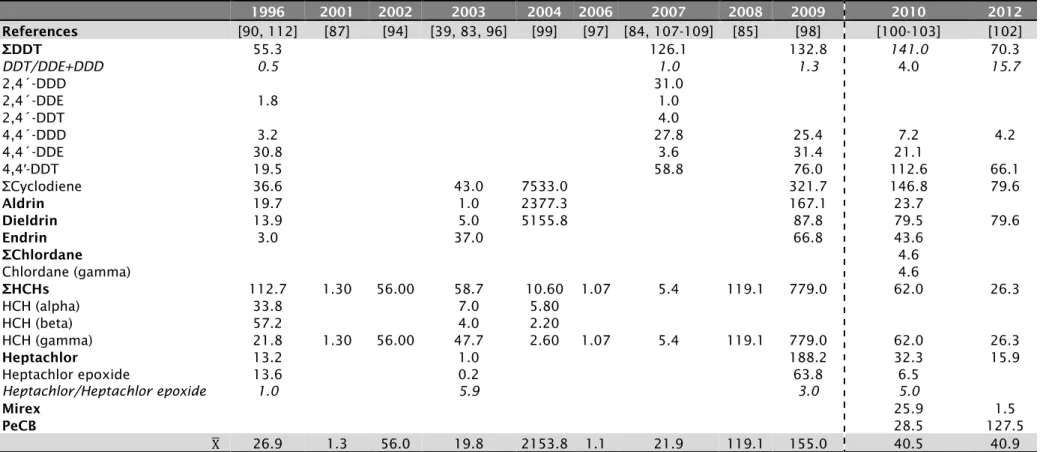
From the pesticides quantified in Europe, the ones identified by the Stockholm Convention were selected by sampling year as displayed in Ta-ble 8.
Nine priority pesticides and their residues were quantified from 1996 to 2012, from which almost all were reported in 1996 and in the last three years. Similar average concentrations reveal a continuous use of these pesticides along these years, even with the lack of information between 2001 and 2008. In 2004, the highest amounts of two cyclodiene pesti-cides (aldrin and dieldrin) were registered in the same aquatic system (Lake Vela, Portugal; see Table 3) [99]. Again, these results prove the abu-sive use of biocides.
The parent/residues ratio, described previously for DDT and hepta-chlor, reveals that values both cases are almost always above 1, which indicates an active utilization of these pesticides; at least until 2012.
Table 8: Average values (ng/L) of the priority listed pesticides quantified in water samples, collected in Europe, and displayed by sampling year; referring to the most frequent pesticides
1996 2001 2002 2003 2004 2006 2007 2008 2009 2010 2012 References [90, 112] [87] [94] [39, 83, 96] [99] [97] [84, 107-109] [85] [98] [100-103] [102] ∑DDT 55.3 126.1 132.8 141.0 70.3 DDT/DDE+DDD 0.5 1.0 1.3 4.0 15.7 2,4´-DDD 31.0 2,4´-DDE 1.8 1.0 2,4´-DDT 4.0 4,4´-DDD 3.2 27.8 25.4 7.2 4.2 4,4´-DDE 30.8 3.6 31.4 21.1 4,4′-DDT 19.5 58.8 76.0 112.6 66.1 ∑Cyclodiene 36.6 43.0 7533.0 321.7 146.8 79.6 Aldrin 19.7 1.0 2377.3 167.1 23.7 Dieldrin 13.9 5.0 5155.8 87.8 79.5 79.6 Endrin 3.0 37.0 66.8 43.6 ∑Chlordane 4.6 Chlordane (gamma) 4.6 ∑HCHs 112.7 1.30 56.00 58.7 10.60 1.07 5.4 119.1 779.0 62.0 26.3 HCH (alpha) 33.8 7.0 5.80 HCH (beta) 57.2 4.0 2.20 HCH (gamma) 21.8 1.30 56.00 47.7 2.60 1.07 5.4 119.1 779.0 62.0 26.3 Heptachlor 13.2 1.0 188.2 32.3 15.9 Heptachlor epoxide 13.6 0.2 63.8 6.5 Heptachlor/Heptachlor epoxide 1.0 5.9 3.0 5.0 Mirex 25.9 1.5 PeCB 28.5 127.5 26.9 1.3 56.0 19.8 2153.8 1.1 21.9 119.1 155.0 40.5 40.9
The pesticides in bold are on the Stockholm convention list; the ratio parent/residues is presented in italic style; the dashed line represents the separation before and after the Stockholm Convention (2009).
2. Soils/sediments
Most of the works use sediments as a preferable matrix (74%), tailed by suspended solids (18%) and soils (8%).
Information from 6 continents, mainly Europe (40%) and Asia (31%), fol-lowed by Africa (16%), North and South America (6%) and Antarctica (1%) was gathered. No data was available for Oceania (Table 9) so, when citing herein “worldwide”, the continent will not appear.
Twenty-two aquatic systems were studied along Europe and 10 of them centred in Portugal (Table 9). Comparing with the water matrix, there are half the number of aquatic systems studies; this may reflect a lack of con-cern on the pesticide effects present in these matrices (soils and sedi-ments). Average concentrations range from 0.4 to 543.6 ng/g. In Europe, Portugal presents the highest percentage (67%) of the number of pesti-cides detected/quantified (124 of 184 quantifications) when compared to others countries (2–8%).
Table 9: Pesticide concentrations (minimum, maximum and average values) in sediment samples, displayed by continent, country, and aquatic system; the number of quantified pesticides and sampling year were also added.
Pesticides No.
Sampling year
min max average
References ng/g Africa Egypt Maryut Lake 7 2005 - 10.5 1.7 [128] Manzala Lake 14 1993 0.6 45.2 4.9 [125] Nile River 13 1993 7.5 8.8 8.0 [125] Ghana Bosomtwi Lake 6 2004 3.6 10.2 4.9 [62] Nigeria Owan River 15 na - - 1097.3 [64] South Africa Buffalo River 15 2002 11.4 92.5 45.8 [65] Lourens River 5 1999 3.3 166.8 49.5 [61] Antarctica Antarctic
King George Island 4 2009-2010 - - 0.1 [129]
Asia
China
Beijing Guanting reservoir 30 2003-2004 0.3 1.2 0.4 [66] Hangzhou bay 18 2000-2001 0.5 9.7 4.0 [130]
Jinjiang River 18 na 3.0 8.4 4.2 [67]
Pesticides Sampling year
min max average
References ng/g Asia Minjiang River 18 1999 0.7 4.0 2.0 [68] Qiantang River 13 2004 1.0 26.6 7.1 [69] Tonghui River 16 2002 0.1 1.1 0.4 [70] Yangtze River 8 ? 0.6 7.2 2.4 [131] Macau Pearl River 21 2001 0.0 0.5 0.3 [75] Europe Belgium Scheldt River 4 2000 - - 4.0 [132] France Moselle River 4 2008 0.3 0.7 0.4 [133] Greece Pamvotis Lake 4 1998-1999 - 403.5 129.0 [92] Italy Lambro River 4 2001 - - 9.7 [134] Poland Gulf of Gdańsk 2 2002 3.9 23.0 20.1 [135] Vistula River 4 2005 2.9 6.3 4.3 [136] Portugal Ave River 11 2007-2008 - - 1.8 [137] Cávado River 14 2007-2008 - - 2.4 [138] Douro River 11 2007-2008 - - 1.3 [137]
Ria Formosa Lagoon 2 2007 - - 1.7 [137]
Ria Formosa Lagoon 18 2012-2013 - - 543.6 [102]
Lake Vale 5 2004 - - 9.2 [99]
Lima River 11 2007 - - 0.7 [137]
Minho River 7/11 2007-2008 - - 1.4 [137]
Ria de Aveiro Lagoon 1 2011 - - 3.6 [139]
Sado River 11 2007 - - 3.4 [137]
Romania
Danube River 2 2001 - - 2.3 [140]
Mures, Tarnava Mare and
Tarvana Mica River 4 2004-2005 20.0 48.7 29.3 [104]
Serbia Danube River 12 2002 - - 2.3 [141] Slovakia Hron River 7 na 6.3 77.4 10.2 [142] Spain Ebro River 5 2004 - - 10.7 [143] Girona River 4 1996-1997 0.9 2.4 1.5 [112] Guadalquivir River 5 2010-2011 1.5 38.0 5.6 [113, 114] North America California Salton Sea 15 2000-2001 3.1 9.1 5.8 [144] Canada
Des Prairies River 4 na - - 22.0 [145]
USA
Idaho/Maine/Wisconsin River 10 2009 - 34.7 5.7 [146]
South America
Brazil
Data collected between 1993 and 2013, averaged between 0.02 and 1097 ng/g (Table 9). Overall 79 pesticides are quantified Worldwide, the highest number observed in Europe and Asia (more than 40), followed by Africa (32), North and South America (20), and Antarctica (4).
The highest average concentrations and standard deviations (SD) were measured in Africa (253 ng/g; SD 495), then Europe and North America (7 ng/g; SD 17), Asia (2 ng/g; SD 4), and finally South America and Ant-arctica (less than 1 ng/g, SD 1). In Africa the concentrations of pesticides were at least 36 times higher than in the rest of the world; the highest values are quantified in the Owan River (15 insecticides), Manzala Lake (4,4’-DDE), and Buffalo River (Chlordane (gamma)) [64, 65, 125]. These are independent aquatic systems, so the concentrations are not a local problem, but a consequence of an excessive and improper use of these insecticides over a wide geographical area, i.e. from Egypt to South Africa. Grouping data by pesticide category, it is observed a predominance of insecticides (88%) over the fungicides (7%), and herbicides (5%). The same pattern is applicable per continent, with the exception of North America that presents a similar percentage for insecticides and fungicides (40%) (Figure 3). No comparisons can be made with North America, Antarctica, and Oceania, due to insufficient data.
Figure 3: Representation of the quantified pesticides in sediment/soil samples (%), per category, on each continent; the right upper corner figure represents the type of matrices found Worldwide.
The sediment and soil data (Table 10) were evaluated according to the Dutch List standards [59]. The highest frequencies of quantified pesti-cides were attained for the insecticide category; similar to water fraction, their frequencies seem to be related to the number of field samples. For this category, Europe, Asia, and Africa present a higher number of quan-tified results (86, 70, and 40, respectively) above the Dutch List optimum levels (Table 10). While for Antarctica, North and South America each has 2, 4, and 10 results above these limits, respectively. Worldwide, 50% of the quantifications were above the optimum levels for insecticides, show-ing once more an abusive usage of this category of pesticides.
By country, the optimum levels were exceeded with most cases in Por-tugal (69 samples), followed by China (59 samples), Egypt (15 samples), and Brazil (10 samples) (data not shown) [66, 68-70, 99, 102, 130, 131, 137, 138].