FACULDADE DE CIÊNCIAS
DEPARTAMENTO DE BIOLOGIA ANIMAL
Thermal tolerance and acclimation capacity in tropical and
temperate coastal organisms
Inês Agra Vasconcelos Leal
Dissertação
FACULDADE DE CIÊNCIAS
DEPARTAMENTO DE BIOLOGIA ANIMAL
Thermal tolerance and acclimation capacity in tropical and
temperate coastal organisms
Inês Agra Vasconcelos Leal
Dissertação
Mestrado em Ecologia Marinha
Orientadores:
Doutora Catarina Vinagre
Professor Doutor Luís Narciso
This thesis was carried out with the funding of the project PTDC/MAR-EST/2141/2012 “WarmingWebs - Role of biodiversity, species thermal tolerance and food web structure in the response to climate change: temperate versus tropical ecosystems.”
Esta tese reflete um percurso de aprendizagem, durante o qual contei com a preciosa ajuda de pessoas excepcionais que me ensinaram, orientaram e ajudaram, às quais quero expressar a minha profunda gratidão:
À Doutora Catarina Vinagre, minha orientadora na Faculdade de Ciências da Universidade de Lisboa, vai o meu mais profundo obrigada por toda a orientação, incentivo, apoio, paciência perante as minhas dúvidas, entusiasmo contagiante nos trabalhos de investigação, pela dedicação e presença constante. Este foi para mim um ano de sonho, cheio de aventuras e descobertas fantásticas. Agradeço-lhe os desafios que me colocou, as oportunidades de aprendizagem, o ter-me ensinado a fazer ciência, a ser bióloga. O ter aprendido que ser bióloga é muito mais do que uma profissão, é um modo de ser e estar. É ser curiosa, lutadora, persistente e entusiasta!
Ao Prof. Doutor Augusto Flores, meu coorientador no Centro de Biologia Marinha da Universidade de São Paulo, CEBIMar/USP, pela maravilhosa recepção, por todo o apoio e por todas as risadas. Os meses no CEBIMar foram inesquecíveis, repletos de aprendizagem, colaboração e amizade. Não há palavras que expressem o apoio que me deu na tese. Muito obrigada!
Ao Prof. Doutor Luís Narciso, por toda a disponibilidade e todo o contributo para o sucesso desta tese.
Ao Doutor Mário Diniz e Doutoranda Diana Madeira, pela ajuda e apoio na realização das experiências na Faculdade de Ciências e Tecnologia da Universidade Nova de Lisboa. Sem eles não teria realizado as experiências com sucesso. Obrigada por tudo o que me ensinaram.
A toda a equipa WarmingWebs: Vanessa Mendonça, Diana Madeira, Carolina Madeira, Marta Dias, por toda a ajuda! Nós bem sabemos que apanhar estes bichinhos, e mantê-los vivos, não é tão fácil quanto isso!
A toda a equipa do CEBIMar, pelo apoio incondicional. Guardo com carinho a ajuda incansável do Sr. Joseilto Medeiros de Oliveira e Sr. Elso Alves da Silva na amostragem e no decorrer das experiências laboratoriais.
simplesmente estar! A sua amizade faz de mim uma pessoa melhor e mais feliz!
Ao André, por tudo. Por estar sempre ao meu lado e acreditar em mim. Por me incentivar a fazer sempre mais, a ir mais longe!
À minha Mãe, ao meu Pai e ao meu irmão. Por serem o meu modelo, a minha inspiração. Que posso dizer? Obrigada por me ensinarem a lutar pelos meus sonhos. Obrigada por me ensinarem a ver a felicidade nas coisas mais simples e improváveis. Obrigada por estarem sempre presentes. Esta tese é para vocês!
Throughout this year, I have had the precious help of exceptional people who taught me, guided me and helped me, and to whom I would like to express my gratitude:
To Dr. Catarina Vinagre, my advisor at Faculdade de Ciências da Universidade de Lisboa, I wish to thank her for all the guidance, encouragement, support, patience before my doubts, contagious enthusiasm in marine research and dedication. This was an amazing year, full of wonderful adventures and discoveries. I wish to thank her for the challenges and opportunities, for teaching me how to be a marine biologist.
To Prof. Dr. Augusto Flores, my advisor at Centro de Biologia Marinha da Universidade de São Paulo, CEBIMar/USP, I am grateful for his warm welcome, for all the support and guidance during my stay, for all the laughs. Those few months at CEBIMar were unforgettable. No words can describe how thankful I am.
To Prof. Dr. Luís Narciso, for always being available and for contributing to the success of this work. To Dr. Mário Diniz and his PhD student Diana Madeira, for all the help and support during the experiments at Faculdade de Ciências e Tecnologia da Universidade Nova de Lisboa. Without their precious help the experiments here reported wouldn’t have been as successful.
To WarmingWebs’ team: Vanessa Mendonça, Diana Madeira, Carolina Madeira, Marta Dias, for all the help! Catching these cute, little animals, is not as simple as it looks, and we know it.
To CEBIMar’s team, in particular to Sr. Joseilto Medeiros de Oliveira and Sr. Elso Alves da Silva. I cherish all their help and support during my stay.
To my friends, for their unconditional support. Their friendship makes me a better, happier person! To André, for everything. For always being by my side. For believing in me, and encouraging me to go further.
To my mother, my father and my brother, my role models. Thank you for showing me that happiness in in the simplest, most unlikely things! This thesis is for you!
A temperatura é, sem dúvida, um dos principais fatores abióticos responsáveis por definir padrões na Natureza, em especial no que toca à distribuição e abundância das espécies. No último século, a temperatura média global subiu 0.6oC, estando previsto, até ao final deste século, um
aumento de 2 a 4oC. Isto significa que muitos ecossistemas serão sujeitos a uma taxa de
aquecimento muito superior àquela a que estiveram sujeitos nos últimos milhares de anos. Na verdade, já são visíveis alterações nos ecossistemas resultantes do recente aquecimento global. Diversos estudos demonstram que o aquecimento nas últimas décadas tem afetado a fenologia dos organismos, a distribuição das espécies e a composição e dinâmica das comunidades, desde as regiões polares às tropicais. Como tal, o aquecimento previsto para as próximas décadas poderá ter graves consequências para os ecossistemas e a biodiversidade, a nível global. Prever os impactos do aquecimento global é, assim, uma tarefa imperativa. As espécies, populações e comunidades não responderão a médias térmicas globais, mas sim a alterações a nível regional. Neste contexto, o Painel Intergovernamental sobre Alterações Climáticas previu, em 2007, uma assimetria na taxa de aquecimento global, com um aquecimento mais rápido nas latitudes mais elevadas do que nas mais baixas. Esta previsão levantou preocupações sobre quais os organismos em maior risco, originando um debate científico acerca da vulnerabilidade das espécies tropicais versus temperadas.
Os trópicos e as zonas temperadas albergam a maior parte das espécies do nosso planeta. Alguns estudos preveem que o aquecimento global terá um baixo impacto nos trópicos, já que a taxa de aquecimento nestas regiões será inferior comparativamente às latitudes mais altas. No entanto, o facto das espécies tropicais viverem em ambientes estáveis, sem grandes flutuações térmicas sazonais, poderá fazer com que estas espécies sofram desproporcionalmente com pequenas elevações de temperatura. Uma forma de contribuir para este debate passa por estimar a tolerância térmica e a capacidade de aclimação das espécies. Conhecer os limites térmicos de uma espécie, e a plasticidade desses limites, permite-nos discutir o que poderá acontecer à distribuição e abundância dos organismos no decorrer das alterações climáticas. Atualmente, esta informação está limitada a um número reduzido de espécies.
rochoso. As poças de maré encontradas nesta zona, durante a baixa-mar, são ambientes exigentes para as comunidades que nelas habitam. Estes habitats estão sujeitos às variações térmicas do clima terrestre e marinho, havendo já estudos que indicam que os organismos intertidais estão a viver perto dos seus limites fisiológicos. Isto significa que a elevação de temperatura prevista, assim como o aumento da frequência e intensidade de ondas de calor, poderão ter um enorme impacto nas comunidades da zona intertidal.
Neste contexto, o presente trabalho tem como objetivo estimar a tolerância térmica e a capacidade de aclimação de espécies costeiras, tropicais e temperadas, de forma a discutir e comparar a sua potencial vulnerabilidade face ao aquecimento global. Os locais de estudo foram a costa sudeste Brasileira, tropical, e a costa oeste Portuguesa, temperada. Crustáceos e peixes de diferentes espécies foram recolhidos em poças de maré, com camaroeiros, e testados em laboratório, no Verão de 2014.
Para estimar a tolerância térmica, foram determinados os limites térmicos superiores de 12 espécies tropicais e 23 espécies temperadas. O método usado foi o Critical Thermal Maximum (CTMax), no qual os organismos são sujeitos a um incremento de temperatura na ordem do 1oC/h
até atingirem o seu máximo térmico crítico, isto é, até perderem o equilíbrio. Baseado na temperatura a que os primeiros sinais de stress térmico ocorrem, o CTMax é uma medida conservativa de tolerância térmica, sendo muito utilizado em estudos de stress térmico. Este método permitiu determinar que espécies vivem mais perto do seu limite térmico, logo, quais as espécies mais vulneráveis a um aumento de temperatura. As espécies tropicais apresentaram valores de CTMax mais elevados. No entanto, verificou-se que as espécies tropicais vivem mais perto dos seus limites térmicos, sendo mesmo expostas a temperaturas superiores a estes limites durante ondas de calor. Além disso, a variabilidade intraespecífica no CTMax foi mais elevada nas espécies temperadas que nas tropicais, indiciando um potencial evolutivo inferior das espécies tropicais para lidar com um aumento de temperatura. Os resultados obtidos apontam para um maior risco associado às espécies tropicais face a um aumento de temperatura.
Para estimar a capacidade de aclimação, i.e. a capacidade de ajustar os limites térmicos, os organismos foram expostos a temperaturas acima da sua temperatura atual em duas experiências, uma a longo-prazo e outra a curto-prazo. Na experiência a longo-prazo os organismos foram expostos a 3oC acima da temperatura média atual, durante 30 dias, simulando o aumento médio de
expostos a 6C acima da temperatura média presente, durante 10 dias, simulando uma onda de calor futura. Os limites térmicos superiores antes e após cada experiência foram determinados, de forma a poder avaliar a capacidade de aclimação dos organismos. Foram testados 4 pares de espécies tropicais-temperadas intertidais, pertencentes às famílias Palaemonidae, Grapsidae, Blenniidae e Gobiidae. Verificou-se que tanto espécies tropicais como temperadas têm a capacidade de aclimar como resposta a elevações de temperatura. No entanto, a capacidade de aclimação das espécies tropicais foi inferior comparativamente à das temperadas, indiciando que as espécies tropicais poderão estar vulneráveis até a pequenas elevações de temperatura ambiente. Como acima mencionado, as espécies tropicais são atualmente expostas a temperaturas superiores aos seus limites térmicos durante ondas de calor, e este stress térmico poderá já estar a exercer pressão sobre a tolerância térmica destes organismos. Estes resultados sugerem que a resposta das comunidades intertidais tropicais ao aquecimento global será visível antes que a das comunidades intertidais temperadas.
Provavelmente, as espécies tropicais intertidais irão habitar as mesmas áreas, e refugiar-se em águas mais frias, subtidais, durante elevações de temperatura extremas. No entanto, as interações entre as espécies e os seus competidores, predadores e/ou presas, poderão restringir o uso destes refúgios por parte das espécies intertidais. Tal situação poderá ter graves consequências para as populações do intertidal, conduzindo, no extremo, à sua extinção local caso a adaptação genética destas espécies não seja capaz de acompanhar a taxa de aquecimento prevista.
As conclusões aqui apresentadas corroboram não só estudos científicos que indicam que as comunidades intertidais são sentinelas dos impactos do aquecimento global, como também estudos com anfíbios, répteis e invertebrados que demonstram que espécies com maior tolerância térmica têm menor capacidade de aclimação. Uma das espécies tropicais testadas no presente estudo, o peixe intertidal Bathygobius soporator, teve a maior tolerância térmica, de quase 41oC. No entanto,
não foi capaz de aclimar em nenhuma das experiências. Esta foi também a temperatura máxima registada em poças de maré durante ondas de calor, onde os organismos foram capturados. Dado o aumento da frequência, intensidade e duração das ondas de calor previsto, é expectável que a temperatura máxima encontrada em poças de maré suba. Assim, caso estes organismos fiquem retidos numa poça durante uma onda de calor futura, poderão morrer, como já foi observado noutras espécies de peixes tropicais nas Ilhas Marshall, no Oceano Pacífico.
nos inferir quais as alterações na distribuição e abundância das espécies durante o aquecimento global. No entanto, para prever os impactos a nível de interações entre espécies, estrutura das comunidades e dinâmica dos ecossistemas, é necessário testar muitas mais espécies, e aprofundar estudos transgeracionais, já que a variabilidade genética poderá ser decisiva na persistência de populações ameaçadas pelo aquecimento global. Na verdade, a adaptação evolutiva poderá ser a única forma de espécies vulneráveis persistirem caso não sejam capazes de dispersar para locais mais favoráveis. Eventualmente, tal informação poderá ser incorporada na gestão costeira por forma a minimizar a perda de biodiversidade consequente das alterações climáticas.
Em conclusão, os resultados do presente estudo sugerem fortemente que as espécies tropicais intertidais se encontram em maior risco de sofrerem efeitos negativos decorrentes do aquecimento previsto para esta região. Assim, esta tese contribui para o debate científico sobre que espécies são mais vulneráveis ao aquecimento global, tropicais ou temperadas.
Palavras-chave:
Aquecimento Global, Tolerância Térmica, Capacidade de Aclimação, MáximoTemperature is one of the key abiotic factors responsible for setting ecological patterns in nature. Recent projections indicate that mean global temperature is predicted to increase 2 to 4oC
by the end of this century, putting pressure on many ecosystems. Predicting the likely impacts of climate warming is thus imperative. The tropics and temperate zones encompass most of the species found in the planet, and a scientific debate on the vulnerability of tropical versus temperate species towards rising temperatures has emerged. One way to answer this debate involves estimating species’ thermal tolerance and acclimation capacity, which remains largely unknown. Rocky intertidal species are considered sentinels of climate change. Their physiological limits are close to environmental temperatures, which encourages the investigation of rocky shore species’ response to warmer conditions. This was the main goal of the present research. The thermal tolerance and acclimation capacity of tropical and temperate rocky shore species from different taxa were investigated. It was found that tropical species are the ones living closest to their thermal limits. In fact, tropical intertidal species already experience habitat temperatures above their thermal limits during heat waves. It was also found that tropical species have a lower acclimation capacity than their temperate counterparts. This means that tropical species may be vulnerable to even small increases in habitat temperature. Considering future warming trends, these findings suggest that tropical species may be in greater jeopardy than temperate ones. Probably, tropical intertidal species will take refuge in colder, subtidal waters, during extreme thermal events. However, if such refuges are unavailable and/or if genetic adaptation is not able to keep up with the warming rate, intertidal populations may be prone to local extinction. Thus, the assessment of the future impacts of climate warming upon communities’ structure and ecosystem dynamics shall include more species and transgenerational studies.
Keywords:
Global Climate Change, Thermal Tolerance, Acclimation Capacity, Critical ThermalAgradecimentos/Acknowledgements……….. iii
Resumo……….. v
Abstract………. ix
Chapter 1
General Introduction………...….……….……… 1
1. Thermal tolerance.……….….…..…..…. 3
2. Thermal acclimation………..……….……….….…..…. 4
3. Overview of thermal studies in ectotherms……….. 6
4. What species might be more vulnerable to climate warming, tropical or temperate?... 8
5. Aim of the thesis……….………..……….…….... 9
6. References……….……… 10
Chapter 2
Vulnerability of tropical and temperate coastal organisms to climate
change…...………..……….…….….. 15
Abstract.………...….…………. 17
Introduction………..……….………..….……. 18
Materials and Methods……….……... 20
Study areas and tested species………..….. 20
Acclimation conditions and experimental setup………..……… 22
Data analysis……….. 23
Results... 27
Overall response of decapod crustaceans and fish….………..…………. 27
Average CTMax………….……….………. 27
Intraspecific CTMax variation………. 31
Warming Tolerance..……… 31
Discussion……….……….………..……….…..…. 32
Chapter 3
Acclimation
capacity
of
tropical
and
temperate
coastal
organisms……….….…….……. 41
Abstract.……….………...………….… 43
Introduction………..……….………..….……. 44
Materials and Methods……….…… 46
Study areas and tested species………. 46
Acclimation conditions and experimental setup………..……… 47
Data analysis……….. 48
Results... 50
Acclimation capacity: tropical versus temperate species………..……… 52
Intraspecific variability.……….……… 54
Discussion……….……….………..……….…..…. 55
References………..……….. 58
Chapter 1
General Introduction
1. Thermal tolerance
Angilletta (2009) rightly stated that anyone familiar with physics and chemistry shouldn’t be impressed by the discovery that life depends on temperature. The temperature of an organism – a quantitative measure of the kinetic energy of its molecules – constrains the rates of chemical reactions, namely biochemical reactions. As a consequence, temperature affects cellular, systemic, and organismal levels (Rome et al., 1992) and potentially limits behavioral and physiological performances linked to development, growth and reproduction (Angilletta et al., 2002). The favorable range of temperature or performance breadth of a given species is referred to as thermal tolerance window. Above or below that range the performance is negatively affected and the survival of the species is at stake.
The threat of global climate change has fostered the current interest in understanding species’ thermal limits (e.g. Hofmann & Todgham 2010; Somero, 2010; Madeira et al., 2012a; Vinagre et al., 2013). Understanding the thermal limits of organisms and the plasticity of those limits enables us to argue about what will happen to their distribution and abundance during climate change (e.g. Stillman, 2002; Walther et al., 2002; Parmesan, 2006).
Two different experimental approaches are commonly used to determine the thermal tolerance of a species: a) the “static methods”, which determine the Lethal Temperature, i.e. the temperature that causes the death of 50% of the individuals in a sample (Stillman & Somero, 2000), and b) the “dynamic methods”, in which the temperature that triggers the loss of motor function (Critical Thermal Maximum or Knockdown Temperature) is determined by gradually increasing temperature until a critical point is reached (e.g. loss of the righting response, muscle spasms) (Brattstrom, 1968; Huey et al., 1992; Lutterschmidt & Hutchison, 1997).
The dynamic methods have been more broadly used because they are easier to apply, require fewer animals and provide quick data (Lutterschmidt & Hutchison, 1997). It is generally accepted that the Critical Thermal Maximum (CTMax) is the most efficient index of upper thermal tolerance among ectothermic vertebrates and invertebrates (Becker & Genoway, 1979). Based on the temperature at which the first signs of heat stress occur, CTMax represents the point at which the
Cox (1974) provided a comprehensive definition:
“The critical thermal maximum (or minimum) is the arithmetic mean of the collective thermal points at which locomotory activity becomes disorganized and the animal loses its ability to escape from conditions that will promptly lead to its death when heated from a previous acclimation temperature at a constant rate just fast enough to allow deep body temperatures to follow environmental temperatures without a significant time lag.”
In this way, the CTMax method provides a conservative index of thermal tolerance, as the organism does not die but is unable to escape from predators and forage due to equilibrium loss. Thus, results are more comparable to natural conditions (e.g. Bennett & Judd, 1992; Mora & Ospina, 2001; Vinagre et al., 2013).
2. Thermal acclimation
Assessing the capacity of organisms to acclimate and/or adapt to increased temperatures is crucial to understand the response of populations and communities to global warming. Hofmann & Todgham (2010) pointed out three main response options for organisms facing global climate change: (a) disperse to more hospitable habitats, (b) tolerate the new conditions through phenotypic and physiological plasticity, or (c) adapt to the new environment through genetic change via the process of evolution. All organisms can potentially modify their behavioral, physiological or morphological characteristics in response to environmental temperature (Angilletta, 2009). Phenotypic plasticity as a response is an important mechanism for coping with a changing or fluctuating environment and refers to thermal acclimation, i.e. any phenotypic alteration in physiology in response to environmental temperature that alters performance and plausibly enhances fitness (Huey et al., 1999; Angilletta, 2009).
Even though both rapid and gradual responses to environmental temperatures can be reversible, some responses remain fixed throughout the life of an organism (Johnston and Wilson, 2006). Following this idea, Angilletta (2009) distinguished between two types of thermal acclimation: (a) developmental acclimation, which encompasses irreversible responses to temperatures undergone throughout ontogeny, and (b) reversible acclimation, which comprises regulated responses to diel or seasonal shifts in temperature, thus offering a greater potential to match physiology to the current environment when compared to developmental acclimation.
Acclimation only benefits an organism when the time needed to acclimate doesn’t surpass the time between thermal switches. Therefore, reversible acclimation should benefit long-lived organisms which experience seasonal changes in temperature during their life and organisms which experience diel variations if acclimation and deacclimation occur rapidly (Angilletta, 2009). Regardless of this, acclimation responses have common properties, particularly the activation of molecules (e.g. genes, enzymes) responsible for a change in the phenotype due to the detection of environmental signals and subsequent transduction into a cellular response (Wilson & Franklin, 2002; Angilletta et al., 2006).
“Do most acclimation responses enhance the fitness of organisms or are these responses merely unavoidable consequences of thermal change?”
(Angilletta, 2009)
Acclimation has traditionally been assumed to be beneficial to organisms by compensating for the impacts of environmental change. This assumption that acclimation responses enhance fitness is known as the Beneficial Acclimation Hypothesis and predicts that a change in the environment of an organism leads to a change in the phenotype that improves performance in the new environment (Leroi et al., 1994).
A large body of evidence clearly demonstrates that acclimation enhances performance in some species (e.g. Kinne, 1962; Prosser, 1986; Cossins & Bowler, 1987; Rome et al., 1992). Nonetheless, responses to thermal change do not always enhance the performance of an organism and thus acclimation changes cannot just be assumed to be beneficial (e.g. Leroi et al., 1994; Huey
et al., 1999; Wilson & Franklin, 2002). As a matter of fact, beneficial acclimation is only one
possibility in a set of phenotypic responses to acclimation (Huey et al., 1999), which may in turn be inconsequential or even disadvantageous (Leroi et al., 1994). Moreover, the generality of the beneficial acclimation assumption should be rejected and the fact that acclimation imposes costs in terms of survivorship or fecundity to an organism (see Angilletta, 2009; Donelson et al., 2012) should be taken into consideration.
3. Overview of thermal studies in ectotherms
Early studies of thermal acclimation have focused on amphibians (e.g. Hutchison, 1961; Brattstrom & Lawrence, 1962; Brattstrom & Regal, 1965; Brattstrom, 1968) and reptiles (e.g. Wilhoft & Anderson, 1960; Hertz et al., 1983; Kaufmann & Bennett, 1989). The common ground of these studies was the investigation of animals’ ability to modify their functional capacities, particularly locomotor performance, to adjust to the thermal environment. Brattstrom (1968), although focusing on amphibians, stressed some important general conclusions: (a) the rate of thermal acclimation, measured by changes in the critical thermal maximum, is rapid, (b) the acclimation rate and range is a function of the temperature of acclimation, and (c) the inability to make rapid physiological adjustments might have distributional consequences. Corroborating Brattstrom (1968) conclusions, some recent studies with other ectotherms (e.g. Patterson, 1999; Huang et al., 2006; Gvoqdík et al., 2007) show that thermal acclimation significantly affects critical thermal maximum, i.e. CTMax shifts in accordance with acclimation temperature. Most of the terrestrial ectotherms used in these studies inhabit semi-arid or arid environments, extremely harsh habitats where temperatures and thermal amplitudes are very high.
Extremely thermally stressed environments also exist in the marine environment. Rocky intertidal habitats – regions between the high- and low-tide lines of coastlines – are subject to environmental challenges posed by both aquatic and aerial climatic regimes due to alternating exposures to sharp spatial and temporal gradients in temperature during the tidal cycle. The high thermal conductivity and heat capacity of water cause the body temperature of aquatic organisms to closely follow the temperatures of their aqueous surroundings (Spotila et al., 1992). Moreover, the small water volume of tidal pools in the rocky shore means that these environments have low thermal inertia and consequently will be one of the aquatic environments hardest hit by temperature rise, functioning as early indicators of climate warming (see Helmuth et al., 2006). Furthermore, a growing awareness that intertidal species are home to diverse biological communities and integral components of nearshore food webs (Horn et al., 1999) has led to an increased research on the vulnerability of rocky shore species threatened by climate warming, making the investigation of their thermal limits a pressing need (e.g. Stillman & Somero, 2000; Madeira et al., 2012a; Vinagre et al., 2013).
Upper thermal limits are already known for a considerable number of temperate marine coastal organisms, which inhabit rocky shores and estuaries (e.g. Cuculescu et al., 1998; Madeira et
al., 2012a, 2012b; Vinagre et al., 2013). Madeira et al. (2012a) and Vinagre et al. (2013) determined
the upper thermal limits of various fish and crustaceans of the Northeast Atlantic. Using the CTMax method, Madeira et al. (2012a) concluded that species from the intertidal/supratidal zones (e.g.
Gobius niger, Pachygrapsus marmoratus and Palaemon elegans) had higher CTMax values in
comparison to subtidal and demersal species (e.g. Diplodus species, Lophozozymus incisus and
Crangon crangon). Additionally, Vinagre et al. (2013) showed that pools in the lower intertidal have
temperatures well below the CTMax of the tidal pool species examined (which ranged from 32oC to
35oC), thus being a possible natural refuge during heat waves. As for acclimation capacity, Cuculescu
et al. (1998) tested the marine crabs Carcinus maenas (eurythermal) and Cancer pagurus
(stenothermal) from the North Sea. The authors found that in spite of the significantly higher CTMax of C. maenas, the acclimation ability was greater in C. pagurus, suggesting that the ability for acclimation is not directly related to eurythermicity. Notwithstanding, it is relevant that acclimation had a significant effect in both species.
Concerning the investigation of thermal tolerance in tropical marine organisms, Mora & Ospina (2001) investigated the thermal tolerance of 15 reef fishes of the tropical eastern Pacific and found that the CTMax of those species ranged between 34.7oC and 40.8oC. According to the authors,
the differences in CTMax among reef-fish species may confer different abilities to colonize warmer habitats, allowing, for instance, tolerant species (e.g. Mugil curema, Bathygobius ramosus and
Malacoctenus zonifer) to be common in intertidal pools that could reach 36oC, where other
less-tolerant species are infrequent or absent. In light of climate warming scenarios this may have implications in the distribution of reef-fish species. Additionally, Ospina & Mora (2004) studied the effect of body size on the thermal tolerance of seven reef fish species from the tropical eastern Pacific Ocean and verified little variation in CTMax ranging from juveniles to adults. This reduced intra-specific variation in thermal tolerance suggests limited capacity of species to adapt to extreme thermal conditions, thus raising concerns about current global changes in temperature. As regards tropical crustaceans, Stillman & Somero (2000) analyzed the upper thermal tolerance limits of species of porcelain crabs, genus Petrolisthes, from intertidal and subtidal habitats throughout the eastern Pacific. During thermal acclimation at elevated temperatures the upper thermal tolerance limits increased, the amount of increase being greater for subtidal than for intertidal species. This
result suggests that global warming might impact the distribution limits of intertidal species to a greater extent than that of subtidal species, even though many more species need to be tested.
4. What species might be more vulnerable to climate warming, tropical
or temperate?
Ecological forecasting on the likely impacts of climate warming is crucial at a time when several ecosystems seem to be responding to this environmental threat (Walther et al., 2002). Explicit hypotheses should be generated and tested. Among the most important questions to be tested are: which are the most vulnerable organisms to climate change and where are they?
A debate has emerged from studies on the effects of warming on ectotherms, arguing about which organisms may face a higher risk from environmental warming, tropical or temperate organisms. The tropics and temperate zones encompass most of the species found in the planet. Some studies predict that climate warming will have a small impact in the tropics (see Root et al., 2003), because the rate of warming is predicted to be lower than at higher latitudes (IPCC, 2007). However, it is known that species that live in aseasonal environments may suffer disproportionally from small increases in temperature, which may place tropical organisms at a higher risk than their temperate counterparts that endure larger thermal amplitudes throughout the year and thus presumably have a greater scope for acclimation (see Tewksbury et al., 2008).
The vulnerability towards a rise in temperature will depend mostly on the organisms’ thermal tolerance and acclimation capacity, which remains unknown for most species. As above mentioned, one of the habitats where climate change impacts may strike first is the intertidal zone. Rocky intertidal habitats exist at the margins between the terrestrial and the marine realms, thus they are not only subject to changes in water temperature, but also to changes in the aerial climatic regime. This way, intertidal communities offer excellent scientific material for studying climate warming impacts.
The works of Mora & Ospina (2001) and Madeira et al. (2012a) greatly contributed to the foregoing debate. Mora & Ospina (2001) warned that some tropical reef fishes may be severely threatened in a short-term temperature increase situation, not only by the low intraspecific variability in thermal tolerance, but also because generation time in reef fishes is slower than the time in which ocean is expected to attain higher temperatures. Yet, Madeira et al. (2012a) showed
that the CTMax of tropical intertidal species is 2 to 5oC higher than the maximum habitat
temperature, whereas that of temperate/subtropical species is 1 to 2oC lower. This suggests that
maximum habitat temperatures in temperate/subtropical regions may surpass the upper thermal limits of temperate intertidal species, making them particularly vulnerable to further increases in temperature and possibly more vulnerable than tropical species.
Evolutionarily, the foreseen rise in habitat temperature due to climate change is predicted to be rapid and organisms inhabiting ecosystems already subject to local thermal stress may not be able to adapt in pace with the new thermal regime. During the last century the mean global temperature increased by 0.6oC and an increase of 2 to 4oC – by consensus 3oC (Kerr, 2004) – by the
end of this century is predicted, which means that many ecosystems are currently warming faster than they have for thousands of years (IPCC, 2007). As such, the projected warming rate for this century of nearly five times the rate of the previous one might have startling consequences for ecosystems and biodiversity. Nevertheless, organisms, populations and ecological communities do not respond to approximated global averages. Regional changes are more relevant in the context of ecological responses to climatic change, and the asymmetry in the warming in many regions will surely lead to different ecological responses (see Walther et al., 2002). Therefore, assessing the vulnerability of species to climate warming is an urgent need, as is being able to prioritize conservation efforts based on where species are more vulnerable around the globe.
5. Aim of the thesis
The aim of present study was to estimate the thermal tolerance and acclimation capacity of tropical and temperate rocky shore species from different taxa, so as to infer and compare their vulnerability to climate warming. This research contributes to the international debate on which organisms might face a higher risk from climate change: tropical or temperate.
To this end, sampling and laboratory experiments were carried out in a tropical coastal area, the Brazilian coast, at approximately 20oS, and in a temperate coastal area, the Portuguese coast,
at approximately 38oN. An important number of common tropical and temperate species were
tested under controlled conditions, allowing a multi-specific study of thermal tolerance and acclimation capacity.
Specifically, the objectives of this thesis were to:
1) Estimate the upper thermal limits (CTMax) of tropical and temperate rocky shore organisms, in order to understand which species are living closest to their thermal limits and to discuss what might happen to the distribution and abundance of those species during climate warming;
2) Compare the intraspecific variability in upper thermal limits of tropical and temperate species to hypothesize which ones have the lowest evolutionary potential to cope with further warming;
3) Test the capacity of tropical and temperate organisms to acclimate their upper thermal limits when exposed to long-term and short-term increases in temperature, so as to understand whether species’ tolerance limits can keep in pace with the changing environment.
This thesis is presented in the form of two scientific articles (already submitted to indexed scientific journals), the first one concerning thermal tolerance and the second one concerning acclimation capacity.
6. References
Angilletta MJ (2009) Thermal Adaptation. A Theoretical and Empirical Synthesis. Oxford, Oxford University Press.
Angilletta MJ, Bennet AF, Guderley H, Navas CA, Seebacher F, Wilson RS (2006) Coadaptation: a unifying principle in evolutionary thermal biology. Physiological and Biochemical Zoology, 79, 282–294. Angilletta MJ, Niewiarowski PH, Navas CA (2002) The evolution of thermal physiology in ectotherms. Journal
of Thermal Biology, 27, 249–268.
Becker CD, Genoway RG (1979) Evaluation of the critical thermal maximum for determining thermal tolerance of freshwater fish. Environmental Biology of Fishes, 4, 245–256.
Bennett WA, Judd FW (1992) Comparison of methods for determining low temperatures tolerance, experimental with Pinfish, Lagodon rhomboides. Copeia, 1992, 1059–1065.
Brattstrom BH (1968) Thermal acclimation in Anuran amphibians as a function of latitude and altitude. Comparative Biochemistry and Physiology, 24, 93–111.
Brattstrom BH, Lawrence P (1962) The rate of thermal acclimation in anuran amphibians. Physiological Zoology, 35, 148–156.
Brattstrom BH, Regal P (1965) Rate of thermal acclimation in the Mexican salamander, Chiropterotriton. Copeia, 1965, 514–515.
Cooper BS, Williams BH, Angilletta MJ (2008) Unifying indices of heat tolerance in ectotherms. Journal of Thermal Biology, 33, 320– 323.
Cossins AR, Bowler K (1987) Temperature biology of animals. Chapman & Hall, New York, New York.
Costanza R, d'Arge R, de Groot R, Farber S, Grasso M, et al. (1998) The value of the world's ecosystem services and natural capital. Ecological Economics, 25, 3-15.
Cox DK (1974) Effects of three heating rates on the critical thermal maximum of bluegill. In: Thermal Ecology (eds Gibbons JW, Sharitz RR) US Atomic Energy Commission, Savannah, GA, pp. 158–163.
Cuculescu M, Hyde D, Bowler K (1998) Thermal tolerance of two species of marine crab, Cancer pagurus and Carcinus maenas. Journal of Thermal Biology, 23, 107–110.
Deere JA, Chown SL (2006) Testing the Beneficial Acclimation Hypothesis and Its Alternatives for Locomotor Performance. The American Naturalist, 168, 630–644.
Donelson JM, Munday PL, Mccormick MI, Nilsson GE (2012) Acclimation to predicted ocean warming through developmental plasticity in a tropical reef fish. Global Change Biology, 17, 1712–1719.
Gvoqdík L, Puky M, Sugerková M (2007) Acclimation is beneficial at extreme test temperatures in the Danube crested newt, Triturus dobrogicus (Caudata, Salamandridae). Biological Journal of the Linnean Society, 90, 627–636.
Helmuth B, Moore P, Mieszkowska N, Hawkins SJ (2006) Living on the Edge of Two Changing Worlds: Forecasting the Responses of Rocky Intertidal Ecosystems to Climate Change. Annual Review of Ecology, Evolution, and Systematics, 37, 373–404.
Hertz PE, Huey RB, Nevo E (1983) Homage to Santa Anita: thermal sensitivity of sprint speed in Agamid lizards. Evolution, 37, 1075–1084.
Hofmann GE, Todgham AE (2010) Living in the Now: Physiological Mechanisms to Tolerate a Rapidly Changing Environment. Annual Review of Physiology, 72, 127–145.
Horn MH, Martin KLM, Chotkowski MA (1999) Intertidal Fishes. Life in Two Worlds. Academic Press.
Huang SP, Hsu YY, Tu MC (2006) Thermal tolerance and altitudinal distribution of two Sphenomorphus lizards in Taiwan. Journal of Thermal Biology, 31, 378–385.
Huey RB, Berrigan D, Gilchrist GW, Herron JC (1999) Testing the Adaptive Significance of Acclimation: A Strong Inference Approach. American Zoologist, 39, 323–336.
Huey RB, Crill WD, Kingsolver JG, Weber KE (1992) A method for rapid measurement of heat or cold resistance of small insects. Functional Ecology, 6, 489–494.
Huey RB, Stevenson RD (1979) Integrating thermal physiology and ecology of ectotherms: a discussion of approaches. American Zoologist, 19, 357–366.
Hutchison VH (1961) Critical thermal maxima in salamanders. Physiological Zoology, 34, 92–125.
Intergovernmental Panel on Climate Change (2007) Climate Change 2007: Synthesis Report. Fourth Assessment Report of the Intergovernmental Panel on Climate Change. Pachauri RK, Reisinger A (Eds.), IPCC, Geneva, Switzerland, pp 104
Johnston IA, Wilson RS (2006) Temperature induced developmental plasticity in ectotherms. In: Warburton SJ, Burggren WW, Pelster B, Reiber CL, Spicer J (Eds.) Oxford University Press, pp. 124–138.
Kaufmann JS, Bennett AF (1989) The Effect of Temperature and Thermal Acclimation on Locomotor Performance in Xantusia vigilis, the Desert Night Lizard. Physiological Zoology, 62, 1047–1058. Kerr R (2004) Three degrees of consensus. Science, 305, 932–34.
Kinne O (1962) Irreversible nongenetic adaptation. Comparative Biochemistry and Physiology, 5, 265–282. Leroi AM, Bennet AF, Lenski RE (1994) Temperature acclimation and competitive fitness: An experimental test
of the beneficial acclimation assumption. Proceedings of the National Academy of Sciences, 91, 1917– 1921.
Lutterschmidt WI, Hutchison VH (1997) The critical thermal maximum: history and critique. Canadian Journal of Zoology, 75, 1561–1574.
Madeira D, Narciso L, Cabral H, Vinagre C (2012a) Thermal tolerance and potential impacts of climate change on coastal and estuarine organisms. Journal of Sea Research, 70, 32–41.
Madeira D, Narciso L, Cabral H, Vinagre C, Diniz MS (2012b) Thermal tolerance of the crab Pachygrapsus marmoratus: intraspecific differences at a physiological (CTMax) and molecular level (Hsp70). Cell Stress and Chaperones, 17, 707–716.
Meehl GA, Stocker TF, Collins WD, Friedlingstein P, Gaye AT et al. (2007) The physical science basis. Contrib. Work. Group Assess. Rep. Intergov. Panel Climate Change, IVth. Cambridge, Cambridge University Press.
Mora C, Ospina A (2001) Tolerance to high temperatures and potential impact of sea warming on reef fishes of Gorgona Island (tropical eastern Pacific). Marine Biology, 139, 765–769.
Ospina AF, Mora C (2004) Effect of body size on reef fish tolerance to extreme low and high temperatures. Environmental Biology of Fishes, 70, 339–343.
Parmesan C (2006) Ecological and evolutionary responses to recent climate change. Annual Reviews in Ecology and Evolution Systems, 37, 637–669.
Patterson JW (1999) Emergence, basking behaviour, mean selected temperature and critical thermal minimum in high and low altitude subspecies of the tropical lizard Mabuya striata. African Journal of Ecology, 37, 330–339.
Prosser CL (1986) Adaptational biology: Molecules to organisms. John Wiley & Sons, New York, New York. Rome LC, Stevens ED, John-Alder HB (1992) The influence of temperature and thermal acclimation on
physiological function. In: Environmental Physiology of the amphibians (eds Feder ME, Burggren WW), Chicago, University Chicago Press, pp. 183–205.
Root TL, Price JT, Hall KR, Schneider SH, Rosenzweig C, Pounds JA (2003) Fingerprints of global warming on wild animals and plants. Nature, 421, 57–60.
Somero GN (2010) The physiology of climate change: how potentials for acclimatization and genetic adaptation will determine ‘winners’ and ‘losers’. Journal of Experimental Biology, 213, 912–920. Spotila JR, O'Connor MP, Bakken GS (1992) Biophysics of heat and mass transfer. In: Environmental Physiology
Stillman JH (2002) Causes and Consequences of Thermal Tolerance Limits in Rocky Intertidal Porcelain Crabs, Genus Petrolisthes. Integrative and Comparative Biology, 42, 790–796.
Stillman JH, Somero GN (2000) A comparative analysis of the upper thermal tolerance limits of eastern pacific porcelain crabs, genus Petrolisthes: influences of latitude, vertical zonation, acclimation, and phylogeny. Physiological and Biochemical Zoology, 73, 200–208.
Tewksbury JJ, Huey RB, Deutsch CA (2008) Putting the Heat on Tropical Animals. Ecology, 320, 1296–1297. Vinagre C, Dias M, Roma J, Silva A, Madeira D, Diniz M (2013) Critical thermal maxima of common rocky
intertidal fish and shrimps – a preliminary assessment. Journal of Sea Research, 81, 10–12.
Walther G-R, Post E, Convey P, Menzel A, Parmesan C, Beebee TJC, Fromentin J-M, Hoegh-Guldberg O, Bairlein F (2002) Ecological responses to recent climate change. Nature, 416, 389–395.
Wilhoft DC, Anderson JD (1960) Effect of Acclimation on the Preferred Body Temperature of the Lizard, Sceloporus occidentalis. Science, 131, 610–611.
Wilson RS, Franklin CE (2002) Testing the beneficial acclimation hypothesis. Trends in Ecology & Evolution, 17, 66–70.
Chapter 2
Vulnerability of tropical and temperate coastal organisms
to climate change
Vulnerability of tropical and temperate coastal organisms
to climate change
Abstract
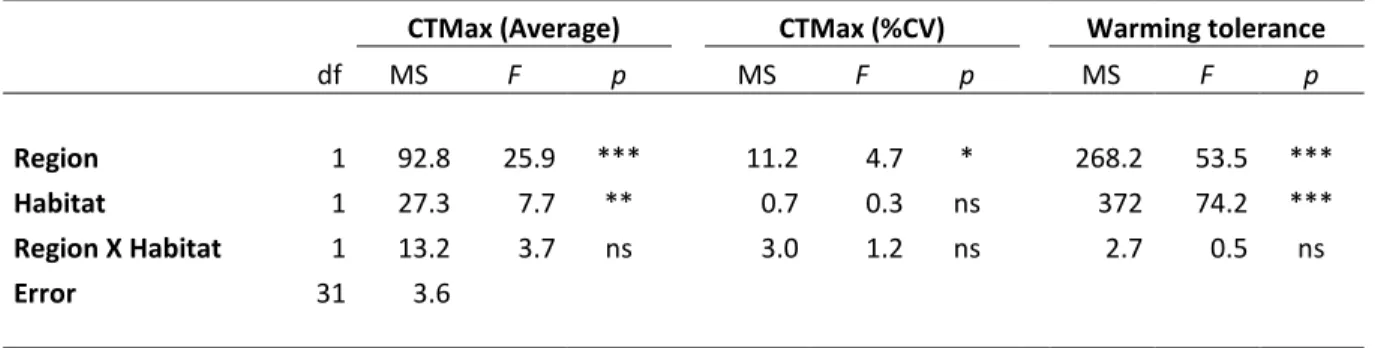
The threat of global climate change has fostered the current interest in understanding species’ thermal limits. Rocky shores are predicted to be one of the habitats hardest hit by temperature rise, making its inhabiting communities excellent experimental material for climate warming studies. The aim of the present work was to 1) estimate the upper thermal limits (CTMax), 2) the intraspecific variability in upper thermal limits (% coefficient of variation of CTMax), and 3) the warming tolerance (Maximum Habitat Temperature – CTMax) of coastal organisms. Differences in biological groups (decapod crustaceans vs fish) were investigated and the effect of region (tropical
vs temperate) and habitat (intertidal vs subtidal) was tested. Specimens were collected and tested
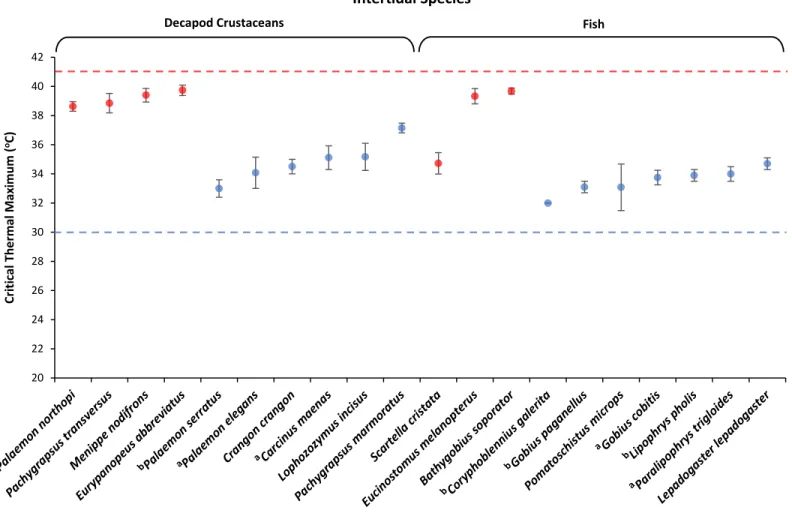
during the summer of 2014, in Southeastern Brazil and Western Portugal. No differences were found when comparing decapod crustaceans and fish. CTMax was higher for tropical (34.2oC to 39.7oC)
than temperate species (27.4oC to 38oC) and also higher for intertidal than subtidal species.
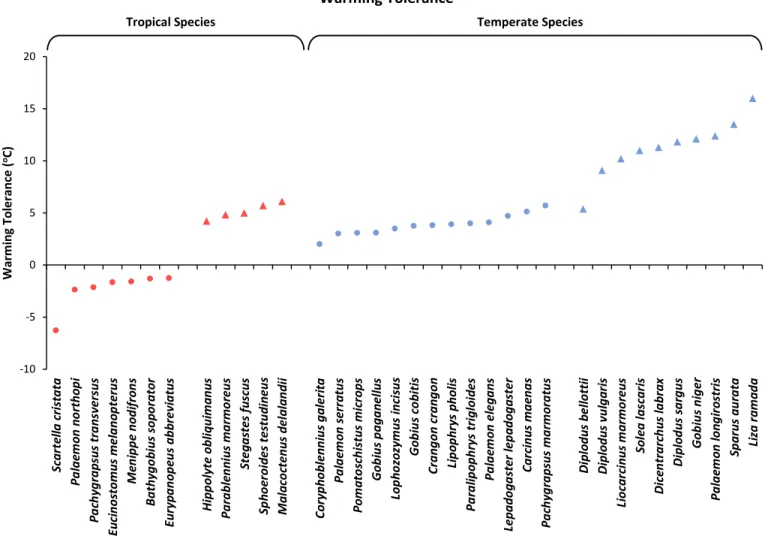
Intraspecific variability was higher in temperate species than in tropical species, but no difference was found between intertidal and subtidal species. Warming tolerance was higher for temperate species than for tropical species and higher for subtidal species than for intertidal species. This study confirms previous reports that stated that the species with the highest thermal limits have the lowest warming tolerance. Our results strongly suggest that tropical intertidal species are the ones in greatest jeopardy considering current climate warming trends. This study contributes to the ongoing scientific debate on which organisms face a higher risk from climate warming: tropical or temperate.
Keywords:
Global Climate Change, Upper Thermal Limits, Critical Thermal Maximum, Warming Tolerance, Rocky Shore.Introduction
Temperature is arguably the most critical abiotic stress that ectothermic organisms experience, affecting biological processes at all organization levels (Rome et al., 1992) and limiting behavioral and physiological performances linked to development, growth and reproduction (Angilletta et al., 2002). Temperature is thus one of the key factors responsible for setting ecological patterns in nature (Hutchins, 1947).
During the last century temperature increased 0.6oC globally and an increase of 2 to 4oC by
the end of this century is predicted, which means that many ecosystems are currently warming faster than they have for thousands of years (IPCC, 2007). In fact, ecological responses to recent climate change are already clearly visible (see reviews by Walther et al., 2002; Hofmann & Todgham, 2010). Evidence from polar terrestrial to tropical marine environments indicates that the warming for the past decades has affected the phenology of organisms (e.g. Bairlein & Winkel, 2001; Menzel & Estrella, 2001), the range and distribution of species (e.g. Hughes, 2000; McCarty, 2001; Walther
et al., 2001), and the composition and dynamics of communities (e.g. Sagarin et al., 1999; Walther,
2000). As such, the predicted warming for the coming decades might have startling consequences for ecosystems and biodiversity.
Notwithstanding, organisms, populations and ecological communities do not respond to global averages. Instead, regional changes are more relevant in the context of ecological responses to climatic change (see review by Walther et al., 2002). In this regard, the Intergovernmental Panel on Climate Change (2007) predicted an asymmetry in the rate of warming around the globe, with higher latitudes warming faster than lower latitudes. This raises issues on which organisms may face a higher risk from environmental warming, and a scientific debate on the vulnerability of tropical
versus temperate organisms has arisen (e.g. Tewksbury et al., 2008; Deutsch et al., 2008; Duarte et al., 2012).
The impacts of climate warming on organisms depend primarily on the behavior, morphology, physiology, and ecology of the organisms in question (Kearney and Porter 2004; Helmuth et al., 2005; Bradshaw & Holzapfel, 2008), with negative impacts being greatest on individuals physiologically specialized to narrow temperatures and with limited acclimation capacity.
One way to answer this debate involves estimating geographical patterns of warming tolerance, which is the difference between a species’ upper thermal limit and its current Maximum
Habitat Temperature (MHT) (Lutterschmidt & Hutchison, 1997; Somero, 2005; Deutsch et al., 2008). Low warming tolerance indicates that individuals of a given species may be prone to deleterious and ultimately lethal thermal stress with rising temperatures. Several studies indicate that tropical organisms may face a higher risk than their temperate counterparts since they live at “near-stressful temperatures” and because they have evolved in stable environments, being thermal specialists (see Tewksbury et al., 2008). The work of Duarte et al. (2012) with tropical tadpoles supports this hypothesis, but only in part. The authors stressed that the rate of warming is predicted to be faster in the temperate zone, which means that a large warming tolerance in the temperate zone may not be as helpful as it would if warming was uniform among different latitudes (Hoffmann, 2010). Supporting this, Madeira et al. (2012) showed that maximum habitat temperatures in temperate/subtropical regions may surpass the upper thermal limits of temperate intertidal species, making them particularly vulnerable to further increases in temperature and possibly more vulnerable than tropical ones.
Thus, knowing the upper thermal limits of a given species and the extent to which predicted climate warming will affect these limits is an important endeavor to assess species’ vulnerability to this threat. The Critical Thermal Maximum (CTMax) is a widely used index to quantify upper thermal limits among ectothermic vertebrates and invertebrates (e.g. Becker & Genoway, 1979; Mora & Ospina, 2001; Madeira et al., 2012). Based on the temperature at which the first signs of heat stress occur, CTMax represents the point at which the animal is ecologically or behaviorally dead (Brattstrom, 1968). The CTMax is determined by gradually increasing temperature until a critical point is reached (e.g. loss of the righting response, muscle spasms) (Brattstrom, 1968; Huey et al., 1992; Lutterschmidt & Hutchison, 1997; Mora & Ospina, 2001). As such, the CTMax provides a conservative measure of thermal tolerance and allows for an accurate prediction of the responses of organisms to natural conditions (Bennett & Judd, 1992).
The rocky intertidal zone and its inhabiting communities offer excellent experimental material for climate warming studies (see review by Helmuth et al., 2006). Hiatt & Strasburg (1960) had previously observed the importance of temperature in tropical rock pools, reporting that in the Marshall Islands they heated to 41oC, when air temperatures reached at most 31oC, leading to the
death of some fish inside the pools. These habitats are subject to extreme thermal challenges due to alternating exposures to sharp spatial and temporal gradients during the tidal cycle. Additionally, the small water volume of tidal pools in the rocky shore means that these environments have low
thermal inertia and consequently will be one of the aquatic environments hardest hit by temperature rise, functioning as early indicators of climate warming (see reviews by Helmuth et al., 2006; Hofmann & Todgham, 2010).
Also, the thermal niche occupied by species seems to be a major determinant of thermal tolerance and cellular response to increasing temperature (Stillman & Somero, 2000; Stillman, 2003; Madeira et al., 2012, 2014a). This means that upper thermal tolerance limits reflect microhabitat conditions, with intertidal species showing higher CTMax values than subtidal and demersal species (Madeira et al., 2012). However, intertidal species may currently be living closer to their thermal limits and may have reduced ability to increase their thermal tolerance when compared to subtidal species (Stillman & Somero, 2000; Madeira et al., 2012; Vinagre et al., 2013a). Therefore, further research on thermal tolerance limits of coastal organisms from different thermal niches would greatly improve our understanding of the effects of global warming.
Another important aspect is intraspecific variability. Species with enough genetic variability to generate phenotypes with a wide range of thermal tolerances may become “winners” in a warming world, since exceptionally tough individuals can be selected through successive generations resulting in genetic adaptation (Somero, 2010).
The aim of the present work was to 1) estimate the upper thermal limits (CTMax), 2) the intraspecific variability in upper thermal limits (% coefficient of variation of CTMax), and 3) the warming tolerance (MHT – CTMax) of coastal organisms. Differences in biological groups (crustacean decapods vs fish) were investigated and the effect of region (tropical vs temperate) and habitat (intertidal vs subtidal) was tested.
Materials and methods
Study areas and tested species
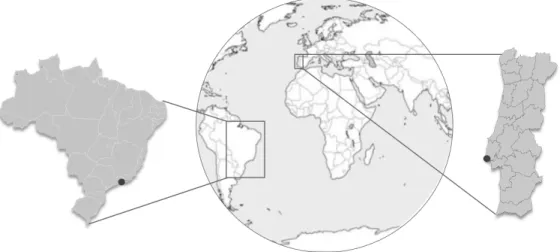
Marine decapod crustaceans (shrimps and crabs) and fish were collected in a tropical and a temperate rocky shore, in the summer of 2014 in Southeastern Brazil (23o49’ S; 45o25’ W) and
Western Portugal (38o71′ N; 9o48′ W) (Fig. 1). Specimens were collected manually and using hand
The tropical area studied has a mean annual sea surface temperature (SST) of 24oC and a
mean summer SST of 26oC, while the temperate study area has a mean annual SST of 17oC and a
mean summer SST of 19oC (Locarnini et al., 2009). Data on maximum SST was gathered from local
meteorological stations (30oC for the tropical area and 22oC for the temperate area). Data on
maximum water temperature of tidal pools was registered in the summer of 2014, in both areas, during ebb tides, in 9 tidal pools in the tropical study area and 16 in the temperate study area. The maximum water temperature registered in tropical tidal pools was 41oC, in February 2014, while in
the temperate area it was 30oC, in June 2014.
The tropical decapod crustacean species studied can be divided in two groups: the shrimps
Palaemon northropi (Rankin 1898) and Hippolyte obliquimanus Dana 1852, and the crabs Pachygrapsus transversus (Gibbes 1850), Menippe nodifrons Stimpson 1859 and Eurypanopeus abbreviatus (Stimpson 1860). The tropical fish species studied were Scartella cristata (Linnaeus
1758), Eucinostomus melanopterus (Bleeker 1863), Bathygobius soporator (Valenciennes 1837),
Parablennius marmoreus (Poey 1876), Stegastes fuscus (Cuvier 1830), Sphoeroides testudineus
(Linnaeus 1758) and Malacoctenus delalandii (Valenciennes 1836).
The temperate decapod crustacean species studied were the shrimps Crangon crangon (Linnaeus 1758) and the crabs Lophozozymus incisus (Milne-Edwards 1834) and Pachygrapsus
marmoratus (Fabricius 1787). The temperate fish species studied were Lepadogaster lepadogaster
(Bonnaterre 1788) and Pomatoschistus microps (Krøyer 1838). Data for temperate species was
Fig. 1 – Schematic representation of the study areas. Sampling sites’ location is illustrated by dot icons.
completed with that published in Madeira et al. (2012) (which includes the following species: the shrimps Palaemon longirostris (Milne-Edwards 1837) and Palaemon elegans (Rathke 1837); the crabs Carcinus maenas (Linnaeus 1758) and Liocarcinus marmoreus (Leach 1814); and the fish
Dicentrarchus labrax (Linnaeus 1758), Diplodus bellottii (Steindachner 1882), Diplodus sargus
(Linnaeus 1758), Diplodus vulgaris (Geoffroy St. Hilaire 1817), Gobius cobitis (Pallas 1814), Gobius
niger (Linnaeus 1758), Liza ramada (Risso 1827), Paralipophrys trigloides (Valenciennes 1836) and Solea lascaris (Risso 1810)), Vinagre et al. (2013a) (which includes the following species: the shrimp Palaemon serratus (Pennant 1777), and the fish Coryphoblennius galerita (Linnaeus 1758), Gobius paganellus Linnaeus, 1758 and Lipophrys pholis (Linnaeus 1758)) and Madeira et al. (2014b) (which
includes data for Sparus aurata Linnaeus 1758) for a comprehensive comparison that includes all species ever tested in these study areas, following the same experimental protocols.
This study focused on these species because they are key species in the intertidal/subtidal ecosystems they inhabit.
Acclimation conditions and experimental setup
After collection, organisms were transported to the laboratory facilities and housed in indoor re-circulating aquaria with a constant temperature (the same as the habitat temperature found at the time of capture, 26oC for tropical organisms and 20oC for temperate ones), aerated sea water
and salinity 35‰. The water dissolved O2 level varied between 95% and 100%. The organisms were
acclimated for seven days (at 26oC – tropical organisms; at 20oC – temperate organisms) to ensure
that all had a similar recent thermal history. They were fed ad libitum once a day, with commercial shrimp, and starved 24 hours before the experiments.
The thermal tolerance of each species was determined using the dynamic method described in Mora & Ospina (2001). The parameter measured was the Critical Thermal Maximum (CTMax, given in degrees Celsius), which is defined as the “arithmetic mean of the collective thermal points at which the end-point is reached” (Mora & Ospina, 2001), the end-point being loss of equilibrium. In shrimp and fish, loss of equilibrium was detected when individuals could not coordinate straight swimming and start moving in an angled position. Crabs needed to be stimulated using lab tweezers to force them upside down, and if they were unable to get back upright they would have reached the end-point. This criteria is the same followed by Madeira et al. (2012, 2014b) and Vinagre et al. (2013a).
To determine the CTMax, the organisms were subjected to a thermostatized bath. During the experiment, animals were exposed to a constant rate of water-temperature increase of 1°C h-1, with
constant aeration and observed continuously, until they reached the end-point. The experiments were carried out in shaded day light (14 L; 10D). The temperature at which each animal reached its end-point was measured with a digital thermometer, registered and then CTMax, its standard deviation and coefficient of variation were calculated.
To prevent any additional handling stress, the total length and weight of all individuals were measured at the end of the experiment. Fish were measured with an ichthyometer and shrimp and crabs with a digital slide caliper. The main characteristics of the species studied, and respective sample sizes, are shown in Table 1. Sample sizes were similar to those used by Mora & Ospina (2001), Madeira et al. (2012) and Vinagre et al. (2013a).
Data analysis
The upper thermal limits for each species were calculated using the equation: CTMax (species) = ∑ (Tend−point n)/n
Where Tend-point is the temperature at which the end-point was reached for any given
individual, and n stands for sample size.
To determine intraspecific variability of the CTMax, the coefficient of variation (in percentage) was calculated for each species:
%CV = (SD/Mean) x 100
Finally, the warming tolerance, i.e. the difference between CTMax and Maximum Habitat Temperature, provided an estimate on how closer these species may live to their upper thermal limits.
Tropical Species Common name Distribution Environment Sample size Total length (mm) Mean ± SD
Palaemon northropi Cross-banded grass
shrimp Western Atlantic Shallow waters/tide pools 16 30.75 ± 5.23
Hippolyte obliquimanus Atlantic shrimp Western Atlantic Subtidal coastal waters 10 13.09 ± 2.58
Eurypanopeus abbreviatus Lobate mud crab Western Atlantic Shallow waters/tide pools 8 16.50 ± 2.32
Menippe nodifrons Cuban stone crab Western and Eastern Atlantic Shallow waters/tide pools 6 23.66 ± 4.80
Pachygrapsus transversus Mottled shore crab Western and Eastern Atlantic Shallow waters/tide pools 20 12.75 ± 2.31
Bathygobius soporator Frillfin goby Western and Eastern Atlantic;
Mediterranean Sea Shallow waters/tide pools 15 54.80 ± 8.49
Scartella cristata Molly miller Western and Eastern Atlantic;
Northwest Pacific; Mediterranean Sea Shallow waters/tide pools 8 146.50 ± 31.25
Eucinostomus melanopterus Flagfin mojarra Western and Eastern Atlantic Shallow waters/tide pools 35 10.80 ± 2.01
Parablennius marmoreus Seaweed blenny Western Atlantic Subtidal coastal waters 5 64.20 ± 14.41
Malacoctenus delalandii Brazilian blenny Western Atlantic Subtidal coastal waters 6 65.66 ± 3.20
Stegastes fuscus Brazilian damsel Western and Eastern Atlantic Subtidal coastal waters 6 129.16 ± 16.55
Sphoeroides testudineus Checkered puffer Western Atlantic Subtidal coastal waters 4 122.0 ± 19.64
Table 1 – Common name, distribution, environment, sample size and mean total length (mm) for each species, in the present study. This table
was constructed based on Fishbase (www.fishbase.com), Encyclopedia of life (www.eol.org) and World Register of Marine Species (www.marinespecies.org).
Temperate Species Common name Distribution Environment Sample size Total length (mm) Mean ± SD
aPalaemon elegans Rock pool prawn
North and South Atlantic;
Mediterranean Sea; Black Sea; Baltic Sea
Shallow waters/tide pools 25 32.52 ± 7.34
bPalaemon serratus Common prawn North Atlantic; Mediterranean Sea;
Baltic Sea Shallow waters/tide pools 7 41.70 ± 7.00
Crangon crangon Brown shrimp North Atlantic; Mediterranean Sea Shallow waters/tide pools 5 26.80 ± 6.14
aPalaemon longirostris Delta prawn North Atlantic; Mediterranean Sea;
Black Sea Subtidal coastal waters 14 43.79 ± 8.94
aCarcinus maenas Green crab
North and South Atlantic;
Mediterranean Sea; Indian Ocean; North Pacific
Shallow waters/tide pools 25 28.65 ± 5.80
Pachygrapsus marmoratus Marbled rock crab Eastern Atlantic; Mediterranean Sea;
Black Sea Shallow waters/tide pools 10 17.50 ± 2.80
Lophozozymus incisus Montagu's crab Eastern Atlantic; South Pacific; Indian
Ocean Shallow waters/tide pools 6 19.33 ± 1.75
aLiocarcinus marmoreus Marbled swimming crab North Atlantic; Mediterranean Sea Subtidal coastal waters 7 22.35 ± 2.74
aGobius cobitis Giant goby North Atlantic; Mediterranean Sea;
Black Sea Shallow waters/tide pools 4 46.00 ± 29.41
aParalipophrys trigloides Eastern Atlantic; Mediterranean Sea Shallow waters/tide pools 9 67.33 ± 28.26
bLipophrys pholis Shanny Eastern Atlantic; Mediterranean Sea Shallow waters/tide pools 12 79.50 ± 38.50
bGobius paganellus Rock goby Eastern Atlantic; Mediterranean Sea;
Black Sea; Indian Ocean Shallow waters/tide pools 8 48.50 ± 4.20
bCoryphoblennius galerita Montagu's blenny Eastern Atlantic; Mediterranean Sea;
Black Sea Shallow waters/tide pools 6 77.80 ± 14.20
Lepadogaster lepadogaster Shore clingfish Eastern Atlantic; Mediterranean Sea;
Black Sea Shallow waters/tide pools 6 56.33 ± 11.74
Pomatoschistus microps Common goby Eastern Atlantic; Mediterranean Sea;
Baltic Sea Shallow waters/tide pools 6 32.00 ± 3.16
aGobius niger Shadow goby North Atlantic; Mediterranean Sea;
Black Sea Subtidal coastal waters 9 98.70 ± 6.36
cSparus aurata Gilthead seabream Eastern Atlantic; Mediterranean Sea;
Black Sea Subtidal coastal waters 6 92.10 ± 8.10
aLiza ramada Thin-lipped grey mullet Eastern Atlantic; Mediterranean Sea;