Data Analytics Mechanisms for Sports’
Related Data Retrieval and Multimedia
Augmentation
Tiago André Pérola Filipe
Mestrado Integrado em Engenharia Informática e Computação
Supervisor: Maria Teresa Magalhães da Silva Pinto de Andrade Second Supervisor: Maria Carvalho Goreti Marreiros
Retrieval and Multimedia Augmentation
Tiago André Pérola Filipe
Mestrado Integrado em Engenharia Informática e Computação
For many years, sports have been and are still a part of our lives, whether as players or as spec-tators. In this context, the diffusion and massification of platforms for multimedia content visual-ization have made the consumption of these same contents widespread.
In the meantime, there is more and more information available about clubs, players, matches, and competition venues, which is used in addition to the game itself. Thus, it is relevant to apply mechanisms to collect these data and extract valuable information from it, such as the odds of a team winning a game, or knowing what team is best suited to play against the opponent. The next step is to present this information, in which the target audience is composed of sports or-ganization’s staff and the spectators. For the staff, the information is in the form of reports, and for the spectators is presented as an overlay above the game transmission, without there being a perceptible intrusion on the main content.
Throughout this dissertation, it was implemented a full business intelligence pipeline in order to extract more value from the collected data. The data collected is from soccer and basketball, more precisely from the National Basketball Association (NBA) and the English Premier League (EPL). After the integration of data into a multidimensional database, several layers of analysis were applied to the data: Business Intelligence (BI) Reporting, Machine Learning (ML), and Simulation. The results of these methodologies were used to feed the multimedia augmentation layer.
BI allowed an exploratory data analysis, which was the source of content for the overlays. ML was applied to predict game outcomes, in which the algorithms used were: decision tree, support vector machine, random forest, extremely randomized trees, and extreme gradient boosting. The best accuracy was achieved with the SVM for basketball and with the extreme gradient boosting for soccer, with values of 67.96% and 54.44% respectively. In order to forecast outcomes a basketball simulation system was developed. This system allows for play-by-play simulation of a game and achieved a performance of 64.80%. The system also supports the positioning of various informational overlays, with game statistics, on a video stream, either live or on demand.
The ML models exceeded the performance of many works found in the literature, which so-lidifies the potential impact of the dissertation work herein developed. Furthermore, simulation creates value to the state of the art, since few articles describe in detail the development of a sports simulator.
Durante muitos anos, o desporto fez e continua a fazer parte das nossas vidas, seja como jogadores ou como espectadores. Neste contexto, a difusão e massificação de plataformas para visualização de conteúdo multimédia alargou o consumo destes mesmos conteúdos.
Enquanto isso, há mais e mais informações disponíveis sobre clubes, jogadores, jogos e locais de competição, que são usados como adição ao próprio jogo. Deste modo, é relevante aplicar mecanismos para armazenar esses dados e extrair informação útil deles, como a probabilidade de uma equipa vencer um jogo, ou se saber qual a equipa mais adequada para jogar contra o adversário. O próximo passo é apresentar essa informação, que tem como público-alvo o staff das organizações desportivas e os espectadores. Para o staff é na forma de relatórios, e para os espectadores na forma de overlay por cima da transmissão do jogo, sem que haja uma intrusão percetível no conteúdo principal.
Nesta dissertação foi implementada uma pipeline de business intelligence com a intenção de extrair maior valor dos dados armazenados. Os dados armazenados são de futebol e basquete-bol, mais precisamente da National Basketball Association (NBA) e da English Premier League (EPL). Após a integração dos dados numa base de dados multidimensional, várias camadas de análise foram aplicadas aos dados: Business Intelligence (BI) Reporting, Machine Learning (ML) e simulação. Os resultados destas metodologias foram utilizados para construir uma base de in-formação de suporte à camada multimédia.
BI permitiu uma análise exploratória dos dados, que foi a fonte do conteúdo dos overlays. ML foi aplicado para prever os resultados dos jogos, em que os algoritmos foram: decision tree, support vector machine, random forest, extremely randomized trees e extreme gradient boosting. A melhor accuracy foi obtida com o modelo SVM para o basquetebol e com o extreme gradient boosting para o futebol, com valores de 67.96% e 54.44% respetivamente. Com o objetivo de prever resultados foi desenvolvido um simulador para basquetebol. Este simulador permite simular um jogo jogada a jogada e atingiu uma performance de 64.80%. O sistema desenvolvido também permite posicionar vários overlays informativos, com estatísticas dos jogos, por cima do vídeo da transmissão, quer seja ao vivo ou sob demanda.
Os modelos de ML excederam a performance de vários trabalhos encontrados na literatura, o que solidifica o potencial impacto do trabalho desta dissertação desenvolvida. Para além disso, a simulação cria valor ao estado de arte, porque poucos artigos descrevem detalhadamente o desen-volvimento de um simulador desportivo.
This dissertation would not have been possible without the precious help of several people. First, I would like to thank my supervisors, Prof. Maria Teresa Andrade, and Prof. Goreti Marreiros, for accepting this challenge, guiding me along this path always with confidence.
I am thankful to MOG Technologies, for providing good conditions to develop this work, es-pecially to Nuno Cravino, who supervised me inside the company and at the same time helped me during the development of the dissertation, to Alexandre Ulisses and Ivone Amorim, for the chal-lenge proposed and the confidence given, and to the co-workers that helped and shared experiences with me during this time.
Finally, a very special thanks to my family who always believed in me and provided me with the best conditions to fight and achieve my life goals, and to my girlfriend, Patricia, who has always been with me in the good and the bad times.
1 Introduction 1
1.1 Context . . . 1
1.2 Motivation . . . 2
1.3 Objetives . . . 2
1.4 Document Structure . . . 3
2 Data Analytics in Sports 5 2.1 Business Intelligence . . . 5
2.1.1 Data Warehouse . . . 5
2.1.2 Reporting and Dashboard . . . 8
2.1.3 Existing Products . . . 12
2.1.3.1 SportRadar Performance and Advanced Widgets . . . 12
2.1.3.2 Dartfish . . . 12 2.1.4 Conclusion . . . 12 2.2 Machine Learning . . . 13 2.2.1 Supervised Learning . . . 14 2.2.2 Unsupervised Learning . . . 17 2.2.3 Stochastic Model . . . 18 2.2.4 Bayesian Model . . . 19 2.2.5 Kaggle Competitions . . . 19 2.2.6 Conclusion . . . 20 2.3 Simulation . . . 20
3 Multimedia Augmentation in Sports 23 3.1 Video Analysis . . . 23
3.2 Virtual Content Insertion . . . 25
3.3 Existing Products . . . 26 3.3.1 Dartfish . . . 26 3.3.2 Vizrt . . . 26 3.4 Conclusion . . . 28 4 Data Warehousing 29 4.1 Basketball . . . 29 4.1.1 Data Sources . . . 30
4.1.2 Extract, Transform and Load . . . 30
4.1.3 Data Mart . . . 32
4.2 Soccer . . . 32
4.2.2 Extract, Load and Transform . . . 33
4.2.3 Data Mart . . . 35
5 Data Modeling and Predictions 37 5.1 Machine Learning . . . 37
5.1.1 Basketball . . . 37
5.1.1.1 Feature Engineering . . . 38
5.1.1.2 Feature Selection and Transformation . . . 41
5.1.1.3 Results . . . 43
5.1.2 Soccer . . . 49
5.1.2.1 Feature Engineering . . . 49
5.1.2.2 Feature Selection and Transformation . . . 51
5.1.2.3 Results . . . 51 5.2 Simulation . . . 57 5.2.1 Feature Engineering . . . 58 5.2.2 Implementation . . . 60 5.2.3 Results . . . 61 6 Data Visualization 65 6.1 Feature Engineering . . . 65 6.2 Reporting . . . 66 6.2.1 Existing Tools . . . 66 6.2.2 Proof of Concept . . . 68 6.3 Multimedia Augmentation . . . 68 6.3.1 Architecture . . . 69 6.3.2 Implementation . . . 70 6.3.3 Proof of Concept . . . 70
7 Conclusions and Future Work 75 7.1 Fulfillment of Goals . . . 76
7.2 Future Work . . . 76
2.1 Conventional ETL diagram . . . 6
2.2 The back room and front room of a data warehouse . . . 7
2.3 The shooting ranges of Steve Nash, Ray Allen, Dirk Nowitzki, and Kobe Bryant . 9 2.4 Insight framework . . . 10
2.5 BKViz Game Outline feature . . . 11
2.6 SportRadar Advanced Widgets for basketball . . . 13
2.7 SportRadar Advanced Widgets for soccer . . . 13
2.8 SportRadar Performance Widgets for soccer . . . 14
2.9 BI report example from myDartfish Live S . . . 15
2.10 Process of building a computer model, and the interplay between experiment, sim-ulation, and theory . . . 21
3.1 Classification of research with different applications according to the semantic level 24 3.2 Players trajectories are shown on the court model . . . 25
3.3 Frame with projected logo . . . 26
3.4 Soccer match with illustrated graphics . . . 27
3.5 Example of player’s movement analysis using myDartfish360 . . . 27
3.6 Application example of Vizrt’s 3D analysis tools . . . 27
4.1 Data warehouse architecture. . . 29
4.2 A fraction of NBA games information from Basketball-Reference website . . . . 30
4.3 Example of a game’s box score from Basketball-Reference website . . . 31
4.4 Transform and load processes applied in basketball. . . 31
4.5 Entity relationship diagram of basketball data mart. . . 32
4.6 Soccer database staging tables. . . 33
4.7 Soccer database transform process. . . 34
4.8 Soccer ELT process overview. . . 34
4.9 Entity relationship diagram of soccer data mart. . . 35
5.1 Forward chaining structure . . . 38
5.2 Features correlation from basketball data set. . . 42
5.3 Tuning for min samples leaf and max depth in random forest applied to basketball. 44 5.4 Tuning for learning rate and number estimators in XGBoost regressor applied to basketball. . . 45
5.5 Accuracy scores of the different machine learning models applied in basketball. . 46
5.6 Feature importance from random forest applied in basketball. . . 46
5.7 Features correlation from soccer data set. . . 52
5.8 Tuning for min samples leaf and max depth in random forest applied to soccer. . 53
5.10 Accuracy scores of the different machine learning models applied in soccer. . . . 55
5.11 Feature importance from random forest applied in basketball. . . 57
5.12 Overview of basketball simulation process. . . 58
5.13 Basketball simulation flow. . . 61
6.1 Comparison between Tableau and PowerBI . . . 67
6.2 Soccer report with last games and goals from a team. . . 68
6.3 Soccer report with team statistics. . . 68
6.4 Soccer report with most valuable players of a season. . . 69
6.5 Multimedia augmentation system architecture. . . 70
6.6 Soccer overlay with last matchups. . . 71
6.7 Soccer overlay including the team’s statistics until the game. . . 71
6.8 Soccer overlay including player comparison by position. . . 72
6.9 Soccer overlay including the overall best player of each team. . . 72
5.1 Optimized stealing fraction value for each basketball model. . . 41
5.2 Features engineered for basketball. . . 42
5.3 Optimized hyper-parameters for each basketball model. . . 44
5.4 Basketball SVM results. . . 47
5.5 Basketball random forest results. . . 47
5.6 Basketball XGBoost regressor results. . . 47
5.7 Basketball extremely randomized trees results. . . 47
5.8 Basketball decision tree results. . . 48
5.9 Basketball XGBoost classifier results. . . 48
5.10 Valenzuela’s thesis results on NBA season 2014-2015 . . . 48
5.11 Cao’s dissertation results on NBA season 2010-2011 . . . 48
5.12 Optimized stealing fraction value for each soccer model. . . 51
5.13 Features engineered for soccer. . . 52
5.14 Optimized hyper-parameters for each soccer model. . . 54
5.15 Soccer decision tree results. . . 56
5.16 Soccer random forest results. . . 56
5.17 Soccer XGBoost regressor results. . . 56
5.18 Soccer XGBoost classifier results. . . 56
5.19 Soccer extremely randomized trees results. . . 57
5.20 Soccer SVM results. . . 57
5.21 Average statistics box score of an NBA game simulated a thousand times. . . 62
5.22 Game results between Chicago Bulls and Cleveland Cavaliers during the season 2015-2016. . . 63
5.23 Confusion matrix of the simulation model. . . 63
5.24 Simulation results of the NBA regular season 2015-2016. . . 64
5.25 ESPN Forest panel predictions of the 2015-2016 NBA regular season. . . 64
API Application programming interface BI Business Intelligence
BI&A Business Intelligence & Analytics
C Center
CSV Comma-Separated Values EPL English Premier League HLS HTTP Live Streaming HMM Hidden Markov Model HTML HyperText Markup Language LSTM Long short-term memory MDP Markov decision process ML Machine Learning MLB Major League Baseball
NBA National Basketball Association NFL National Football League PF Power Forward
PG Point Guard
POMDP Partially observable Markov decision process RBF Radial Basis Kernel
REST Representational State Transfer RF Random Forest
SF Small Forward SG Shooting Guard
SVM Support Vector Machine URL Uniform Resource Locator XGBoost Extreme Gradient Boosting
Introduction
Sports analytics has been a trend that has grown a lot and remains extremely popular. The MIT Sloan Sports Analytics Conference, a conference founded in 2006, is one of the most prestigious conferences for the creation and diffusion of knowledge about sports analytics, and over these years remains very popular. This year’s edition (13th) had 3,500 participants from 33 countries, 44 U. S. states, 130 professional teams, and around 200 universities. [1].
Concerning fan consumption, an important fact is that more than 60% of adult US men and 40% US women, who watch TV will regularly watch sports on TV in 2019. The predictions report written by Deloitte [2] also reveals that "TV sports will represent about two-thirds of all TV watching among 18-24-year-old-men, and more than three-quarters of all TV watching for men age 25-34 who watch TV sports". Additional detail is that more than 40% of 18-34-year-old US men will tend to bet on sports weekly or more often when watching TV sports. Therefore, spectators need to be provided with some meaningful insights.
Enhancement of the viewer experience, plus the insights from predictive models is the perfect match to bring more spectators to sports and keep those who follow.
1.1
Context
Currently, there is a wealth of data on clubs, players, and sports games. The distribution and massification of platforms for multimedia content visualization have promoted the consumption of these contents. As a result, sports data analysis is becoming extensive and diversified. In 2018, the Sports Analytics Market was valued at USD 0.56 billion and by 2022 is estimated to reach a CAGR of 30% over the forecast period of 2019-2014 [3].
Data analytics in sports has reached an important level where actions are no longer based only on the experience and intuition of a player or coach. Proof of this was the Major League Baseball’s achievement from the team Houston Astros, who not only won the championship for the first time but made a walk that allowed them to move from last to first. This 2017 triumph was a process
of years that relied heavily on advanced data analytics. Since 2011, the club general manager Jeff Luhnow and his team had to build an organization and culture around data, from that point analytic insight fuelled both player selection and on-the-field decision making, such as where to position players in game situations [4].
This dissertation was carried out at the company MOG Technologies, located in Maia. MOG main market are broadcasters and content producers worldwide, including sports related corpora-tions. Its products range from post-production tools to streaming platforms for live and on demand content. In 2017 it started a new AI and Data Science department that focus on generating new media-related insights from the operational level and all the way up to content delivery.
This project is included in that department and is one of the company’s first projects related to the application of data analysis in sports.
1.2
Motivation
Technological evolution has brought easy access to a large amount of data that needs to be pro-cessed as quickly as possible to provide useful information.
Recently, almost every industry has started to rely on big data analytics to support decision-making processes. Sports follows the trend by, per example, mitigate in-game injuries and build predictive models to identifying optimal shooting zones from a National Basketball Association (NBA) team [5].
Professional sports teams, such as the Houston Astros, the Chicago Cubs, and the Toronto Maple Leafs, built analytics department and consequently, this tends to be followed by other teams. Professional sports teams, such as the Houston Astros, the Chicago Cubs, and the Toronto Maple Leafs, built analytics department, which consequently tends to be followed by other teams. On the other hand, there is the example of the NBA player Kevin Durant who hired a statistical expert to improve his in-game performance [6].
1.3
Objetives
The primary goal of this dissertation is to develop an information retrieval system that is able to increase the sports fan experience and support broadcasters and clubs with meaningful insights.
This system is intended to collect sports related data, such as information from clubs, play-ers, matches, and competition venues, and apply data analytics mechanisms to extract relevant information.
Additionally, the system will offer a multimedia augmentation layer, in order to enhance the sports fan experience, the purpose is to give additional information, without there being a percep-tible direct intrusion on the main content. The information will be presented as an overlay above the video containing statistical facts, like the athletes’ performance in a given month.
In order to provide meaningful insights to both clubs and broadcasters, this development will offer the ability to analyze the odds of a team winning a game, and be able to help determine which lineups are better against each opponent.
Finally, it is intended that the system covers basketball and soccer.
1.4
Document Structure
The structure of the document is composed of the current chapter and six more chapters.
Chapter2, analyzes various mechanisms of data analytics in sports. These mechanisms are divided into Machine Learning, Business Intelligence, and simulation. In each mechanism is shown the related work and conclusions about each subsection.
Chapter 3, describes the usage of multimedia analytics in sports. Whether improving the viewer’s experience or by analyzing video that aids athletes and coaches. It presents related work and existing products.
Chapter 4, explains how the data from NBA and EPL was collected and organized into a multidimensional database.
Chapter5, describes the mechanisms implemented to predict game outcomes, which is divided into ML and simulation.
Chapter6, presents the proposed solution to improve the sports fan’s experience and provide knowledge to broadcasters and clubs, whether for soccer or for basketball.
The document ends with Chapter7, which gives a summary of the work developed, and future work.
Data Analytics in Sports
It is common to say that baseball was the starting point of sports analytics, where experts have used advanced statistics to improve player selection and game strategy. First, the book "Percent-age Baseball" [7] published in 1964 led to the development of a new concept entitled sabermetrics. Sabermetrics is related to the acronym SABR, which means Society for American Baseball Re-search and was defined by Bill James. Some years later, emerged the popular movie Moneyball [8], in which sabermetrics and advanced statistics helped Oakland Athletics in decision making.
Since then, the diversity of statistical technologies and techniques lead to an improvement in data collection and decision making in competitive sports.
2.1
Business Intelligence
Decision-making processes have a tremendous impact on the success of an organization. Decision makers, namely top managers, usually used the knowledge acquired with experience to decide. During the last years, Business Intelligence (BI) has appeared as an important topic of Informa-tion Systems. Consequently, companies investing in it rely on data with the purpose of getting summarize information in an organized manner that supports the strategic decision [9, Chapter 4]. In Sports, curiosities about two matchups, for instance, how many times both times played against each other, statistics from a player in the current month, and what is the average age of a team are examples of tasks that can be calculated through BI.
The development of data warehousing concepts and techniques, the evolution of data visual-ization techniques and the production of reports and dashboards are key drivers of BI [9, Chapter 4]. These key drivers and BI existing products are described in the next chapters.
2.1.1 Data Warehouse
In the last years, with the emergence of Big Data, several changes have occurred at the data warehouse level, and everything indicates that in the future more changes will occur. Big Data
enabled more and more organizations to focus on storing the vast amount of data available to gain business advantage. Facebook and Google are good examples of organizations that provide a wealth of data for the entire world. [10, Chapter 1]
A data warehouse can be defined as "a system that extracts, cleans, conforms, and delivers source data into a dimensional data store and then supports and implements querying and analysis for the purpose of decision making." [11, Chapter 1]
Its production involves a technical component and a business component. In the technical component, it is guaranteed that the company’s data is assembled from its source systems and that it is stored, organized, and cleansed despite its origin. The business component assures that the structured data allows creating the desired reports and key figures.
The process of extraction, transformation, and loading (ETL) belongs to the technical com-ponent and is summarized in three steps. First, extract the data from the source system. Then, transform this data for business level users and, finally, the data is loaded into the final data ware-house tables [10, Chapter 5]. The Figure2.1shows an example of an ETL process, where the final result is loaded into the data warehouse and used for reporting or analysis in a data mart.
Figure 2.1: Conventional ETL diagram [12].
An alternative process is the extraction, load, and transform (ELT), which is used in systems requiring the support of more continuous, and faster, flow of data into the data warehouse. In this process, the data is extracted, loaded directly into the data warehouse server and the transformation occurs in the data warehousing environment. Finally, the data is loaded into the data warehouse tables [13, Chapter 1].
A data mart derives from the data warehouse and is created with the principal purpose of reporting to a specific group of users and thereby provides easy business access to relevant infor-mation. Companies may have several data marts for different departments, for example, human
resources, marketing, and sales. The advantage of that is the shorter time of queries since there is fewer data to process [10, Chapter 1].
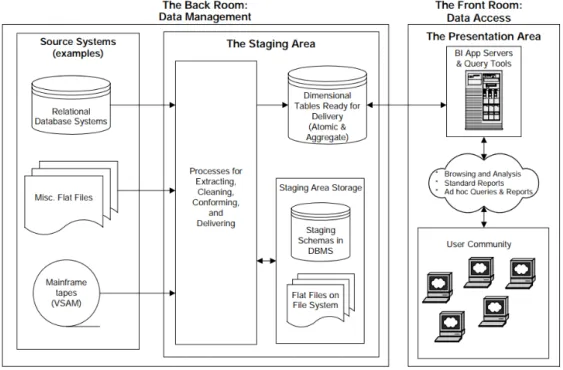
Figure2.2demonstrates an overview of a data warehouse containing a back room, which stores and structures the data and a front room, based on BI to access the information and make better decisions.
Figure 2.2: The back room and front room of a data warehouse [11].
Laursen and Thorlund stated in [10, Chapter 5] that integrating data into an overall data ware-house as many advantages, such as:
• Avoid overloading of source systems when generating daily reports; • Integrate data from many different origins;
• Store historical data that can be changed or removed in source systems; • Add new business logic to data that doesn’t exist in the source systems; • Establish central reporting and analysis environments;
• Secure scalability to guarantee future maintenance of new data volumes; • Ensure consistency and valid data definitions across business areas.
Focusing on sports organizations, one of the data warehouse’s advantages is to collect and organize data in several forms, which allows, for example, to build a fan profile to help and support ticketing strategies.
The customer relationship management (CRM) data warehouse works as a centralized database with integrated information about the customer, namely tickets, food and beverage, and team mer-chandising items purchased [14].
A practical example could be the analytics department mine the CRM data to identify cus-tomers with season ticket that purchase hotdogs or popcorn in the half time of every game, thereby increase stock at those times or advertise coupons to the customers. Another use of the customer profile could be to offer him a beverage or food when the game matches with his birthday.
There is an interesting case applied by the Orlando Magic, which through its data warehouse, found a considerable number of fans that were not buying tickets for multiple games, whether it was in the same season or throughout multiple seasons. The NBA team’s research familiar with the gap began working to identify the patterns that led fans to buy tickets. After that, they launched two multi-ticket packages at more affordable prices and the results in the first season were extremely positive [15, Chapter 2].
In 2014, SAS and the New York Mets established a partnership to get the club to use SAS analytics to analyze fan data and customize their experiences on an individual level. By examining, for example, social media data, the Mets can accurately interpret the fans’ feelings about a given player or game. With this in mind, through their website or social media channels, they interact with fans using the information supporters care about the most. [16].
2.1.2 Reporting and Dashboard
In BI, reporting and dashboard are ways to select and present information that intends to support decision makers. Throughout this chapter, both techniques are described individually and their related work is shown.
Laursen and Thorlund [10, Chapter 4] define reporting, in the context of Business Analytics, as "selection and presentation of information, which is left to the end user to interpret and act on". They also define it as descriptive statistics, in a statistical context, because the information is merely presented and no exploratory analyses are performed. Reports with descriptive statistics are the most common way to transform business data on business information, as they can be standardized and consequently automated.
Typically, a data warehouse is used together with a reporting solution and rules are defined that guarantee the generation of reports. For example, reports showing monthly sales of game tickets or daily sales of merchandising items, in which the data warehouse feed both reports.
Goldsberry [17] innovated data analysis in basketball when introduced new spatial metrics and advanced visualizations to help the interpretation of the spatial dynamics of NBA teams and players. His research focuses on the shooting performance, in which he presents cases of players who have a high field goal percentage, but who are not seen as the best shooters. He defined the spread and range metrics, which respectively counts how many positions where the player has made at least one shot and the player’s shoot effectiveness from the most diverse court locations.
Concerning visual analysis, the research presents heatmaps that demonstrate the spread and range values from different players, which for him the range determines who are the best shooters
in the league. Figure2.3shows heatmaps from the four players with the highest range values and it is noticed that each one behaves differently in relation to the position where he prefers to shoot.
Figure 2.3: The shooting ranges of Steve Nash, Ray Allen, Dirk Nowitzki, and Kobe Bryant [17].
These reports can be made to analyze the shooting trends of the opponent team and based on that the coach might apply a zone defense against his opponent.
Most academic research focuses on developing metrics and key performance indicators (KPI) that could objectively describe a player’s or team’s effectiveness. However, there is a gap in how sports organizations and athletes make use of this data [18].
To fill this research gap, Caya and Bourdon proposed a value creation framework to describe how and where Business Intelligence & Analytics (BI&A) can generate benefit in competitive sports organizations and athletes.
The framework assigns value creation to three groups: institutional level; organization level; individual level, where all are affected by external actors, who are defined as technology vendors, sponsors, fans, and the community.
The institutional level represents national professional leagues and international sports federa-tions. These macro entities compete against each other to enhance the sports fans attention, which consists of improving and sustaining a public image to attract more sponsors and fans. Seek fi-nancial success is also part of the goals. To achieve this can be used interactive data visualization technologies to enrich fans’ experience, where the external actors join the purpose to provide the required technology. Television networks and media also help to it, because they own the in-frastructure and legal rights to transmit the sports events to fans. Secondly, sports leagues and federations can provide relevant and up-to-date data with statistical analysis through social media
and web portals. The NBA is a good example, as they provide to teams and spectators reports and data representation tools that measure the performance of the players and teams in the league.
Sports teams and their sub-teams, like, management team, coaching staff or support staff define the organizational level. Improve decision making and player preparation is the main focus on this level, but also increase revenues and overall financial performance.
For all this to be possible, the staff needs to shape a mindset predisposed to data-driven deci-sion making. The individual level is composed of athletes, who are the ones converting decideci-sions from the organization level into physical action during sports events. The main goal for them is to have better injury prevention, effective health management, and gather useful insights on how to perform better. Sharing specialized reports and data visualization tools along with coaches and other support staff members allows athletes to identify opponents’ patterns of play, receive person-alized feedback and learn game tactics. After the game, a player can review his game performance with a personalized post-game video along with specialized statistics.
Lastly, one remarkable example of BI application is how Shane Battier, who played for the Houston Rockets, processed detailed data about his direct opponent’s playing patterns before the basketball game to diminish the performance impact of that opponent [19].
About dashboards, Few stated in [20], [21] that dashboards are a visual representation con-taining sets of performance indicators and key performance indicators, organized and displayed onto a single screen since the goal is to be interpreted quickly.
Unlike reports, dashboards are customisable interfaces that include a combination of text with graphics, and if properly designed they can communicate more efficiently than only text. Secondly, they can be interactive, applying filters the user can pick the information of only one team, instead of all the teams’ data. Finally, dashboards can be seen as the first point of information, to keep people aware and take them into a further investigation.
Harrison and Bukstein show in [15, Chapter 13] a framework, developed by them, pointing the main aspects for maximizing the chances that a data visualization communicates effectively (Figure2.4).
In the sports environment, having the most important performance factors available in a simple and accurate way influences any decision-making process. Another fact is that coaches or scouts struggle to remember and recognize important game events [22], [23]. People can see events happening, but only a few details are processed, and not everything that is processed is stored as memories.
Since the data comes from multiple sources, different types of groups want to view the sum-mary information, namely coaches, players, or other management staff. Each group has a different purpose for analyzing the information, so the design and focus of the dashboard must match that purpose [24, Chapter 4].
BKViz [25] is a good example of an interactive dashboard for basketball games. It allows a user to analyze a player’s performance, how he interacts with his teammates or even allows to interpret the game style and chemistry of a team. Simple interactions, such as filtering by players on the court or by the game’s timeline, enable to interpret how the match developed at a glance (Figure2.5).
Figure 2.5: BKViz Game Outline feature [25].
for example, the location and length. To show these statistics provide three views: shot map, traditional heatmap, and radial heatmap. To give more flexibility to the analysts using the system several filters are provided. Focused on the chemistry between players, when it comes to passing the ball between them, SoccerStories [27] through heatmaps and node-link diagrams demonstrate this relationship to detail.
2.1.3 Existing Products
The next section describes products related to business intelligence on sports.
2.1.3.1 SportRadar Performance and Advanced Widgets
One of the top leaders of the sports, media and betting industries is SportRadar [28], an inter-national organization employing over 2.000 people in more than 30 locations all over the world. They develop many different products related to various sports types, such as widgets for basket-ball, soccer and American football.
Built for basketball, soccer and National Football League (NFL) the Advanced Widgets [29] mission is to provide better entertainment on the sports fan experience. With this in mind, more specialized information than fixtures, standings, and line-ups is presented through a digital plat-form.
In the case of basketball and soccer, Figure 2.6 and Figure2.7 represent a widget’s screen, which provides, respectively, a heatmap with the teams shooting zone and league average goals scored and conceded by a team.
Performance Widgets [30] is another product made by SportRadar and focuses on individual or team performance by showing, for instance, 1-on-1 duel performance, passing or shooting accuracy during a game or season. Currently supports soccer and NFL. Figure2.8 represents a screen that shows the goalkeeper’s performance.
2.1.3.2 Dartfish
Since 1999, Dartfish [31] develops products to create, analyze and distribute video content across industries, such as education, healthcare, and sports.
In a range of several products, myDartfish Mobile S [32] and myDartfish Live S [33] bring intelligence to the data producing reports that allow better visualization of the athlete or patient performance and extract detailed knowledge. Figure 2.9 shows a report generated by Business Intelligence tools from myDartfish Live S.
2.1.4 Conclusion
Through the literature, it is seen that BI adds much value in sports, either at the organization level or athlete level. Over the years, professionals are shaping their mindset to be predisposed to use data in any decision-making.
Figure 2.6: SportRadar Advanced Widgets for basketball [29].
Figure 2.7: SportRadar Advanced Widgets for soccer [29].
In terms of data warehousing, several stories show that clubs with good collect and processing data techniques have innovated and improved their sport. However, no cases were found where clubs integrated more than one sport in their data warehouse. However, no cases were found where clubs integrated more than one sport in their data warehouse.
Both reporting and dashboards are very intuitive and valued tools for the sports staff. Reports are created more easily and can be automated. Dashboards through filters provide more flexibility to the analyst, but the creation process can be more time-consuming.
Since sports analytics are emerging quickly, there are more and more quality products and the market is becoming very competitive.
2.2
Machine Learning
Recently, one of the most popular approaches in data analytics is Machine Learning (ML), which can be used to predict relevant facts. Compared to BI, with this approach, it’s possible to do a more advanced analysis, which consists of, per example, train on a data set with known events and use that knowledge to predict the events for another data set.
In Sports, ML allows predicting values, such as, the probability of a player getting injured and what characteristic a team should improve to increase their winning chance.
Figure 2.8: SportRadar Performance Widgets for soccer [30].
One of the most influential people, more specifically in baseball, is Nathaniel Silver, better known as Nate Silver. During his career as a baseball analyst, his most notable projects were PECOTA [34] and FiveThirtyEight [35].
PECOTA stands for Player Empirical Comparison and Optimization Test Algorithm and was developed in 2002-2003 focused on player performance prediction for the Major League Baseball (MLB). The algorithm adopts an unusual methodology, instead of centering on player individual statistics, such as batting average or home runs, it focuses on the historical performance of players similar to the player being predicted. Thereby produces a probability distribution of the player’s performance over the next five years.
FiveThirtyEight is a website that publishes content related to analysis in politics, economy, and sports. About sports, there are articles pertaining to the NBA, National Collegiate Athletic Association (NCAA) Men’s Basketball tournament and MLB.
The following chapters describe ML techniques and examples of applications in the sports environment. This techniques are divided into four categories: supervised learning, unsupervised learning, stochastic model, and Bayesian model.
2.2.1 Supervised Learning
In supervised learning, observations are defined as feature vectors, where each dimension contains the value associated with a given feature. Associated with each one of these observations there is a label, that represents the value the model will try to learn to predict. For instance, if the data collection represents a person, each feature must describe that person. This data may contain
Figure 2.9: BI report example from myDartfish Live S [33].
features such as the person’s height or gender [36, Chapter 1]. There are several mechanisms of supervised learning, below are described some of them in a summarized way:
Support Vector Machine
Support Vector Machines (SVMs) are a set of supervised learning methods commonly used for classification, regression, and outliers detection. This technique is effective in high dimensional spaces and also in cases where the number of samples is smaller than the dimension length. Other advantages are memory effectiveness because it uses a subset of training points (support vectors) in the decision function, and versatility since different kernel functions can be specified. On the other hand, SVMs do not give straight probability estimates, it uses an expensive five-fold cross-validation to calculate that [37].
Decision Tree
A decision tree (DT) is defined by [36, Chapter 3] as “an acyclic graph that can be used to make decisions”. Each branching node represents a specific feature and if the feature’s value is below or above a specific threshold it is followed the left branch or right branch respectively. The decision is made based on the leaf node that is reached. As trees can be viewed it is simpler to understand and interpret the results [37].
Random Forest
Random Forest (RF) is a meta estimator used for classification and regression tasks, which fits multiple DTs on several sub-samples of the data set. When splitting a node of a tree, the split
that is picked is the best split among a random subset of the features. To outputting the class uses the average to improve the predictive accuracy. RFs help to control over-fitting, which sometimes occurs in decision tree [37].
Extremely Randomized Trees
As the name says, in Extremely Randomized Trees, the way the splits are computed reaches an extreme level of randomness. Apart from random forests that look for the most discriminative thresholds, this algorithm draws thresholds at random for each candidate feature, and the best randomly-generated threshold is chosen as the splitting rule [37].
Gradient Tree Boosting
Gradient Tree Boosting is used both in regression and classification problems, which produces a prediction model using decision trees as base learners. The model is trained by iteratively boost-ing a sboost-ingle tree and after each iteration, the subsequent predictors learn from the mistakes of the previous predictors. As a result, it takes fewer iterations to reach the final predictions. This could lead to overfitting, therefore, it is crucial to choose carefully the stopping criteria [38].
In the sports context, exists many different related works to predict the outcome of a game. Regarding basketball, Pai, ChangLiao and Lin [39] developed a hybrid model integrating Support Vector Machine technique and a decision tree approach, called HSVMDT, to predict the outcome of a game. Furthermore, the rules generated from the HSVMDT model enables coaches to learn what factors can increase the chances of winning a game. In the Chenjie Cao’s dissertation [40] demonstrates a data analysis of six NBA seasons using Simple Logistics Classifier, Naive Bayes, Support Vector Machine, and Artifical Neural Networks. The first 5 seasons were used to model fitting and the 6th season was used to the score purpose, being that Simple Logistics showed a better prediction accuracy comparing to the others. Also about the NBA, Valenzuela [41] used ensemble learning methods to improve the accuracy of single models, such as SVM and random forest. In addition to the NBA, Zimmermann [42] applied various supervised learning techniques to predict the National Collegiate Athletic Association Basketball (NCAAB) seasons and makes a comparison between the predictions obtained in NBA and NCAAB. The author concludes that some metrics used in the college matches are easily applied in the NBA and that turns out to be some of the most relevant data. However, at the level of each individual game, he thinks the NBA is harder to predict.
For soccer, Danisik, Lako, and Farkas [43] developed an LSTM neural network focusing on the player attributes to predict outcomes. They use the player attributes from the video game FIFA among with match history from the five best European leagues. Ulmer and Fernandez [44] applied five different classifiers using a training set composed of ten EPL seasons, and a test set composed of two EPL seasons. The features focused on whether a team is playing a home or away game, and the team form until the game.
2.2.2 Unsupervised Learning
Unsupervised learning deals with extracting patterns from sets of unlabeled data. This however means that the usual evaluation metrics that are used in supervised learning are unavailable. In this approach, the goal is to build a model capable of using a feature vector as input and transforms it into another vector or into a value that could solve a practical problem. Two tasks of unsuper-vised learning can be clustering the data into groups by similarity and dimensionality reduction to remove redundant or highly correlated features [36, Chapter 1]. These tasks can be applied, for example, to divide the population by location and purchasing habits in order to provide useful publicity. Or, a data science team reduces the dimension length in a large data set to apply simpler algorithms and decrease file size [45].
Below are described two algorithms for clustering the data in a summarized way: K-means Clustering
In k-means clustering the goal is to cluster the data points into K groups. To define the groups, it’s assigned a centroid (the core of the cluster) for each group. The algorithm’s first step is to randomly choose the centroids. Secondly, for each data point find the nearest centroid, often using the Euclidian distance, and assign that centroid to the data point. Thirdly, calculate the new position of each centroid applying the average position of all cluster’s points. The last two steps are repeated until there are no more changes in the centroids [45].
Hierarchical Clustering
In hierarchical clustering beyond cluster assignments, it builds a hierarchy between the clus-ters. Each data point is assigned with a cluster, resulting in N clusclus-ters. The further step is to merge the two clusters that are closest to each other. The third step consists of recomputing the distances between the clusters. One way to do this is to consider the distance between two clusters to be the average distance between all their respective members, which is called average-linkage clustering. Finally, the last two steps are repeated until one cluster of N data points remains, which turns out to be a tree [45].
For dimensionality reduction the following algorithms can be applied: Principal Component Analysis
Principal Component Analysis (PCA) provides dimensionality reduction while maintaining structure (variance). PCA remaps the space in order to make the transformed dimension smaller than the original and to better comprehend high-dimensional data [45].
Singular-Value Decomposition
Singular Value Decomposition (SVD) is a matrix decomposition method for decreasing a big matrix into a product of three smaller matrices. It is commonly used in data pre-processing, which
enables, for example, to reduce the values of an image matrix without significant loss in image quality [45].
In Tennis, unsupervised learning methods are applied to identify types of serves directly from data. In the work of Wei et al. [46] it’s applied clustering methods in Hawk-Eye data from 3 years of the Australian Open Men’s. Through the identification of serves, they have been able to predict what kind of serve a specific player has more tendency to do, considering the game state.
2.2.3 Stochastic Model
Stochastic modeling is a form of modeling usually defined as a collection of random variables. According to Kenton [47], the goal of such modeling is to "estimate how probable outcomes are within a forecast to predict conditions for different situations".
An example of a stochastic model is a Markov model, which depends only on the current state to determine future states. This is known as the Markov property, which states that given the present state, the next state is only dependent on the current state [48, Chapter 1]. There are four types of Markov models, which are used depending on the situation. When all states are observable Markov chain or Markov decision process (MDP) is used. When the system contains states that are not observable it uses the Hidden Markov model (HMM) or Partially observable Markov decision process (POMDP).
In MIT Sloan Sports Analytics Conference 2014, Cervone et al. [49] proposed a framework to assign a value to each moment of possession in a basketball game, called expected possession value (EPV) based on how many points the offense is expected to score. The possession model is supported in a Markovian assumption and allows to estimate both the probability of a player to take a specific decision in a given situation and the corresponding EPV of the possession when the player makes that decision. This framework uses player-tracking data from the NBA season 2012-13 and helps to answer questions about players, such as, if he makes better decisions than the league-average player or if he is a selfish shooter. A common technique for modeling a version of the sports field is to apply a Markov chain, which is a stochastic process, as Goldner applied for football [50]. His work also establishes the expected scored points.
Other models can be used to determine the likelihood of a match result in which other variables are taken into account. In soccer, the work [51] applies the Bradley-Terry model, supported by team factors, such as if the team was recently promoted to the league, the number of days that rested before the game and its current form. Also, they focus on the hierarchical Poisson log-linear model to directly predict the goals scored by each team in each match.
Coefficients representing a specific tactic, whether in attack or defense, are significant, as some teams may perform better or worse depending on the tactic they are using. Identifying what conference the team belongs to, in the case of the NCAA basketball tournament, enables using the general behavior about the attack or defense of that conference. These coefficients can be used in Poisson distributions [52].
2.2.4 Bayesian Model
The Bayesian model belongs to the group of statistical modeling that is one of the innumerable applications of Bayesian methods. These methods use Bayes’ theorem to compute and update the probabilities after collecting new data. The Bayes’ theorem determines the conditional probability of an event, based on previous information or conditions related to it.
Given two events A and B, the conditional probability of A knowing that B is true is expressed as follows:
P(A|B) = P(B|A)P(A)
P(B) (2.1)
In sports, a new method was applied using Hybrid Bayesian networks [53], which belongs to the group of Bayesian models, that predicted results of soccer matches from leagues around the world. That is, instead of using data from only one soccer league, it uses several leagues, such as the Japanese and Russian championship, to improve the training data.
To make this possible three aspects are taken into account: temporal data, new team data, and different leagues. The temporal data means that considering games between team X and Y in season 2016-2017, the previous matches between them become less relevant as they are further away from the season 2016-2017. Sometimes two teams have never met each other since teams are promoted or relegated from a league every year, which results in no history of results between them. To handle this problem, the new teams are assigned with a default rating of 0. Since a team rating in league A is different from a team with the same rating in league B, different league games are used only when the difference rating of these matches exhibits strong similarities.
2.2.5 Kaggle Competitions
There are several products on the market relating to odds in sports, namely the odds of a team winning a game. However, companies do not share how these probabilities are determined, so it is not possible to know if they apply machine learning techniques. Thus, in this section, rather than referring to the existing products, it is talked about the Kaggle competitions.
Kaggle competitions are a good initiative that brings competition for the best prediction model and enables the sharing of knowledge in several domains where prediction is relevant. Kaggle [54] is an online community for data scientists, which provides users to publish or find data sets of several different themes and also enter competitions to solve data science challenges. These competitions aside from rewarding the scientists who built better models and consequently had better predictions, also, encourages the exchange of knowledge, where often the authors of the best works explain their ideas and share their code. Regarding sports, a good example of a basketball competition is the March Machine Learning Mania, which had contests from 2014 until 2017. This competition rewards the best forecast for the NCAA bracket of March Madness.
Zach Bradshaw [55], who won the 2015 contest, used the previous experience at modeling NBA games from his previous work as a sports analytics expert at ESPN. This experience helped on the data pre-processing and the modeling techniques applied in the competition. He applied a Bayesian framework to incorporate prior knowledge that was not on the contest’s data set. How-ever, he manually tweaked a prediction for one game, which resulted in a successful prediction of an upset.
In 2016, the winner was Miguel Alomar [56], which applied a logarithmic regression and random forest. The model key factors were the offensive and defensive efficiency. He also updated the team weight according to the strength of schedule, therefore penalizing teams that did not play against the best teams in the championship.
2.2.6 Conclusion
The state of art shows much quality and as it is a popular and growing subject, these works use recent data sets.
Currently, there is a lack of approaches based on the different combinations of lineups, which is a very important factor in predicting or simulating a game. Moreover, some work only uses one analysis mechanism which doesn’t allow to compare the efficiency of the outcome with other mechanisms.
In short, there is still a lot of methods to explore and the wide range of mechanisms also helps in this exploration.
As mentioned previously, in this section no existing products were described, however, during the research it was found that the products in the market do not focus on the combination of lineups, similarly to the related work. The target audience turns out to be more directed to fans, who use the team winning probability as a support for their bets, or discussions with their friends. These odds do not give useful insights to coaches because they can not explore or see the lineups that led to these predictions.
In conclusion, there is a lack of products that support the coach decision concerning his lineup, that allows him to analyse different situations taking into account the opponent and the game style he intends to use.
2.3
Simulation
Apart from the other techniques, Simulation allows seeing the intermediate results that lead to the outcome. Computer simulation consists of an attempt to model a real-life situation in order to understand how the system works. Basically, it tries to predict the system’s behavior from a set of parameters and initial conditions. An overview of this process is represented by the following picture:
Figure 2.10: Process of building a computer model, and the interplay between experiment, simu-lation, and theory [57].
Oh et al. [58] introduced a graphical model for basketball match simulation in MIT Sloan Sports Analytics Conference of 2015, which the major goal is to bridge the gap between player identity and team level network. The developed model is calibrated with data from the NBA season 2013-2014 like player tracking, play-by-play game log, and line-ups. So, the model encompasses behavior about every touch and event in a game as a progression of transitions between states. This approach consists in calculating the probabilities of shot frequency, shot efficiency, pass between two players, shooting foul and corresponding free throw, rebound and turnover. Therefore, this work helps answer questions regarding the team, for instance, what team will win a match, or what teams will be in the season’s top 3, but also questions regarding the player selection, such as how well a player will perform against a specific opponent.
Moreover, Vraˇcar et al. [59] uses a Markov chain to simulate play-by-play in basketball with similar events but taking into account situational variables. This means considering the difference of points between two teams and how much time is left to finish the game because teams play differently when the game is tied or when the point difference is greater than 15. Also, the same score at the half-time or 2 minutes from the end of the game has a completely different meaning. To avoid invalid states due to game rules, they applied a decision tree and a separate regression model.
Currently, the simulation models of the literature do not allow coaches to enter parameters, like high press on the field. These parameters are useful because if a coach knows that the opposing team plays poorly against the high press, they can simulate the game using this parameter to get an insight about what players are the most capable of pressing high on the field.
Multimedia Augmentation in Sports
In sports, multimedia applies to a diversity of topics, such as improving a spectator’s experience and help players or coaches analyzing games.
Concerning the spectator, it can take the television experience to a whole different level, whether it is before, during or after a game. It allows an offside, in case of soccer, or how a team defends a ball screen, in case of basketball, to be viewed and analyzed in detail. Typically, this improvement consists of overlays over the main content.
On the other hand, extracting knowledge from games and training videos allows to detect the team’s weaknesses, to prevent injuries and to increase performance [60]. For instance, record a player shooting a ball enables him to detect and correct small details in his technique that he had never noticed before [61].
3.1
Video Analysis
Video analysis in sports is increasingly important and has grown fast with technological improve-ment, whether by improving video record or improving player tracking equipment. Work in this area is widespread, although it focuses on the more popular sports. According to Shih’s survey [62], more than 80% of the articles are dedicated to baseball, basketball, soccer, and tennis.
The survey classifies techniques in video analysis in terms of semantic level, for instance, highlights detection and event or object recognition. Fig3.1represents such classification.
Figure 3.1: Classification of research with different applications according to the semantic level [62]
Detecting patterns in the team defense or attack, recognizing their formation on the field, or identifying the zones in which a team focuses more or less are key aspects that tactical analysis brings. At the individual level, video allows a detailed analysis in the athletes’ moves, which it is useful to identify weaknesses in their performance.
About tactics recognition, the work [63] developed a system to detect screen-strategy in a basketball game. A screen is the action of a player blocking the defender’s movement by standing next to or behind him. In addition to identifying screens, the system also enables distinguishing screen types. To help professionals identifying the team’s offensive trends, Chen, Su, and Hsiao [64] through a broadcast basketball video reconstruct the players’ trajectory. These trajectories are presented on a standard basketball field model by a homography transformation, as can be seen in Figure3.2.
Furthermore, Hobbs et al. [65] using z-score heat maps describes the effectiveness per court location of each team in the women’s basketball tournament at the 2016 Olympics Games. It also establishes the sequence of ball-movement performed more often.
On individual performance, coaches can monitor the trajectory of the ball and the parameters during the execution of a free throw, which helps to correct the athlete’s skill. Consequently, they can provide feedback concerning the player’s body posture or the throw’s strength to increase the shot’s efficiency [66].
Nowadays, extracting relevant information such as the players in the field or the game actions that took place is a plus. Because of time-consuming and tedious processes, more and more research is emerging to make these methods more effective, efficient, and faster.
Figure 3.2: Players trajectories are shown on the court model [64].
player recognition, it is identified the video frame in which the teams line up and the respective line of scrimmage for that football play.
A different method is presented in [69] that first divides the video frames into two classes, with and without a scoreboard. Then, extracts semantic events from the frames classified with scoreboard and extracts replays of the frames without a scoreboard. Through the scoreboard layout of the broadcast video, Yu and Ding [70] detect the interruptions of a basketball game by reading the two clocks presented in the layout.
3.2
Virtual Content Insertion
Recently, the purpose of inserting advertisement and video augmentation has been expanding in sports. Virtual content insertion (VCI) is an application of video analysis and has three important keys: when it is triggered, where it is displayed and how it is inserted into a video [71].
For the virtual content injected to sound realistic, it is crucial that the system acquires the ac-curate camera matrix for each frame of the video. In the article [72], a new algorithm is introduced for the 3D camera calibration of a broadcast tennis video. As a result, they present a system to insert virtual content correctly, as shown in the Figure3.3. For the same purpose, but based on visual attention analysis, Huiying et al. [71] developed a system to perform dynamic insertion of virtual content. The time and position of the content are selected through temporal and spatial at-tention analysis. Another work is [73] that introduced an algorithm with added robustness against unwanted camera movements.
About advertising, existing methods for baseball [74] and soccer [75], automatically insert advertisement without interfering with the main content of the broadcast video.
(a) Original frame. (b) Frame with projected logo.
Figure 3.3: Frame with projected logo [72].
3.3
Existing Products
There is a wide variety of products on the market that support sports content streaming entities in enhancing the viewer’s experience or helping coaches with some insights from video analysis.
3.3.1 Dartfish
As seen in Chapter2.1.3.2, Dartfish provides intelligence to data through its products, but it also has products that enhance the visualization of an action made by a team, an athlete, or a patient. MyDartfishPro S [76] is an example of this since it allows to illustrate the video content with arrows to show the player movement or spotlights to grab attention to a specific player (Figure
3.4).
On the other hand, designed for biomechanical analysis of sports performance, myDartfish360 identifies and corrects technical movements. Through slow-motion playback and taking measure-ments of angles and distances of the player’s movemeasure-ments (Figure3.5).
3.3.2 Vizrt
Vizrt leads the media and entertainment industry through sports analysis, real-time 3D graphics, studio automation, and management tools. With 40 offices located around the world, they man-ufacture products used by the world’s leading media companies, such as Fox Sports, Sky Sports, CNN, among others [76].
Vizrt’s 3D analysis tools give viewers a better understanding of what is happening during a game. These tools allow broadcasters to create a variety of augmented reality graphics, for in-stance, heatmaps, replay graphics to review critical referee calls, distance lines, and player lineups (Figure3.6). An example of the application of these graphics is the quick in-game replays.
Figure 3.4: Soccer match with illustrated graphics [76].
Figure 3.5: Example of player’s movement analysis using myDartfish360 [77].
3.4
Conclusion
Broadcasters’ tools for sports continue to grow and the competition is huge, either by improving existing features or by developing new ones.
As for the spectators, the increase of the content during a game depends a lot on the information and how it is presented.
There is still room for innovation as data on sports keeps increasing, whether through statistics or players’ tracking.
Data Warehousing
This section details the process of creating a data warehouse. The data warehouse goal is to integrate basketball and soccer data, more specifically the NBA and the EPL.
The following figure demonstrates the architecture defined for it:
Figure 4.1: Data warehouse architecture.
For each sport is explained bellow which are the source systems, the processes of data collec-tion and transformacollec-tion, and the final data mart.
4.1
Basketball
This section describes the data sources used for basketball, as well as the extracted data, and the extract, transform, and load (ETL) process that was applied.
4.1.1 Data Sources
The data extracted belongs to the Basketball-Reference website [79], which was launched in 2004 and belongs to the company Sports Reference LLC. The company began in 2000 to provide only baseball information and has now expanded to basketball, soccer, football, and hockey. For the purpose of this study were used the seasons of 2012-2013 until 2015-2016 of the National Bas-ketball Association. The data consist of information about the games that have taken place, the statistics of the players and teams for each game and the details of each team and player.
Figure4.2 shows information of a few games from October displayed on the website. It’s possible to collect the game’s date, the home and away team, the game result and the attendance.
Figure 4.2: A fraction of NBA games information from Basketball-Reference website [79]. Concerning the game’s statistics, basic and advanced statistics are both displayed. The basic statistics are, for example, minutes played, field goals, and three-point field goals. The advanced statistics are calculated through basic statistics and are, for example, true shooting percentage, offensive rebound percentage, and defensive rating (Figure4.3).
The data for teams consists of basic information (name and location), staff and players infor-mation, year-by-year stats, and the best players from the club history. For each player presents positions where he plays, his birth, relatives, titles achieved, and several stats, for example, career summary and playoffs play-by-play.
4.1.2 Extract, Transform and Load
For data management, an ETL process (described in section2.1.1) was adopted using the Python [80] programming language.
To extract the data from the website, a web scraping script was implemented working with the Basketball Reference Web Scrapper [81] and Beautiful Soup [82] libraries. Web scraping involves fetching the web page and extracting the data from it.
The Basketball Reference Web Scrapper provides functions that extract the game calendar of an entire season and the basic statistics of the players and teams per day. All of these functions allow saving the results into CSV files. The data extraction process starts by collecting the game days for each season. Afterwards the basic statistics of each player and their teams is obtained from the games list. The scrapping process is time-consuming so it was decided to use the filesystem as a temporary storage for the CSV files, for each season it generates three files corresponding to the games information, box scores of the players, and box scores of the teams. Subsequently, the data was accessed more easily and without waiting time.
Figure 4.3: Example of a game’s box score from Basketball-Reference website [79].
The second package is a library that allows to navigate and search an HTML parse tree. It was only used to extract the players’ position because the previous package does not support players’ information extraction. This field can have more than one value, which corresponds to the positions where the athlete played more times during a season.
The Basketball Reference Web Scrapper doesn’t have the ability to extract advanced statistics. In order to obtain this data an extension was implemented. This extension follows the same struc-ture and functionality of the basic statistics functions already provided in the package, with the purpose of contributing this code later to the package repository.
There was also a need to limit the web scrapping process in order to prevent the source system from being overloaded. The library ratelimit [83] was used to limit the number of times a request can be executed during a time interval.
About the transform and load processes, Figure4.4gives the flow’s overview and the resources needed for each step performed.
Figure 4.4: Transform and load processes applied in basketball.
The transform and load phases start by creating a schema with the entities tables to execute on the PostgreSQL [84] database. After this initialization the data that has no dependencies is loaded
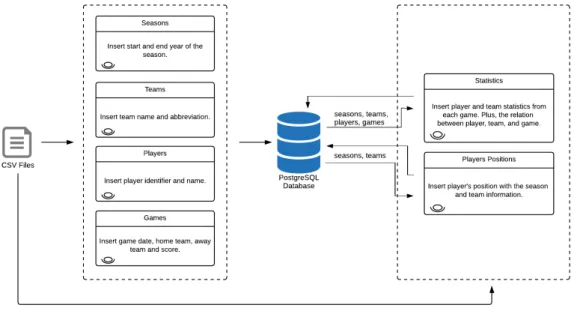
into tables, namely the seasons, players, teams, and games. Finally all the statistics for players and teams are linked with each game, together with the positions in which the players have played across seasons.
To help out the process, the libraries Pandas [85] and Psycopg 2 [86] were respectively used to efficiently read the CSV files and to inject the data into the database.
Throughout the implementation, one problem arose because some NBA teams over time have changed their name. What happens is that the game data of these teams according to the chrono-logical line may have a different team name. It is necessary to keep the name’s background, but also to group the entire history of a team regardless of their name at the time the match happened. Therefore, this information was standardized in a custom table, in which the team’s current id, current name and old names are stored.
4.1.3 Data Mart
Concluded the ETL process, the final data mart was defined as follows:
Figure 4.5: Entity relationship diagram of basketball data mart.
4.2
Soccer
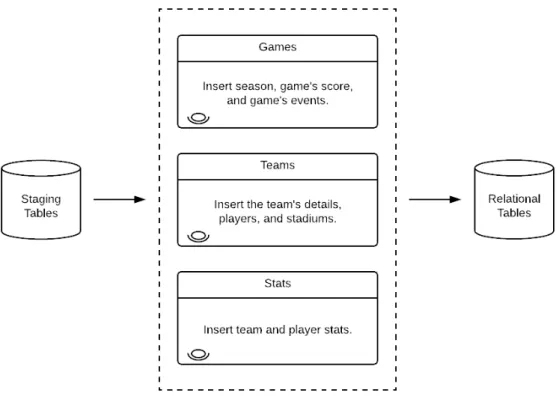
This section describes the data sources used for soccer, as well as the extracted data, and the extract, load, and transform (ELT) process that was applied.
![Figure 2.3: The shooting ranges of Steve Nash, Ray Allen, Dirk Nowitzki, and Kobe Bryant [17].](https://thumb-eu.123doks.com/thumbv2/123dok_br/15580623.1049180/29.892.155.786.209.606/figure-shooting-ranges-steve-nash-allen-nowitzki-bryant.webp)
![Figure 2.6: SportRadar Advanced Widgets for basketball [29].](https://thumb-eu.123doks.com/thumbv2/123dok_br/15580623.1049180/33.892.165.423.143.573/figure-sportradar-advanced-widgets-for-basketball.webp)
![Figure 2.8: SportRadar Performance Widgets for soccer [30].](https://thumb-eu.123doks.com/thumbv2/123dok_br/15580623.1049180/34.892.194.656.160.513/figure-sportradar-performance-widgets-for-soccer.webp)
![Figure 2.10: Process of building a computer model, and the interplay between experiment, simu- simu-lation, and theory [57].](https://thumb-eu.123doks.com/thumbv2/123dok_br/15580623.1049180/41.892.281.656.140.454/figure-process-building-computer-interplay-experiment-lation-theory.webp)
![Figure 3.1: Classification of research with different applications according to the semantic level [62]](https://thumb-eu.123doks.com/thumbv2/123dok_br/15580623.1049180/44.892.174.689.158.492/figure-classification-research-different-applications-according-semantic-level.webp)
![Figure 3.2: Players trajectories are shown on the court model [64].](https://thumb-eu.123doks.com/thumbv2/123dok_br/15580623.1049180/45.892.186.757.145.427/figure-players-trajectories-shown-court-model.webp)