Ciência Téc. Vitiv. 31(2) 73-87. 2016
73
This is an Open Access article distributed under the terms of the Creative Commons Attribution License
(http://creativecommons.org/licenses/by/4.0), which permits unrestricted use, distribution, and reproduction in any medium, provided the original work is properly cited.
SENSORY PROFILE CHARACTERIZATION AND TYPICALITY ASSESSMENT OF
PDO “BAIRRADA” AND PGI “BEIRA ATLÂNTICO” RED WINES
CARACTERIZAÇÃO DO PERFIL SENSORIAL E AVALIAÇÃO DA TIPICIDADE DOS VINHOS TINTOS DOP “BAIRRADA” E IGP “BEIRA ATLÂNTICO”
Luís S. Gomes1,2*, Aníbal José-Coutinho1, Alexandre Gomes da Silva3, Jorge M. Ricardo-da-Silva1 1 Universidade de Lisboa, Instituto Superior de Agronomia, Linking Landscape Environment Agriculture and Food (LEAF), Laboratório Ferreira
Lapa (Sector de Enologia), Tapada da Ajuda, 1349-017 Lisboa, Portugal.
2 Faculdade Ciências, Universidade do Porto, Rua Campo Alegre, 4169-007 Porto. 3 Coimbra Business School | ISCAC-IPC, Quinta Agrícola – Bencanta, 3040-316 Coimbra.
*corresponding author: Tel.: +351 914183033, e-mail: [email protected].
(Received 14.03.2016. Accepted 14.11.2016)
SUMMARY
The distinctive Portuguese wines from Beira Atlântico region, encompassing the protected designation of origin (PDO) Bairrada and the protected geographical indication (PGI) Beira Atlântico, were investigated by a wine expert panel through descriptive analysis and through assessment of typicality. For that 19 trained tasters performed a blind sensory evaluation of 21 representative wines from those designations. The variables considered were the color tonality and color intensity, aroma intensity, 18 aroma descriptors and 14 taste descriptors. Typicality was investigated through a single question, where the assessor was asked to score if the sample is a good or bad example of the type. Of the 21 wines selected, seven were classified as PGI or Regional, eight as PDO and six as “Clássico”.
Firstly, differences were analyzed between wine types considering all variables followed by clusters analyses confirmation. We could not find any difference between Regional and PDO Bairrada wines in terms of typicality and sensory profile. However the small group of “Clássico” wine was clearly identified by the tasters as being more typical, with also significant differences on sensory evaluation. Secondly, centered means analysis (CMA) of the 18 aroma and 14 taste items were performed to identify which of them are considered to be more distinctive. Thirdly, an exploratory factor analyses (EFA) by the principal component method (PCM) was applied to data, allowing identification of five vectors which aggregate the aroma items and four vectors which aggregate taste items. Finally, data collected from a sample of 20 questionnaires from a previous study based on cognitive knowledge and long term memory of 20 wine experts interviewed over the same 18 aroma variables and 14 taste variables, was analyzed under the same principal components (PC) and compared.
The 21 wines representatives of PGI Beira Atlântico and PDO Bairrada can be defined as being medium-high intensity, ruby colored wines, having a woody & spice, ripe fruit aroma profile with also herbal and mineral aromas. On taste they tend to have a pronounced component of acidity & astringency, balanced with a smooth & sweet taste component, with a very persistent finish.
RESUMO
Os vinhos portugueses da região Beira Atlântico, abrangendo a denominação de origem protegida (DOP) Bairrada e a indicação geográfica protegida (IGP) Beira Atlântico, foram investigados através de análise descritiva e avaliação de tipicidade. Para tal, um painel de 19 especialistas, que incluiu enólogos, académicos e formadores de opinião, levou a cabo uma prova cega sensorial de 21 vinhos representativos da região. As variáveis estudadas foram a tonalidade e intensidade de cor, intensidade aromática, bem como 18 descritores para avaliação do aroma e 14 descritores para as sensações de boca. A tipicidade foi investigada com uma única pergunta, tendo sido pedido ao provador que avaliasse cada amostra em função de se tratar de um bom ou mau exemplo de um vinho tinto típico da Bairrada. Entre os vinhos selecionados, sete foram classificados como IGP ou Regional, oito como DOP e seis como "Clássico".
Primeiro, foram analisadas as diferenças entre os três tipos de vinho, considerando todas as variáveis em estudo, seguido de análise de clusters para confirmação dos resultados encontrados. Não se verificaram diferenças significativas entre os grupos Regional e DOP Bairrada, quer na avaliação de tipicidade quer na análise dos descritores sensoriais. No entanto, o grupo que compunha os vinhos "Clássico" foi claramente identificado pelos provadores como sendo mais típico, apresentando também diferenças significativas em vários descritores de avaliação sensorial. Em segundo lugar, foi realizada uma análise de médias centradas para todos os descritores de aroma e de gosto, identificando-se assim quais os mais distintivos. Em terceiro lugar, uma análise fatorial exploratória pelo método de componentes principais foi aplicada aos dados, tendo sido identificados cinco vetores que agregam os descritores de aroma e quatro vetores que agregam os descritores de gosto. Por último, os dados obtidos a partir de uma amostra de 20 questionários obtidos em estudo prévio, com base na experiência e conhecimento cognitivo de 20 especialistas entrevistados sobre os vinhos da região Beira Atlântico, para as mesmas 18 variáveis de aroma e 14 variáveis de gosto, foram analisados e comparados tendo em conta as mesmas componentes principais.
Os vinhos IGP Beira Atlântico e DOP Bairrada podem ser definidos como tendo cor rubi, de intensidade média-alta, caracterizados pelas componentes aromáticas amadeirado e especiarias, fruta madura, complementado por aromas herbais e minerais. Quanto ao gosto, estes vinhos tendem a apresentar uma componente de acidez e adstringência, balanceada por uma componente doce e suave, com um final muito persistente.
Key words: sensory profile, Bairrada, Beira Atlântico, red wine, typicality. Palavras-chave: perfil sensorial, Bairrada, Beira Atlântico, vinho tinto, tipicidade.
INTRODUCTION
Sensory characterization of food and beverages has amongst its aims detection of unique or distinguishable qualities in a product, which can be influenced by the place of origin (Green et al., 2011). Wine is one product whose concept of typicality is prevalent (Maitre et al., 2010) and the concepts of
terroir, protected origin, and typicality incorporate
the notion that wines from delimited geographical regions can be perceived as different (Parr, 2009). A wine is typical when some of its characteristics, which reflect both its origin and terroir, can be identified and make it recognizable as belonging to a distinctive type (Charters and Pettigrew, 2007; Maitre
et al., 2010). Therefore, typicality includes sensory,
technical, and environmental dimensions (Cadot et
al., 2010).
According to Mueller et al. (2010), product expectations at the initial purchase and intrinsic sensory attributes during product consumption influence the repurchase decision. Thus, when consumers choose a wine bottle based on its identity or terroir, it is because they believe that there is a combination of sensory attributes that differentiates that wine from the others. Typicality and quality used to be correlated and are based on intrinsic cues such as pleasure and appearance, gustatory, and olfactory characteristics (Charters and Pettigrew, 2007). Applying the sensory approach to quality control within the food industry of typical products is fundamental for preserving the market position, maintaining consumer confidence and loyalty toward the product (Endrizzi et al., 2013). It does not mean that a typical wine is always good, but the concept could reduce the risk of an incorrect purchase. If the expectation of the wine is achieved, the possibility of repurchase increases, conferring an added commercial value. For this reason, recognition of typicality has become an economic factor for wine regions and winemakers.
Some studies have reported that wine experts learn to categorize wines according to the variety and are able to recognize them blind, while the identification of origin is less successful (Ballester et al., 2008). In the investigation of protected designation of origin (PDO) typicality is not straightforward, as it seems that there is more sensory overlapping between close PDO than
between wines made with different grape varieties. The existence of a defined and distinguished sensory space in a PDO is not obvious and the results depend on the samples choice, the professional tasters’ selection and the PDO itself (Maitre et al., 2010). There have been numerous studies characterizing regional sensory differences in wines (Kontkanen et
al., 2005; Perrin et al., 2008; González-Álvarez et al.,
2011; Green et al., 2011; Cadot et al., 2012; Robinson et al., 2012; Johnson et al., 2013). Some other studies have compared the sensory profiles of wines from multiple countries, including red and white wines from Ibero-American countries (Tonietto
et al., 2014), red wines from South American
countries (Llobodanin et al., 2014), red wines from Australia and China (Williamson et al., 2012), and Sauvignon Blanc wines from France and New Zealand (Parr et al., 2010) and either Austria (Green
et al., 2011) or South Africa (Lund et al., 2009) or
Argentina and California (King et al., 2014).
In Portugal, few studies have been attempted to assess for typicality or characterize wine regions profiles. Jose-Coutinho et al. (2012, 2013, 2015a, 2015b) investigated white and red wine sensory profiles of the 12 protected geographical indications of mainland Portugal. Evidence of clusters grouping several wine regions under the same sensory profile suggests that these 12 regions could be grouped into three to five major macro zonings that originate a much broader territorial reading. The authors also highlighted the benefits associated to this aggregation in a small country such as Portugal, encompassing low yield viticulture and dominance of old vines in small parcels owned by even smaller producers, and suggested that scale factors might result in significant gains in areas such as wine certification, marketing and communication.
A large number of sensory methodologies have been used with professional tasters to show the sensory characteristics of a wine category and several papers deal with the question of how typicality can be measured and how different methods have been suggested to evaluate wine typicality (Maitre et al., 2010). Sensory methods employed in the current study included analytical evaluation by descriptor ratings of intensity of selected aromas and flavors, with intensity considered to be correlated with perception of aroma and flavor concentration. For
typicality assessment we also employed a variant of the sensory methodology developed from Ballester (2004) where the author suggested investigating typicality with a single question, where the assessor is asked to score if the sample is a good example or not of the type.
The aim of the present study was to identify a sensory profile for red wines from Beira Atlântico region and to evaluate sensory characteristics and typicality differences between three distinct types of wines from this region, known as PGI wines, PDO wines and “Clássico” wines. We also investigated whether there is an agreed ideal for typicality between wine professionals, and identified the specific aroma and taste items that are essential and contribute for wine typicality; that is, making a given wine a good example of the concept.
MATERIAL AND METHODS Wines
The wines studied were commercially available red wines produced in PDO Bairrada and PGI Beira Atlântico. The main differences between these two designations are that the area of Beira Atlântico is noticeably larger than PDO Bairrada, allowing higher yields and a broader range of varieties. According to the Portaria nº 212/2014, within PDO Bairrada it is possible to apply for the mention «Clássico» ensuring that the wine meets a number of requirements such as: minimum of 30 months of aging which 12 of them in bottle, minimum 12.5% of alcohol, Baga variety in a minimum of 50% in lot composition and a maximum yield of 55 hL per ha.
21 wines were selected in collaboration with Bairrada certification authority to represent the diversity of three type of wines produced in these regions, from vintages 2009, 2010 and 2011, with retail prices ranging from 1,29€ to 29,95€ per bottle of 750 mL. All wines were vinified by classical red winemaking technology with extended maceration and fermentation. The best-selling wines for each type of wine were selected, making the sampling representative of the region. Of the 21 wines, seven were classified as Protected Geographical Indication (PGI) or Regional, eight as Protected Designation of Origin (PDO) and six as “Clássico”. These six wines, selected to integrate “Clássico” group, had the necessary characteristics to be categorized as «Clássico» wines (although some of them were not bottled and labeled as such). They share some common characteristics such as: coming from old vineyards, minimum 30 months of aging which 12 of
them in bottle, minimum 12.5% of alcohol, Baga variety in a minimum of 85% in lot composition and a maximum yield of 55 hL per ha.
Participants
The sensory expert panel was composed of 19 judges related to wine industry (winemakers, wine brokers, sommeliers and academic oenology professors), and was selected on the basis of their experience in wine tasting, sensory performances, interest and training to perform wine descriptive analysis (DA). No specific training was provided for participants immediately prior to their participation in the current study. All participants had an extensive experience of PDO Bairrada and PGI Beira Atlântico wines and most of them already integrate the panel tasting of Bairrada certification authority, which has its own methodology to control the consistency of their tasters’ evaluations.
Design and Procedure
The study was fully within-subject and was conducted in three one-hour sessions on the same morning day separated by a 15-minute break, at Estação Vitivinícola da Bairrada (Anadia). Each session contained seven wine samples codified with a random alphanumeric code, with the order of samples randomized in each session.
Wine samples were stored and presented at 20 ºC for detection of color, aroma and taste. The bottles were opened immediately before the analysis and panelists were prevented from seeing their label or shape. Samples were presented in standard wine tasting glasses (ISO 3591). Panelists were informed that they were evaluating wines from PGI Beira Atlântico and PDO Bairrada, including «Clássico» wines. However, for each wine sample no specific information was provided concerning the grape varieties, type or price. The environment for tasting was controlled as advised for sensory laboratories and international wine competitions. There was a uniform source of lighting, absence of noise and distracting stimuli, and ambient temperature was around 22ºC. Participants were then seated in separate booths and water was available to clean the palate.
Questionnaire
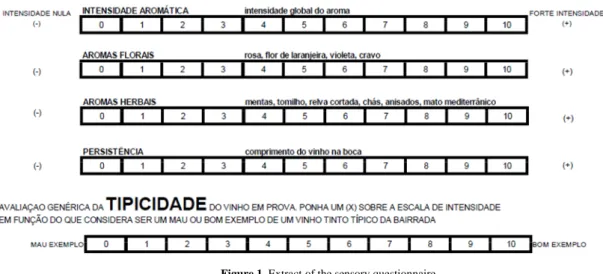
The questionnaire was designed according to the approved International Organization of Vine and Wine method for sensory assessment of wines, thus it is divided in three blocks: visual sensations (Color), the aromatic sensations (Aroma) and the gustatory and tactile sensations (Taste). Figure 1 shows an extract of the questionnaire.
Ciência Téc. Vitiv. 31(2) 73-87. 2016
Figure 1. Extract of the sensory questionnaire.
Extrato do questionário de análise sensorial.
DA was carried out and the assessors scored the intensity of each attribute using a 10 point structured and discontinuous scale. Scale were anchored with the terms “low intensity” on the left and “high intensity” on the right.
The color was assessed by its intensity and by its tonality, with color patterns of red wines according to the latest studies (Hernández et al., 2009; Jose-Coutinho et al., 2012, 2013, 2015b), which is evaluated for the tone violet–purple; purple–ruby; ruby–garnet or garnet–brick red and for the intensity in a 0-10 rating scale.
Aroma was evaluated by one overall measure for intensity and 18 aroma descriptors, which tended to summarize significant amount of scientific research, many of which already used in the form of aroma wheels (Fischer et al., 1999).
The taste of red wines, measured via tactile and gustatory sensations by the panel of experts, was evaluated under 14 descriptors, including the classical essential tastes (sour, sweet, salty, bitter), and adding the result of recent work focused on the tactile sensations resulting from various types of bitterness and astringency and the sensations caused by caustic and drying alcohol sensations (Gawel et al., 2000, 2001). The wine texture was evaluated in a tripartite form, considering smooth, rough and grain sensations on mouthfeel (Jose-Coutinho et al., 2015b).
The same 19 judges also assessed the wine typicality. For each wine, the assessors were instructed to answer the question “Do you think this wine is a good or bad example of what a Bairrada wine is?” These instructions were derived from Ballester (2004). The assessors were asked to rate the wines sample’s
typicality on a structured and discontinuous scale, 0-10 rating, anchored at left by “bad example” and at right “good example”.
Data analysis
Data acquisition was assisted by SPSS software (IBM Statistics SPSS Version 20). Over 14.000 database entries were retrieved, placed in an Excel worksheet and subsequently analyzed using SPSS software. The effect of the tasters was not considered and the average was computed for each item.
Firstly, a descriptive statistics was performed in order to analyze various sensory descriptors for the three types of wines. Secondly, a group of inferential tests was applied to look for significant characteristics. One way ANOVA, with Bonferroni test, was performed to test differences between wine types and evaluate statistically differences between them. An agglomerative hierarchical cluster analysis with square Euclidean distance, a tool that creates subgroups based on proximities of data (pair wise distance between observations) and inter-relationships of variables, was performed to better understand the interrelationships between the 21 wines. It classifies objects so that each object is similar to others in the cluster with respect to a predetermined selection criterion. The resulting clusters of objects should then exhibit high internal (within-cluster) homogeneity and high external (between-cluster) heterogeneity. It should be highlighted that this is an exploratory study were a profile should be shaded for red wines of this region. This profile has three components: the aroma, the taste and the color. The typicality is also analyzed. It is aimed to find the principal
characteristics of the wine based on components to be ease to compare with other regions in further studies. For typicality assessment, the average typicality scores were achieved and ANOVA was performed. Spearman correlation analysis (Spearman's rank-order correlation), whose coefficient measures the strength of association between two ranked variables, was also applied to find out which sensory characteristics (for aroma, taste and color), are associated with typicality judgment. The Spearman correlation can be used with the assumptions of presence of a monotonic relationship between variables and they are either ordinal, interval or ratio.
A principal components analysis with Varimax rotation, sought to explore the possibility of reducing the initial set of sensory descriptors on a fewer dimensions - the main components. The number of retained components was based on Kaiser test (according to which the components with an eigenvalue grater or equal to one are retained). After reducing the initial space variables a sensory profile was identified.
The methods used try to measure which items are significant and which are correlated with the wines from this region.
Data from a previous study based on memory and cognitive knowledge of Beira Atlântico red wines, from 20 wine experts interviewed over the same 18 aroma variables and 14 taste variables (Jose-Coutinho
et al., 2012, 2013, 2015b) was collected and analyzed
under the same principal components (PC) and compared. Centered means were used to allow
comparison between components avoiding the weight since components do not have the same number of items.
Using the components obtained, an ANOVA was performed to analyze the differences between wine types.
RESULTS AND DISCUSSION Comparing wine types
The three types of wine in study were analyzed and compared in terms of color intensity and tonality, aroma intensity, 18 aroma and 14 taste descriptors, and typicality. Because further analyzes were performed to aggregate aroma and taste descriptors into vectors, they were already analyzed and presented separately from the others.
Therefore, the first analysis comprises the variables of color, nose intensity and typicality. Table I shows the frequencies and the means for those variables indicating that the “Clássico” type was considered to be more color and nose intense and more typical. An ANOVA was performed to test differences between wine types and it showed that the “Clássico” type is statistically different from the others. The tonality most referred (mode) was “ruby–garnet” followed by “purple–ruby” consistent in all types. This ruby predominant color could be explained by the low pH wines (Glories, 1984), and therefore high natural acidity, which are common in Beira Atlântico region wines based on Baga variety (Böhm, 2007; Cardoso, 2007).
TABLE I
Frequencies and means related to the variables color, aroma intensity and typicality for the three types of wine
Frequências e médias referentes às variáveis cor, intensidade aromática e tipicidade para os três tipos de vinho
Variable
Wine type
Regional DO Bairrada “Clássico”
Count Mean(SD) Count Mean(SD) Count Mean(SD)
Color Tonality Garnet–Brick red 6 19 31 Purple–Ruby 55 41 36 Ruby–Garnet 69 91 40 Violet–Purple 2 1 6 Color Intensity 6.31(1.88) 6.41(1.5) 7.86(1.47)** Nose Intensity 5.93(1.64) 6.07(1.5) 6.89(1.53)** Typicality 5.78(2.15) 5.89(1.9) 7.10(1.83)**
** statistical significance (p<0.01); SD - standard deviation; Values obtained with One way ANOVA.
Table II shows the results of aroma items for the three types of wine. It can be seen, after the ANOVA test,
that “Clássico” type is statistically different from the other two on black fruit, raisin, jam, pastry, spice,
caramel and woody presence, and different from the regional on mineral presence, having a higher level in all of those items.
TABLE II
Mean intensity of aroma descriptors for the three types of wine.
Média de intensidade aromática dos descritores do aroma para os três tipos de vinho Aroma Items Wine type Regional DO Bairrada “Clássico” Mean(SD) Mean(SD) Mean(SD)
floral 2.11(1.99) 2.02(1.79) 2.12(2.0) dried flowers 2.09(1.71) 2.22(1.90) 2.32(1.93) herbal 3.24(2.03) 2.95(1.80) 3.07(2.14) vegetal 1.90(1.95) 2.71(2.56)* 1.96(1.87) mineral 2.50(1.79) 2.57(1.87) 3.11(1.87)*(r) citrus fruit 1.04(1.63) 0.82(1.28) 0.91(1.37) red fruit 2.90(2.34) 2.68(2.06) 2.41(2.09) black fruit 2.86(1.95) 2.70(2.01) 3.33(2.16)* stone fruit 2.74(2.01) 2.88(2.20) 2.89(2.09) raisin 2.34(1.95) 2.07(1.78) 3.10(2.07)** dried fruit 1.50(1.62) 1.68(1.63) 2.14(1.88) jam 2.44(1.89) 2.24(1.75) 3.50(2.26)** pastry 1.50(1.71) 1.66(1.81) 2.46(2.13)** spice 2.85(1.87) 3.29(1.80) 4.03(1.98)** caramel 1.86(1.91) 1.69(1.59) 2.61(2.11)** woody 3.30(2.06) 3.66(1.94) 4.73(2.18)** chemical 2.05(2.10) 1.93(1.96) 2.13(1.89) animal 1.88(2.03) 1.81(1.79) 2.22(1.87) * statistical significance (p<0.05); ** statistical significance (p<0.01); SD - standard deviation; Values obtained with One way ANOVA; (r) - “regional”.
The results of the ANOVA test for taste are presented on Table III. It can be seen that the “Clássico” type is statistically different from the other two on grain texture, astringent, full body, alcohol, oily and length items and from the regional type on tactile dryness and rough texture items, having a higher presence level in all of them.
TABLE III
Mean intensity of taste descriptors for the three types of wine.
Média de intensidade aromática dos descritores do gosto para os três tipos de vinho
Taste Items
Wine type
Regional DO
Bairrada “Clássico” Mean(SD) Mean(SD) Mean(SD)
bubbly 0.30(0.70) 0.39(0.81) 0.39(0.91) sweet 2.49(1.79) 2.09(1.57) 2.45(1.77) acid 4.32(1.76) 4.54(1.54) 4.51(1.83) salt 1.26(1.34) 1.28(1.35) 1.32(1.36) bitter 2.17(1.77) 2.35(1.89) 2.33(2.03) dryness (tactile) 3.92(1.98) 4.19(1.73) 4.68(1.94)*(r) smooth texture 4.40(2.29) 4.15(1.98) 4.46(2.04) rough texture 3.08(1.93) 3.26(1.76) 3.75(1.77)*(r) grain texture 2.13(2.03) 2.24(1.77) 2.84(2.25)* astringent 4.66(1.79) 5.08(1.46) 5.74(1.79)** full body 5.12(1.97) 5.31(1.65) 6.43(1.72)** alcohol 4.52(2.01) 4.61(1.89) 5.23(1.99)* oily 4.78(1.98) 4.91(1.76) 5.84(1.90)** length 5.31(1.97) 5.61(1.53) 6.64(1.59)**
* statistical significance (p<0.05); ** statistical significance (p<0.01); SD - standard deviation; Values obtained with One way ANOVA; (r) - “regional”.
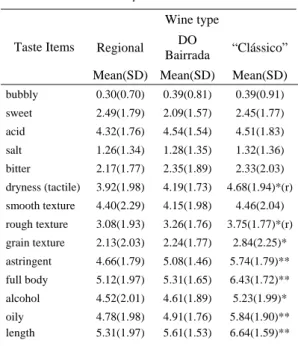
A Clusters Analysis was performed in order to better understand the interrelationships between the wines that comprise the three types of wines. This methodology is useful to confirm if the types are consistent in terms of color, nose, taste and typicality. It would be expected that the wines will be grouped according to the type they belong. The dendograms try to show if the wines are grouped according with their classification. Although the wine classification depends on a higher number of characteristics, it is important to see how the evaluation characterizes the wine; in that sense this analysis works as a convergent validation of the sensory analysis. Figure 2 show a tendency to aggregate wines from “Clássico” group, although with some wines from regional and PDO groups being mixed. This suggests that wines from “Clássico” group have contributed to discriminating from others by the panelists, especially in what respects to typicality.
a
b
Figure 2. Cluster analysis for “Typicality” (a) and for “All items” (b) considering all wines and types - Lowercase letters “r”, “d” and “c” before each alphanumeric wine code, refers to wine type and means Regional, PDO and “Clássico”, respectively.
Análise de clusters no que diz respeito à variável “tipicidade” (a) e a “todas as variáveis” em estudo (b), considerando todos os vinhos em prova - Letras minúsculas “r”, “d” e “c” antes de cada código alfanumérico, dizem respeito aos tipos de vinho Regional, DOP e “Clássico”,
respetivamente.
Typicality assessment
Typicality was investigated through a single question, where the assessor was asked to score if the sample is a good or bad example of the type.
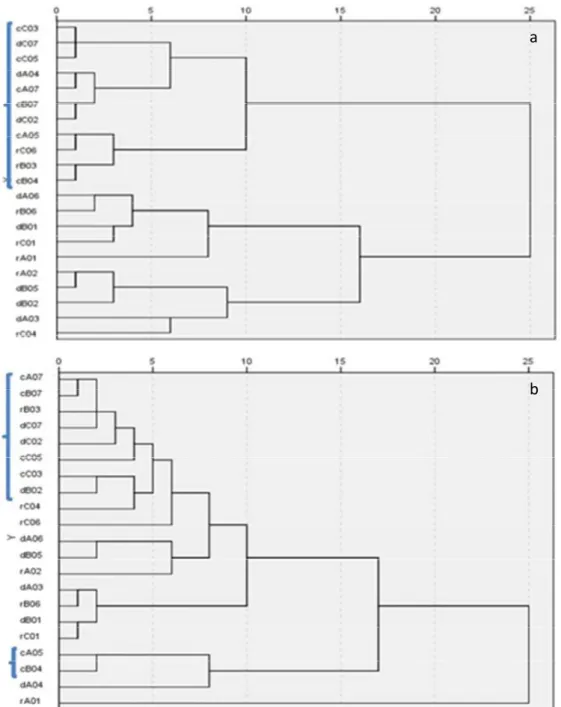
Table IV shows the significant correlations between typicality and either color, aroma and taste items, allowing to identify which sensory characteristics contribute to define typicality of Beira Atlântico red wines.
Ciência Téc. Vitiv. 31(2) 73-87. 2016
TABLE IV
Significant correlations between typicality and either color, aroma and taste items
Correlações significativas entre tipicidade e os descritores de cor, aroma e gosto
Aroma Items
intensity vegetal mineral citrus fruit
black fruit
stone
fruit raisin dried fruit jam pastry spice caramel woody 0.430** -0.138** 0.130** 0.101* 0.232** 0.273** 0.160** 0.161** 0.329** 0.133** 0.313** 0.150** 0.237** Taste Items
bubbly salt bitter astringent full
body alcohol oily length
0.100* 0.113* -0.126* 0.211** 0.642** 0.305** 0.509** 0.705**
Color intensity 0.468**
* statistical significance (p<0.05); ** statistical significance (p<0.01).
The relationship between typicality and items from descriptive analysis showed that full body, oily and length are taste descriptors highly correlated with evaluation of wine typicality by the expert panel. We can also assume that aroma and color intensity are important items correlated with typicality judgment by the expert panel, being the ripe fruit (black fruit, stone fruit, jam), woody and spice the aroma descriptors.
These achievements help to better understand why tasters considered “Clássico” wines more typical and placed this group as a distinct type of wine. We could find that those descriptors identified as being tightly connected with typicality judgment strongly match with those identified on Tables I, II and III that had showed “Clássico” type being statistical different from Regional and PDO types.
Evaluating aroma and taste distinctive descriptors of PGI Beira Atlântico and PDO Bairrada wines
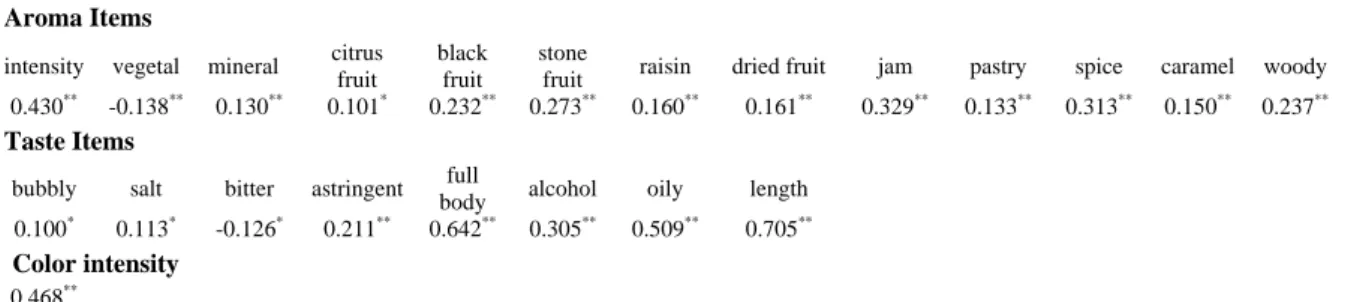
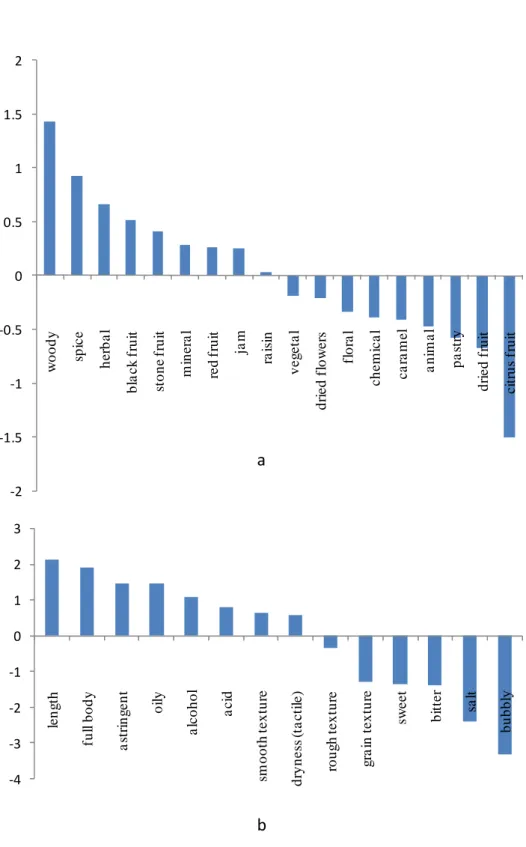
Figure 3 represents the centered means for the 18 aroma and 14 taste items in descending order.
It can be seen that woody, spice, herbal, black fruit, stone fruit, mineral, red fruit and jam are the aromas considered more distinctive of these wines. In what concerns to taste items, it can be seen that length, full body, astringent, oily, alcohol, acid, smooth texture and tactile dryness are the taste items considered more distinctive of these wines.
Data points were spread out over a large range of values, remembering how difficult is for the panelists to evaluate single sensory descriptors in a disaggregated form, leading us to perform principal component analysis (PCA).
Defining vectors which aggregate aroma and taste descriptors
An exploratory factorial analysis (EFA) was conducted, with the principal component method, separately for aroma and taste items.
Principal components factor analysis was carried out for the various sensory parameters that constituted the aroma characterization survey of red wines, in accordance with the most up-to-date bibliography and it was obtained five components explaining 60.77% of the variance. The factor loadings for aroma items are presented in Table V.
The results of this analysis suggest that several parameters can be grouped, since their variation is directly (or inversely) proportional, among them. Group 1 includes the following aroma descriptors: mineral; raisin; dried fruits; jam and pastry, which may be grouped under the so called “overripe” aroma profile. In a first glance it could appear strange the presence of the minerality item on this group, however this overripe aroma on wines, which means high levels of grape maturation, might be connected with deeper rooting systems embedded in the calcareous-clay soils present in the region, which could confer simultaneously this minerality character. The second group joins the descriptors red fruit, black fruit and stone fruit, assigned to the “ripe fruit” profile. Group 3 gathers spice, caramel and woody easily recognized as members of the “woody & spice” profile. Group 4 joins floral, dried flowers, herbal and citrus fruit, all included in the “floral & fresh” profile. The fifth Group aggregates “green & off flavor” profile, including chemical, vegetal (or green) and animal.
‐4 ‐3 ‐2 ‐1 0 1 2 3 le n g th fu ll body as tr in g e n t oi ly a lc o hol ac id sm oot h t e xt ur e dr yne ss ( ta c ti le ) roug h te xtur e g ra in t e xt u re sw e e t bi tt e r sa lt b ubbl y ‐2 ‐1.5 ‐1 ‐0.5 0 0.5 1 1.5 2 w oody spic e he rb a l bl a c k f rui t st one f rui t mi n e ra l re d f rui t ja m ra is in ve g e ta l dr ie d f low e rs fl o ra l ch em ic a l ca ra m e l an im a l pa st ry dr ie d f rui t c it rus f rui t
a
b
Figure 3. Aroma (a) and taste (b) items obtained by centered means analysis and ordered by importance, considering all wines and types.
Descritores do aroma (a) e do gosto (b), obtidos por análise de médias centradas e apresentados por ordem de importância, considerando todos os vinhos em prova.
TABLE V
Aroma rotated component matrix with factor loadings for aroma items and their principal components
Matriz dos descritores de aroma após rotação dos fatores com respetivas carga fatorial e componentes principais
Aroma Items
Principal Component
1 2 3 4 5
OVERRIPE RIPE FRUIT WOODY & SPICE
FLORAL & FRESH
GREEN & OFF FLAVOR floral 0.604 dried flowers 0.734 herbal 0.548 vegetal 0.555 mineral 0.464 citrus fruit 0.646 red fruit 0.833 black fruit 0.616 stone fruit 0.726 raisin 0.695 dried fruit 0.586 jam 0.664 pastry 0.576 spice 0.644 caramel 0.742 woody 0.806 chemical 0.735 animal 0.758
Extraction Method: Principal Component Analysis; Rotation Method: Varimax.
% of variance explained by each component, respectively: 13.700; 12.736; 11.711; 11.372; 11.252.
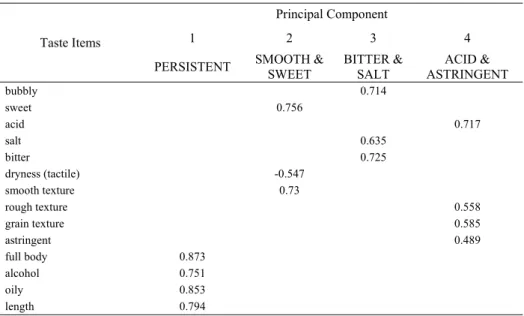
The EFA for taste shows four components explaining 62.87% of the variance. The factor loadings for taste items are presented on Table VI. Group 1 is composed by full body, alcohol, oily and length easily recognized as members of the “persistent” profile. The second Group joins the tastes sweet, smooth texture and (the inverted assessment corresponding to) tactile dryness, and may be referred to as “smooth & sweet”. We must emphasize the opposite assessment between “tactile dryness” and the two descriptors “smooth texture” and “sweet” profile (associated with “smooth & sweet” profile) made by the expert’s panel, because the panel discriminates them inversely. That is, when the panel of experts considers that a particular wine is characterized by having high levels of flavor descriptors “sweet” and “smooth texture”, then the evaluation of “tactile dryness” in that wine is inversely proportional. Group 3 includes salt, bitter and bubbly to express the “bitter & salt” profile. Bitter taste was unexpectedly assessed differently from astringent sensations as they usually appear correlated (Lesschaeve and Noble, 2005) and its inclusion in a “bitter and salt” profile can be related with sensations of under maturation of the grapes. Group 4 adds grain and rough textures,
astringent and acid taste, encompassing the evaluation of a rough sensations profile designated by “acid & astringent”. This grouping of acid and astringent sensations can be explained by the well known influence of the acidity in the increasing astringency perception (Fontoin et al., 2008).
Aroma and taste radar profiles
Table VII presents the principal components and means for the data collected from the 399 questionnaires applied in the present research and for the data collected from questionnaires applied in Jose-Coutinho et al. (2012, 2013, 2015b) research, which was here analyzed under the same principal components. Both samples are showed but it must be noted that the first sample is based on a real sensory experience (and wine comparative) and the second is based on cognitive memory and expert knowledge (in absolute terms without any comparison). Because this experimental design leads to intensity differences, only presence or absence of the descriptors is analyzed. The methodology follows Jose-Coutinho et
al. (2012, 2013, 2015b) work, and the components
obtained grouped the items in a correct conceptual way.
Ciência Téc. Vitiv. 31(2) 73-87. 2016
TABLE VI
Taste rotated component matrix with factor loadings for taste items and their principal components
Matriz dos descritores do gosto após rotação dos fatores com respetivas carga fatorial e componentes principais
Taste Items
Principal Component
1 2 3 4
PERSISTENT SMOOTH & SWEET BITTER & SALT ASTRINGENT ACID &
bubbly 0.714 sweet 0.756 acid 0.717 salt 0.635 bitter 0.725 dryness (tactile) -0.547 smooth texture 0.73 rough texture 0.558 grain texture 0.585 astringent 0.489 full body 0.873 alcohol 0.751 oily 0.853 length 0.794
Extraction Method: Principal Component Analysis; Rotation Method: Varimax. % of variance explained by each component, respectively: 21.804; 14.567; 13.756; 12.742.
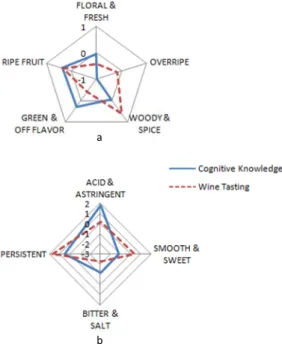
Figure 4 represents the centered mean aroma components for both samples and it can be seen that although graphic areas do not coincide exactly, one can argue that both vectors “woody & spice” and “ripe fruit” have a significant presence in the aroma profile of PDO Bairrada and PGI Beira Atlântico wines. These results corroborate findings on the free varietal and pre-fermentative related volatile compounds in crushed grapes from Baga cultivar (Coelho et al., 2006). In the cited research, the sesquiterpenoids was the group with higher number of constituent varietal compounds and reported as exhibiting spicy and woody aromas that could contribute favorably to the wine aroma characteristics. Another research analyzed the volatile composition of Baga single-varietal red wine. According to aroma index and odor descriptor, the nine compounds that seemed to be the most powerful odorants present in the wine are guaiacol, 3-methylbutanoic acid, 4-ethoxycarbonyl-butyrolactone, isobutyric acid, 2-phenylethanol, γ-nonalactone, octanoic acid, ethyl octanoate and 4-(1 hydroxyethyl)-γ-butyrolactone). It has been concluded that it presents ripe red fruit, cherry, strawberry, vegetal, sweet and smoke/phenolic notes (Rocha et al., 2004), which are also closely correlated with the aroma profile identified in our present research, suggesting that the Baga cultivar plays an
important role on aroma profile of PDO Bairrada and PGI Beira Atlântico wines.
TABLE VII
Principal component means related to aroma and taste items for both “Wine tasting” and “Cognitive knowledge” methods
Médias de intensidade das componentes principais para aroma e gosto comparando os métodos: “experiência e conhecimento
cognitivo” e “prova clássica de vinho”
Principal Component
Sample Wine
Tasting Knowledge Cognitive Mean(SD) Mean(SD)
Aroma
FLORAL & FRESH 2.04(1.23) 3.98(1.26)
OVERRIPE 2.28(1.32) 3.17(1.07)
WOODY & SPICE 3.08(1.57) 4.09(1.27) GREEN & OFF FLAVOR 2.05(1.53) 4.43(1.60)
RIPE FRUIT 2.80(1.66) 4.50(1.20)
Taste
ACID & ASTRINGENT 3.81(1.23) 6.08(1.09) SMOOTH & SWEET 3.97(1.39) 3.04(0.88) BITTER & SALT 1.32(1.01) 3.10(1.42)
PERSISTENT 5.33(1.58) 4.80(0.84)
a
b
Figure 4. Aroma (a) and taste (b) radar profiles, obtained by centered mean analysis for both “cognitive knowledge” and “wine
tasting” methods.
Perfil radar para as componentes principais do aroma (a) e do gosto (b), obtidos por análise de médias centradas para ambos os
métodos: “experiência e conhecimento cognitivo” e “prova clássica de vinho”.
The “green & off flavor” component in wine tasting is not present at same intensity level as it was in Jose-Coutinho et al. (2012, 2013, 2015b) research based on cognitive knowledge. Conversely, the “overripe” aroma component is now more evident. These facts could be related to improvements on viticultural and winemaking practices and also facilitated by warming climatic changes that have been encouraging grape ripeness, reducing its green character and inducing a shift to a more driven ripe fruit character. The temporal gap between conceptual and perceptual expertise (Cadot et al., 2012) can explain the differences achieved.
Thus, based on the information collected from principal component method and also considering the more distinctive aromas resulting from the centered mean analysis, we can argue that PDO Bairrada and PGI Beira Atlântico wines have a woody & spice, ripe fruit aroma profile with also herbal and mineral aromas.
The centered mean taste components for both samples are also represented in Figure 4. It can be seen that the wine profile for taste is mainly on the fourth quadrant “persistent” - “acid & astringent”, but at same time balanced with a “smooth & sweet” taste component. The “bitter & salt” component is not present in a same intensity level.
Based on the information collected from principal component method and also considering the more distinctive taste items resulting from the centered mean analysis, we can argue that PDO Bairrada and PGI Beira Atlântico wines can be defined as having pronounced “acidity & astringency”, balanced with a “smooth & sweet” taste component and being very persistent.
Analyzing wine type by principal components
Table VIII shows the aroma and taste components per wine type. It can be seen that the “Clássico” type is statistically different from the others on “overripe”, “woody & spice”, “acid & astringent” and “persistent”, having higher presence in all of them.
TABLE VIII
Principal components means related to aroma and taste items for the 3 types of wine
Médias de intensidade das componentes principais encontradas para os descritores de aroma e gosto, comparando os 3 tipos de
vinho Principal Component Wine type Regional PDO Bairrada “Clássico” Mean(SD) Mean(SD) Mean(SD)
FLORAL & FRESH 2.08(1.26) 1.97(1.17) 2.08(1.27) OVERRIPE 2.06(1.23) 2.03(1.20) 2,80(1.38)** WOODY & SPICE 2.68(1.56) 2.89(1.33) 3.80(1.67)** GREEN & OFF
FLAVOR 1.95(1.60) 2.10(1.50) 2.12(1.48) RIPE FRUIT 2.84(1.69) 2.75(1.65) 2.83(1.64) ACID &
ASTRINGENT 3.55(1.35) 3.78(1.08) 4.17(1.21)** SMOOTH & SWEET 4.14(1.50) 3.83(1.21) 3.94(1.46) BITTER & SALT 1.25(0.92) 1.35(1.03) 1.36(1.09) PERSISTENT 4.94(1.73) 5.12(1.34) 6.05(1.45)** ** statistical significance (p <0.01); SD - standard deviation.
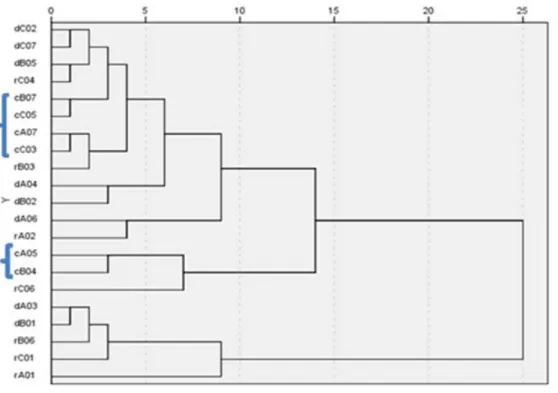
The center of interest of this study is the determinants of the aroma and the taste (evaluated on their own) thus a cluster analysis (Figure 5), considering all wines and types, was performed for the nine principal components of aroma and taste. Other characteristics and relationships may be addressed in future studies using the frame presented.
Figure 5. Cluster analysis for the nine components of aroma and taste items considering all wines and types.
Análise de clusters realizada para as nove componentes principais encontradas para os descritores do aroma e do gosto, considerando todos os vinhos em prova.
We can see that the “Clássico” type tends to group together, although with some wines from regional and PDO groups being mixed, confirming a certain distinctiveness of this type of wine and also strength the adequacy of the components as the vectors of the PDO Bairrada and PGI Beira Atlântico wines. This tends to be a sensitivity analysis to the components, i.e., the components comply with the wine classification.
CONCLUSIONS
This is the first time that an extensive study has been attempted to characterize the sensory profile and typicality of PGI Beira Atlântico and PDO Bairrada wines.
These wines were characterized by having a ruby color, with medium-high intensity. On the nose they presented a medium to medium-high intensity, with a “woody & spice” and “ripe fruit” aroma profile with also herbal and mineral aromas. On taste, these wines can be defined as having pronounced “acidity & astringency”, balanced with a “sweet & smooth” mouthfeel component and being very “persistent”.
Results from this research, based on wine tasting and sensory experience, were compared with data obtained from Jose-Coutinho et al. (2012, 2013, 2015b) based on cognitive memory and expert knowledge. We can argue that methodology proposed by Jose-Coutinho et al. (2012, 2013, 2015a, 2015b) could be a valid alternative to the conventional wine tasting methods when intended to identify wine regions profiles, although further work on other regions might continue.
When comparing wine types, we could not find any difference between Regional and PDO Bairrada wines in terms of typicality and sensory profile, as Jose-Coutinho et al. (2012, 2013) had already achieved on his research. However, the small group of “Clássico” wine was clearly identified by the tasters as being more typical, with more color and nose intensity. In addition, it was also identified a substantial increase on its spice & woody character as well as more overripe fruit character on the nose. On the taste, “Clássico” wines tends to have a pronounced “acidity & astringency” component when compared to regional and PDO Bairrada wines and are also more persistent. These results point to “Clássico” group reached a distinct level and suggest that Bairrada region has an opportunity to
differentiate these wines among others, keeping its own typicality and identity, facilitating its recognition abroad, which could lead to Bairrada affirmation in the global wine industry. However, when analyzing the mean prices of the three types of wines, we can realize that “Clássico” wines tend to be four and eight times more expensive than Regional wines and PDO wines, respectively, which could have a great impact on consumer choice.
ACKNOWLEDGMENTS
The authors would like to thank Comissão Vitivinícola da Bairrada and Estação Vitivinícola da Bairrada for the support provided in the organization of the taste session. A special recognition to all the tasters for their commitment and dedication to this study.
REFERENCES
Ballester J., 2004. Mise en évidence d’un espace sensoriel et
caractérisation des marqueurs relatifs à l’arôme des vins issus du cépage Chardonnay. 204 p. PhD Thesis, Université de Bourgogne
– Universitat Politècnica de Valencia.
Ballester J., Patris B., Symoneaux R., Valentin D., 2008. Conceptual vs. perceptual wine spaces: Does expertise matter?
Food Qual. Prefer., 19, 267-276.
Böhm J., 2007. Portugal Vitícola - O Grande Livro das Castas. 88 p. Chaves Ferreira Publicações, Lisboa.
Cadot Y., Caillé S., Samson A., Barbeau G., Cheynier V., 2010. Sensory dimension of wine typicality related to a terroir by quantitative descriptive analysis, just about right analysis and typicality assessment. Anal. Chim. Acta, 660, 53-62.
Cadot Y., Caillé S., Thiollet-Scholtus M., Samson A., Barbeau G., Cheynier V., 2012. Characterization of typicality for wines related to terroir by conceptual and by perceptual representations. An application to red wines from the Loire Valley. Food Qual. Prefer., 24, 48-58.
Cardoso A. D., 2007. O vinho da uva à garrafa. 55 p. Âncora editora, Coimbra.
Charters S., Pettigrew S., 2007. The dimensions of wine quality.
Food Qual. Prefer., 18, 997-1007.
Coelho E., Rocha S.M., Delgadillo I., Coimbra M.A., 2006. Headspace-SPME applied to varietal volatile components evolution during Vitis Vinifera L. cv. “Baga” ripening. Anal. Chim. Acta, 563, 204-214.
Endrizzi I., Aprea E., Biasioli F., Corollaro M.L., Demattè M.L., Penasa M., Bittante G., Gasperi F., 2013. Implementing sensory analysis principles in the quality control of PDO products: A critical evaluation of a real-world case study. J. Sens. Stud., 28, 14-24.
Fischer U., Christmann M., Heeß W., Hoffmann U., Eisenbarth J., Tesch H., 1999. Development of an Aroma Wheel for German White and Red Wines. In: Proceedings of the 24th OIV World Vine
and Wine Congress, 2, 201-207.
Fontoin H., Saucier C., Teissedre P.L., Glories Y., 2008. Effect of pH, ethanol and acidity on astringency and bitterness of grape seed tannin oligomers in model wine solution. Food Qual. Prefer., 19, 286-291.
Gawel R., Iland P.G., Francis I.L., 2001. Characterizing the astringency of red wine: a case study. Food Qual. Prefer., 12, 83-94.
Gawel R., Oberholster A., Francis I.L., 2000. A "Mouth-feel Wheel": Terminology for communicating the mouthfeel characteristics of red wine. Aust. J. Grape Wine Res., 6, 203-207.
Glories Y., 1984. La couleur des vins rouges. 1ª partie: les équilibres des anthocyanes et des tanins. Conn. Vigne Vin, 18, 195-217.
González-Álvarez M., González-Barreiro C., Cancho-Grande B., Simal-Gandara J., 2011. Relationships between Godello white wine sensory properties and its aromatic fingerprinting obtained by GC-MS. Food Chem., 129, 890-898.
Green J.A., Parr W.V., Breitmeyer J., Valentin D., Sherlock R., 2011. Sensory and chemical characterization of Sauvignon Blanc wine: influence of source of origin. Food Res. Int., 44, 2788-97. Hernández B., Sáenz C., de la Hoz J.F., Alberdi C., Alfonso S., Diñeiro J.M., 2009. Assessing the color of red wine like a taster’s eye. Color Res. Appl., 34, 153-162.
Johnson T., Hasted A., Ristic R., Bastian S., 2013. Multidimensional scaling (MDS), cluster and descriptive analyses provide preliminary insights into Australian Shiraz wine regional characteristics. Food Qual. Prefer., 29, 174-185.
Jose-Coutinho A., 2012. A Contribution to the sensory profile of
regional red wines from geographical indications of mainland Portugal. 95 p. Master Thesis, ISA/UTLisboa, FC/UPorto.
Jose-Coutinho A., Avila P., Ricardo-Da-Silva J.M., 2013. Contribuição para a caracterização sensorial dos vinhos tranquilos tintos com Indicação Geográfica Protegida de Portugal Continental.
Enologia, 61, 25-34.
Jose-Coutinho A., Avila P., Ricardo-Da-Silva J.M., 2015a. Sensory profile of Portuguese white wines using long-term memory: A novel nationwide approach. J. Sens. Stud., 30, 381-394.
Jose-Coutinho A., Avila P., Ricardo-Da-Silva J.M., 2015b. Finding sensory profilers amongst red wine composition: A novel nationwide approach. Ciência Téc. Vitiv., 30, 69-83.
King E., Stoumen M., Buscema A., Ebeler S., Heymann H., Boulton R., 2014. Regional sensory and chemical characteristics of Malbec wines from Mendoza and California. Food Chem., 143, 256-267.
Kontkanen D., Reynolds A., Cliff M., King M., 2005. Canadian terroir: sensory characterization of Bordeaux-style red wine varieties in the Niagara Peninsula. Food Res. Int., 38, 417-425. Lesschaeve I., Noble A.C., 2005. Polyphenols: factors influencing their sensory properties and their effects on food and beverage preferences. Am. J. Clin. Nutr., 81, 330S-335S.
Llobodanin L., Barroso L., Castro I., 2014. Sensory characterization of young South American red wines classified by varietal and origin. J. Food Sci., 79, 1595-1603.
Lund C., Thompson M., Benkwitz F., Wohler M., Triggs C., Gardner R., Heymann H., Nicolau L., 2009. New Zealand Sauvignon Blanc distinct flavour characteristics: Sensory, chemical, and consumer aspects. Am. J. Enol. Vitic., 60, 1-12.
Maitre I., Symoneaux R., Jourjon F., Mehinagic E., 2010. Sensory typicality of wines: how scientists have recently dealt with this subject. Food Qual. Prefer., 21, 726-31.
Mueller S., Osidacz P., Francis I., Lockshin L., 2010. Combining discrete choice and informed sensory testing in a two-stage process: Can it predict wine market share? Food Qual. Prefer., 21,741-54.
Parr W.V., 2009. Geographical indication and the concept of wine typicality. ChemoSense, 11, 16-17.
Parr W.V., Valentin D., Green J.A., Dacremont C., 2010. Evaluation of French and New Zealand Sauvignon wines by experienced French wine assessors. Food Qual. Prefer., 21, 56-64. Perrin L., Symoneaux R., Maitre I., Asselin C., Jourjon F., Pages J., 2008. Comparison of three sensory Napping (R) procedure: case of methods for use with the ten wines from Loire valley. Food Qual.
Prefer., 19, 1-11.
Portaria n.º 212/2014 - Diário da República n.º 198/2014, Série I, from 14th October 2014.
Robinson A., Adams D., Boss P., Heymann H., Solomon P., Trengove R., 2012. Influence of geographic origin on the sensory characteristics and wine composition of Vitis vinifera cv. Cabernet Sauvignon wines from Australia. Am. J. Enol. Vitic., 63, 467-476. Rocha S.M., Rodrigues F., Coutinho P., Delgadillo I., Coimbra M.A., 2004. Volatile composition of Baga red wine. Assessment of the identification of the would-be impact odorants. Anal. Chim.
Acta, 513, 257-262.
Tonietto J., Sotes Ruiz V., Celso Zanus M., Montes C., Uliarte E.M., Bruno L.A., Climaco P., Pena A., Crivellaro Guerra C., Catania C.D., Kohlberg E.J., Pereira G.E., Ricardo-Da-Silva J.M., Ragout J.V., Navarro L.V., Laureano O., Castro R., Del Monte R.F., Del Monte S.A., Gomez-Miguel V., Carbonneau A., 2014. The effect of viticultural climate on red and white wine typicity. Characterization in Ibero-American grape-growing regions. J. Int.
Sci. Vigne Vin (Spécial Laccave), 19-23.
Williamson P., Robichaud J., Francis I., 2012. Comparison of Chinese and Australian consumers’ liking responses for red wines.