UNIVERSIDADE TÉCNICA DE LISBOA
INSTITUTO SUPERIOR DE ECONOMIA E GESTÃO
DISSERTAÇÃO MESTRADO FINANÇAS
THE CAPITAL STRUCTURE OF
PORTUGUESE FIRMS WITHIN A CRISIS
LUÍS HENRIQUE VECCHIO REIS President: Professor Raquel Gaspar Orientation: Professor Clara Raposo Arguer: Professor José Miguel Almeida September/2011On a given day, or in a given circumstance, you think you have a limit. You go for this limit and you touch this limit and think: “OK, this is the limit!” As soon as you touch this limit something happens and somehow you can go a little bit further. With your mind power; your determination; your instinct and the experience as well… you can fly very high. Ayrton Senna
AGRADECIMENTOS À minha família que me deu o exemplo de união e ajudou a construir os meus valores de espírito de equipa, carácter, respeito e amizade. Ao Luís Carlos, Flávia, Paty e Carol, que sempre me apoiaram incondicionalmente em todos os projectos da minha vida. À Bia, que me completa e me ajuda sempre em todos os momentos da minha vida. Pelo seu carinho, amor e amizade, e pela sua maneira divertida de ver as coisas da vida: TQM. À minha segunda família, em Portugal, que me recebe muito bem e que me faz sentir em casa, pela convivência, conversas, experiências e diversão.
Aos Professores pelo conhecimento passado e através dos quais pude crescer pessoalmente, profissionalmente e academicamente.
Em especial à minha orientadora Professora Clara Raposo pela disponibilidade, pela oportunidade e pelas conversas sinceras que me fizeram tanto crescer academicamente, profissionalmente e pessoalmente; agradeço também à orientação e a revisão crítica do texto.
A todos os amigos e colegas que souberam criticar e elogiar, sempre pensando no meu bem.
Aos meus colegas de Pós‐Graduação em Análise Financeira que me fizeram crescer muito academicamente e profissionalmente. E também pelos momentos de diversão proporcionados por todas as “jantaradas” de final de bloco.
Aos meus colegas de Mestrado em Finanças em especial ao meu excelente e sempre coeso grupo de trabalhos composto pela Ana Cristina, Hélia, André e Pedro. Agradeço os momentos de discussão que nos fizeram crescer, as apresentações de trabalho, aos estudos conjuntos, e o triunfo comemorado.
Abstract
In this study we review the theoretical approach behind the capital structure decisions by presenting the ideas of the Modigliani and Miller (1958) Theorem that was based on the perfect capital markets world and with the argument of the law of one price. We show that there are two useful theories in the firm’s financing decision: the Trade‐off theory, which builds on Modigliani and Miller’s original arguments and identifies several relevant factors in determining a firm’s capital structure (such as taxes, costs of financial distress, and agency costs and benefits of debt), and the Pecking Order Theory of Myers and Majluf (1984). Further in this study we describe the evolution of the capital structure of the 16 largest listed non‐financial Portuguese firms (“PSI‐16”) during the recent crisis peaking in 2008. We present a description of the level debt (and net debt) compared to the book value and to the market value of the equity of such firms (debt to equity ratio). We find some evidence consistent with both theories. In particular we find a cautious utilization of debt due to higher risk of bankruptcy (and its costs), but still taking advantage of the interest tax shield (consistent with the trade‐off theory view), and an increase in retained earnings and absence of new issues (consistent with the pecking order theory). We explain that the firms’ financing decision can depend of several factors pointed by the Trade‐off Theory, such as tax advantages of using debt, agency costs and benefits of debt, and costs associated with financial distress. Yet, in times of crisis firms may prefer to use internal rather than external financing mainly because of asymmetry of information.
Keywords: capital structure decision, M&M theorem, trade‐off theory, pecking order theory, internal and external source of financing, perfect capital markets, law of one price, financing hierarchy, asymmetry of information, debt‐to‐equity ratio.
Resumo
No presente estudo, fazemos uma revisão da literatura em relação às decisões de estrutura de capital através da apresentação do Teorema de Modigliani e Miller (1958), sendo este baseado num mercado de capitais perfeito com o argumento assente na Lei do Preço Único. Mostramos que existem duas teorias úteis para a decisão de financiamento de uma empresa: a Trade‐off Theory, que está assente sobre os argumentos originais de Modigliani e Miller e identifica vários factores relevantes na determinação da estrutura de capital de uma empresa (como os impostos, os custos de financial distress, custos de agência e benefícios do uso de dívida); e a Pecking Order Theory de Myers e Majluf (1984). Mais além neste estudo, descrevemos a evolução da estrutura de capital das 16 maiores empresas cotadas portuguesas não financeiras (“PSI‐ 16”) durante a recente crise que teve o seu pico em 2008. Apresentamos uma descrição do nível de dívida (e dívida líquida) comparada com o valor contabilístico e o valor de mercado das empresas (rácio debt to equity). Pudemos encontrar alguma evidência consistente com ambas as teorias. Por um lado, as empresas mostram uma certa cautela na utilização de dívida devido ao aumento do risco de falência (e os seus custos), mas ainda tirando vantagem do interest tax shield (consistente com a visão da Trade‐off Theory). Por outro lado, verificamos um aumento dos lucros retidos e nenhuma nova emissão (consistente com a Pecking Order Theory). Concluímos que as decisões de financiamento de uma empresa dependerão de diversos factores apontados pela Trade‐ off Theory, como as vantagens fiscais na utilização de dívida, custos de agência e benefícios do uso de dívida, e custos associados com financial distress. Ainda, em tempos de crise as empresas podem preferir usar financiamento interno no lugar de externo, principalmente devido à assimetria de informação.
Palavras‐chave: decisão de estrutura de capital, teorema M&M, trade‐off theory, pecking order theory, fontes de financiamento interna e externa, mercado de capitais perfeito, lei do preço único, hierarquia de financiamento, assimetria de informação, rácio debt‐to‐ equity.
CONTENTS 1. INTRODUCTION ... 1 2. FINANCING CHOICES ... 4 2.1. Internal and external financing ... 4 2.2. Firms’ life cycle and financing needs ... 5 3. THE FINANCING MIX: A REVIEW OF THE LITERATURE ... 7 3.1. Irrelevance of debt in perfect capital markets ... 8 3.2. Corporate tax advantages of debt ... 10 3.3. Irrelevance of debt with corporate and personal taxes ... 11 3.4. Financial distress costs of having debt ... 12 3.5. Agency costs of debt: conflicts between lenders and equity holders... 14 3.6. Agency benefits of debt: the managers are disciplined by debt ... 15 3.7. Trade‐off theory: a summary ... 16 3.8. Pecking order theory: a different approach to the capital structure problem .... 17 4. THE PORTUGUESE FIRMS WITHIN A CRISIS: AN EMPIRICAL APPROACH ... 19 4.1. Data characteristics and description of the main figures ... 19 4.1.1. The evolution of Debt, Equity, and Debt‐to‐Equity Ratio ... 19 4.1.2. The evolution of retained earnings... 22 4.1.3. Summarizing the facts ... 23 4.2. Analysis of the data ... 23 4.2.1. Interest Expenses, EBIT and Tax Benefit on Debt ... 23 4.2.2. Financial distress costs ... 28 4.2.3. Agency costs of debt ... 29 4.2.4. Agency benefits of debt ... 29 4.2.5. Pecking order theory ... 30 5. SUMMARY AND CONCLUSIONS ... 32 REFERENCES ... 35 APPENDIX ... 37
LIST OF TABLES Table 1: Trade‐off theory summary ... 16 Table 2: Preferred source of financing to managers ... 18 Table 3: PSI‐16 firms EBIT ... 24 Table 4: PSI‐16 interest expenses ... 24 Table 5: PSI‐16 firms Annual Interest Tax Shield ... 26 Table 6: Average interest rate paid ...27
LIST OF FIGURES Figure 1: Firm's life cycle and financing transitions ... 5 Figure 2: Cost of capital in M&M world ... 10 Figure 3: Level of debt with taxes, financial distress and agency costs ... 17 Figure 4: Debt‐to‐Equity Ratio for the “PSI‐16” ... 20 Figure 5: Logarithmical returns 2006‐2010 (PSI‐20) ... 20 Figure 6: Net Debt‐to‐Equity Ratio for the “PSI‐16” ... 21 Figure 7: PSI‐16 firms retained earnings ... 22
1. INTRODUCTION
Many firms can find much of their financing needs internally, using only the owner’s equity to run the company. However, some of them will naturally feel the need to increase the range of their financing choices either using internal sources of financing or external.
Start‐up companies will be all‐equity held i.e., the owner’s equity is financing the whole structure of these small businesses. As the firms become larger, they will tend to use bank debt in order to finance some lease operations, purchase of new equipments or even use this kind of debt to run a part of the operations. As firms expand even more, it is very likely that an initial public offer happens to raise external equity. Some firms will meet a high‐growth and also a mature‐growth stage in which they will mainly use their internal cash‐flows from past investments to finance their structure but they can also raise more equity or debt from the market to finance some specific projects with seasoned issues.
Knowing that firms can have different sources of financing – internal and external equity or debt, how do these firms select their capital structure? To answer this question, Modigliani and Miller have published in 1958 a paper that is considered the fundamental milestone regarding the Modern Theory of Finance, which is also known as M&M Theorem. This result has been the basis for further studies which have identified important factors that influence the choice of capital structure made by a firm, such as Taxes, Costs of Financial Distress or Agency costs.
Nowadays, the finance experts have recognized those factors and the current problem is to evaluate their effect in the firm’s value. Specifically speaking about times of crisis, many people defend that the regulations on the financial sectors should bring confidence to the markets and, consequently, to the investors. However, more restrictive measures on the market will add limits to the liquidity of the whole system and, in the long term, this is even worse to the economy. Nevertheless and according to what Miller (1990) said, we should avoid the idea of “anti‐leverage hysteria” because we should not only have in mind the irrelevance of debt theorem but also the way of thinking about every finance problem.
In the practical approach of this study, we will bring a descriptive analysis of the debt level of the 16 largest listed non‐financial Portuguese companies, from 2006 until 2010,
taking into consideration both book value and market value of equity and the notion of debt and net debt. We will be using as reference the financial statements, the annual financial reports and also market data about the firms such as stock prices throughout the years. Thus, our main goal is to describe changes in the financing mix of the main Portuguese firms during the crisis.
In a second moment we will describe and analyze the impacts of the known capital market frictions in the financing mix decisions of these firms in a particularly turbulent period of the Portuguese and World economies. We will try to assess – with the obvious limitation of such a small data set – the relevance of the various theories of corporate finance in these firms. For example, we will try to infer to what extent the trade‐off theory or the pecking order theory have influenced the capital structure decisions of the Portuguese firms.
According to the trade‐off theory, it is expected that the firms will increase their level of debt in order to take advantage of expected higher tax rates due to the financial crisis and Eurozone debt crisis we are still living in. On the other hand firms would only increase their debt level until the point that their EBIT is enough to face interest expenses and still generate value to equity holders. In the contrary, the interest tax shield is not creating but destroying value. The pecking order theory, on the other hand, proposes a hierarchy of financing sources, mostly due to asymmetric information considerations, which may be more acute during a crisis.
In the final part of this study, we consider the frictions of the capital markets to try to analyze the effect of other costs that can destroy the firms’ value, according to the trade‐ off theory. It is expected that the financial distress and bankruptcy costs are very relevant in these times and, thus, they act negatively in the firms’ value. In what concerns the pecking order theory we checked to what extent firms relied in cash or retained earnings versus new issues of debt or of equity during the mentioned period.
At the end, we have found some evidence towards both theories of capital structure: trade‐off and pecking order theories. Regarding the former, most of the firms were able to generate value through the interest tax shield, being mainly influenced by the tax and interest rates. But still, firms have been cautious in increasing their debt levels, quite possibly due to worries about financial distress and the costs associated with it. Regarding the latter, firms have retained a lot of earning since the collapse of the crisis in
2008, and have completely avoided new issues of equity in a volatile market in which they would risk undervaluation. We detail the theoretical approach that supports the analysis and conclude that a firms’ debt and equity choice will depend on a portfolio of factors identified by the theory, which have different weights in a firm’s decision in long periods of crisis.
2. FINANCING CHOICES
2.1. Internal and external financing
Many firms can find the bulk of their funding needs internally from the cash flows from existing assets. However these firms can find themselves in a common situation that is the need of raising external capital to invest in a new project or assets in order to increase the firm’s value. Therefore, we can say that a firm’s choice of financing itself comes from the necessity of raising external capital in order to apply it in unexplored opportunity.
Indeed, there are many sources of financing. We can categorize these sources as internal financing (commonly denominated as internal equity) which is the free cash flow that belongs to the shareholders. The external cash flows, such as funds raised from private sources or financial markets are so‐called external financing.
Firms may prefer internal equity to external for several reasons. For private firms, for instance, external financing is typically difficult to raise, and even when it is available it is usually accompanied by a loss of control and flexibility, and also because of the information asymmetry between managers and shareholders. On the other hand, publicly traded firms may prefer to raise funds through issuance of new equity or debt. However, this is still expensive in terms of issuance costs and flexibility on investment decisions. As the external financing option tends to be more expensive and inflexible, firms tend to use the internal sources to finance operations and external to finance projects.
Although firms may prefer the use of internal financing as suggested by Pinegar and Wilbricht (1989) and mainly demonstrated by Myers and Majluf (1984), there are some limits to it. Firms must recognize that the cost of internal equity is equal to the cost of external equity, in equilibrium. Modeling these costs through a risk and return model, such as the CAPM and the APT1, must result in the same cost either for internal (retained earnings) and external equity (issuance of stocks). In addition, firms must know that internal equity is clearly limited by the cash flows generated to the shareholders. Considering that firms will pay dividends very often, the net cash flows may not be
sufficient to finance all their projects. Therefore, depending entirely from the internal equity may result in some project delays or the possible loss of such projects to the competitors. Finally, managers should take into consideration that stock price behavior could affect the financing of projects. Many external stockholders are more likely to trust their cash flows to the company with a rising stock price than to one with a dropping price.
2.2. Firms’ life cycle and financing needs
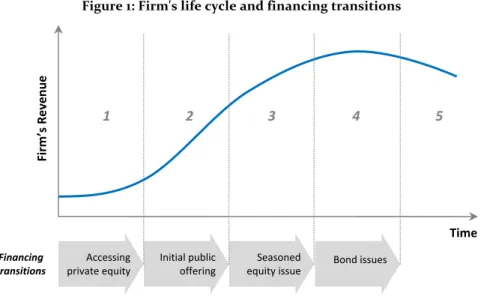
Presumably, as firms grow and mature, their cash flows increase and their risk exposure meets the average risk for all companies. Thus, we could consider that firms can have five stages of growth and mature, as is common found in the literature (Damodaran, 2001). In each stage, firms will be using some kind of mix in their financing structure. The figure below summarizes the five stages of the firms’ life cycle and establishes the relationship with the financing choices of them:
Figure 1: Firm's life cycle and financing transitions
Start‐up (1) firms would be held almost entirely by owner’s equity and sometimes with low level of bank debt. In this stage of their life cycle, the business is attempting to attract customers and gain market share. By reaching the Expansion (2) stage, the firm establishes its quota on the market. Its funding needs increase as the internal cash flows may not be sufficient to run the company. At this stage, the firm will probably start to raise funds directly on the market through stock issues. At the High Growth (3) stage, the firm choices of financing increase significantly. The firm will mostly meet its needs through equity financing such as common stock issues, equity options and warrants. The Firm’s Re ven u e Accessing private equity Initial public offering Seasoned equity issue Bond issues Financing transitions Time 1 2 3 4 5
firm can be also using debt securities to raise capital such as a convertible bond. At the Mature Growth (4) the cash flows are still coming from the past investments but future investments are not much more needed. Internal financing will probably be sufficient to cover funding needs as the firm starts to change the sources of external financing, from external equity to external debt such as bank loans and bond issues. At the Decline (5) and final stage of a firm’s growth, it will see its turnover starting to decline and consequently, its revenues and earnings as it can find itself being overtaken by other fresh competitors. The firm will be more likely to buyback stocks and retiring debt as we could say that the company is, actually, liquidating itself.
However, not all firms go through these five stages. Many of the new start‐ups will fail to survive or even stay as a small privately held business for its entire life. On the other hand, some firms will start‐up from a venture capital risen externally and will grow very rapidly but not being a publicly traded company with no access to the capital markets by choice. And, finally, some firms will make their way over the five stages trying to start another cycle when reaching the final one by launching new products or expanding to other markets, for instance.
In this study the firms analyzed have passed the first 3 stages, being sufficiently large supposedly to have access to all types of capital, but being constrained by an unusually illiquid market.
3. THE FINANCING MIX: A REVIEW OF THE LITERATURE
We have seen that the companies can have different sources of funding both internally and externally. Firms can use the capital markets in order to increase their equity or raise funds through a debt issue. On the equity side, firms can use either common stock issues or hybrid securities such as equity warrants and options. On the debt side, it is very usual to find corporate bonds or commercial paper. Nowadays, there are many types of securities and financial instruments that can help companies to raise capital that will help them to meet their financing needs. We saw that firms are likely to use different sources of funds according to their life cycles and also that the sources are actually changing through a firm’s life.
In 1958, Franco Modigliani and Merton H. Miller published an important theorem that would change the way of thinking in every finance problem and became known as the M&M Theorem. Based on some important assumptions that Miller considered the “Perfect World for the Economists” – there are no taxes, there are no transactions costs and there are no costs associated with a firm’s bankruptcy, M&M has showed that the debt level of a firm was actually irrelevant to determine the firm’s cost of capital. Until their theorem, many believed that the firm’s cost of capital would decrease as the firm increase its debt level. Their paper has become very important to the study of corporate finance and the authors have won, some years later, a Nobel Prize each – Modigliani in 1985 and Miller in 1990. They have based their argument on the “Law of One Price” by the fact that an investor would rapidly recognize any investment opportunity that could maximize his wealth, always searching for the possibility of risk free gains derived from arbitrage – by selling shares of the overvalued firm and buying shares of the undervalued firm. The aggregated effect of the supply and demand would adjust both prices equalizing the levered and unlevered value, making their first proposition (MM I). The next step was their second proposition (MM II) stating that the cost of equity would be a linear function of the firm’s debt level. In order to have the weighted cost of capital constant, the cost of equity should increase as the debt level increases, due to the higher risk for equity holders. Many people argue that the MM Theorem is not completely correct since it is based on a perfect capital market. Although it is true that the markets are not perfect, all scientific theories begin with some idealized assumptions from which conclusions can be taken.
Afterwards, knowing that these assumptions are simplifying the reality, we must evaluate the effect of the frictions found and consider their consequences. Miller has described that the capital structure problem was not about the over or under valuation of firms but how the cash flows are split. If a firm has greater debt level, it only tells us that the generated cash flows go, in a greater part, to debt holder rather than equity holders.
3.1. Irrelevance of debt in perfect capital markets
Modigliani and Miller (1958) have based their argument on a perfect capital market world that would exist under certain conditions. First, they assumed that there were no taxes. Second, they assumed that firms could raise external funds from debt with no issuance costs. Third, they assumed there were no direct or indirect costs associated with bankruptcy. Finally, there were no agency costs derived from asymmetry of information – managers were already acting to maximize shareholder’s wealth and bondholders did not have to worry about expropriating wealth with investment, financing, or dividend decisions.
By simply arguing that an investor would rapidly recognize any investment opportunity that could maximize his wealth, M&M have proposed that the value of a levered firm would be the same as the unlevered firm:
MM Proposition I:
The argument of MM I is that, contrary to the above, the investor would always have the possibility of risk free gains derived from arbitrage, by selling shares of the overvalued firm and buying shares of the undervalued firm. The aggregated effect of the supply and demand would adjust both prices equalizing the levered and unlevered value.
In this scenario, it is quite clear that the advantages and disadvantages of borrowing will disappear. Debt creates neither benefits nor cost and therefore has a neutral effect on the value. The capital structure only determines how the cash flows are split and not the total cash flow generated.
In order to maintain the cost of capital constant, M&M have also proposed that the cost of equity would be a linear function of debt:
MM Proposition II:
We can also conclude that, in a perfect capital market, the Weighted Average Cost of Capital (WACC) of a levered firm will be equal to the cost of equity of an unlevered firm which is equal to the return on the firm’s assets: Where the WACC is given by: Following MM’s initial propositions and considering the CAPM setting, it is possible to derive the weighted beta of the firm which is the same as the unlevered beta, measuring the firm’s exposure to systematic risk: If a firm changes its financing mix without changing its investments, its unlevered beta will remain unchanged. However, Hamada (1972) and Rubinstein (1973) have studied the existing relationship between leverage and equity beta, and have shown that increasing leverage on a firm’s capital structure will result in a higher cost of equity since the additional risk is reflected in the firm’s beta (rearranging):
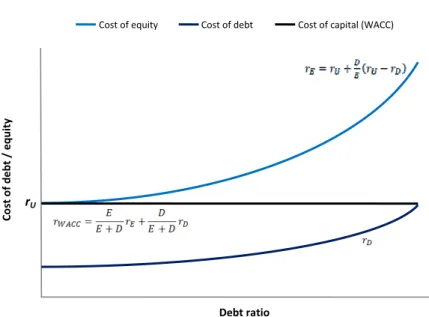
As the debt increases in the firm’s financing structure, both equity and debt become riskier and consequently their costs increase. Since the cost of capital is a weighted average, as we put more weight on a lower‐debt cost, the final cost of capital remains unchanged:
Figure 2: Cost of capital in M&M world
As a consequence of the unchanged cost of capital, the value of the firm will remain also unchanged despite of the amount of leverage it has. In addition, the investment decision is completely separated of the financing decision. It is to say that if a firm is deciding what projects to invest in, the conclusion of the analysis will not change if the project financing changes. If the project is bad when evaluated all‐equity it will still be bad even if debt is added to it.
3.2. Corporate tax advantages of debt
The Interest Tax Shield is the reduction in the income taxes payment resulting from the deduction of interest in the taxable income of a firm. In order to compute how much the value of a company can increase because of the interest tax shield we make three assumptions, following the Modigliani and Miller (1958) argument of perfect capital markets world: the debt (D) is perpetual – which also means that the savings will be a perpetuity, the appropriate discount rate for this cash flow is the interest rate on the debt (r) and third, the tax rate (t) for the firm will remain unchanged over time. With these three assumptions we can compute: (1) (2) Co st of de bt / equit y Debt ratio rU
Therefore, we can consider that the debt can bring an advantage to the firm as per the value added to it: Another analysis that can be made from the benefits of debt within the scope of taxes is the relationship between them and the optimal financial mix. We can say the benefits of debt are greater when corporate tax rates are higher. According to Mackie‐Mason (1990) and Graham (1996), debt ratios of firms with higher tax rates should be greater than the debt ratios of comparable firms with a lower tax rate. Moreover, firms that have substantial nondebt tax shields, such as depreciation, should use less debt than firms that do not have these shields. We can also say, that if tax rates increase overtime, it is expected that the debt ratios will also increase during the period. And finally, although it is difficult to compare tax rates within countries, it is expected that firms in countries with a higher tax rate, will have higher debt ratios as per the tax advantages of debt. In addition, we emphasize that the interest tax shield will be only efficient up to a certain point. If the generated cash flows are not sufficient to pay interest, the interest tax shield can lead to a decrease in the value of the firm i.e., the interest tax shield will be only effective if the firm’s EBIT is greater than the amount of annual interest to pay. We will check further, in the practical approach of this study, how the crisis could affect the free cash flows of the Portuguese firms and, therefore, if the interest tax shield was indeed effective in terms of value added. 3.3. Irrelevance of debt with corporate and personal taxes The Modigliani and Miller theorem of 1958 makes it clear that the debt does not affect the value of a company even if we add taxes to it. Miller (1977) has demonstrated that by adding personal taxes to the model, the capital structure of a firm is again irrelevant. In practice, assuming that an investor faces a tax rate of td on interest income, and te on
equity income. Also, assuming that the firm pays an interest rate of r on debt and faces a corporate tax rate of tc:
, 1 1 1
With the Tax benefit on debt, Relative to equity (T*) we could write the value of a company as below, assuming a permanent debt (D):
1 1 1
1
In an overall equilibrium in the debt market, T* equals zero, giving us the irrelevance of debt in the value of the company. When T* equals zero, there is no trade‐off between using more debt or equity on a firm’s financing structure. Again, and considering taxes on both corporate and individual level, Miller (1977) has demonstrated that the capital structure of a firm is irrelevant to determine its value.
3.4. Financial distress costs of having debt
The higher the debt of a firm, the higher will be the risk of bankruptcy of this company. This happens because of two issues that may be considered when studying a firm’s capital structure. The probability of bankruptcy is the likelihood of the firm’s cash flow will be not sufficient to meet its operational financing needs and also promised debt obligations (interest and principal). This probability can be computed as a function of the size of the operating cash flow on debt obligations and the variance of these operating cash flows.
We must measure the cost of bankruptcy. Indeed, if a company fails to meet their financial obligations every stakeholder will be affected. Usually, the lenders get some of the cash and equity holders get nothing. In this scenario, there are substantial legal costs that we call the direct costs of bankruptcy. According to an influential study done by Warner (1977) based on 11 American railroads, the direct costs of bankruptcy – including legal and administrative costs – are 5.3% of the assets at the time of bankruptcy. He also estimated that railroads took 13 years in average from the court release until the time of starting its operations again. However, these costs depend on the nature of the firm’s assets. Since railroads have, in general, real estate and heavy fixed equipment as their main assets, it is expected that the bankruptcy costs are higher than for other types of firms. Also, on this study, the authors estimated that if these costs are computed five years before the bankruptcy, they would fall to 1.4% of the firms’ assets value.
According to some important studies about direct costs of bankruptcy, such as Weiss (1990), Altman (1984) and Betker (1997), these costs would be approximately 3% to 4% of firm’s value at the time of bankruptcy. Moreover, LoPucki and Doherty (2004) have shown that because of the professionals involved in important reorganizations such as lawyers, accounting experts, consultants and so on in the 1990’s, the faster resolution of such cases have made the direct costs of bankruptcy fall to 1,4%.
Apart from the direct costs of bankruptcy, there are indirect costs of financial distress which are due to the loss of confidence from suppliers, customers and also employees – who do not want to work for an almost bankrupt firm. It is perfectly predictable that a defaulting company will tend to not attract so many customers as it used to or the attracted customers would not be willing to pay the same price for the products as before. Thus, we will be able to see a significant fall in the firm’s revenue. On the other hand, suppliers will tend to restrict their sales to defaulting firms in order to protect themselves of the failure, which can be seen in the increase of working capital and decrease in cash flows.
Titman (1984) has argued that these kinds of costs differ from one company to another depending on the type of goods and services sold by these firms. The indirect costs of bankruptcy will be higher for (i) Firms that sell durable products with long lives that require replacement parts and service such as a personal computer manufacturer, (ii) Firms that provide goods or service for which quality is an important attribute that is difficult to determine in advance such as an airline company, (iii) Firms producing goods whose value to customers depends on the services and complementary products supplied by independent companies, and (iv) Firms that sell products requiring continuous service and support from the manufacturer.
This factor goes in favor of lower financing with debt:
It is expected that during the crisis, the majority of the companies had an increase of the costs associated with the financial distress due to the fact during the crisis we have a great loss of confidence in the market. This can be reflected in plenty of ways. Beginning by the monetary economy, banks did not have enough liquidity to provide the market with. This lack of liquidity was, in a first moment, felt by firms in the real economy by the less available cash (loans from banks) to run operational activities. In a second phase,
the loss of confidence has reached the consumers who were not spending as much as they used to. At the end, this situation has led to less free cash flow available to the firm since consumers were trying to favor savings rather than spending. 3.5. Agency costs of debt: conflicts between lenders and equity holders When the firm is highly levered, it is likely that conflicts of interest arise. These are the so‐called Agency Costs. On one hand, shareholders will have their equity in the company and will tend to favor actions that increase the value of their holding and possible dividends payout even if it means increasing risk on the available cash flows that bondholders will receive. On the other hand, lenders will try to favor managerial decisions that are less risky since their objective is to receive their constant interest payment without any difficulty. Therefore, these conflicts will be visible whenever a firm decides what projects to take, chooses how to finance a project and determines how much to payout as dividends. For instance, if a company decides to increase their dividend rate, it is far probable that the stock prices increase and bond prices, however, decrease. When there is a new project to be financed, equity holders may tend to issue new debt and give them priority in terms of payment because this will enable better interest rates. But, bond holders often add covenants2 that limit the firms in terms of taking more and more risk on new investment decisions. In practice, the agency costs can show up as much higher interest rates on debt if bond holders believe that the equity holders’ actions will be harmful to them in terms of cash flow generation. Also, a bond holder can add covenants to his debt which will show up as the direct cost of monitoring these covenants and the indirect costs of lost investments, since the firm will not be able to take certain projects. It is worth emphasizing that bond covenants decrease the flexibility of a firm’s financing decisions. By adding financial constrains to debt obligations, bond holders will protect
2 The purpose of a covenant is to give the lender more safety. Covenants can cover everything
from minimum dividend payments to levels that must be maintained in working capital.
Source: <http://www.investopedia.com>.
A company may, for example, agree to limit other borrowing or to maintain a certain level of gearing. Other common limits include levels of interest cover, working capital and debt service cover.
their interest in terms of the destiny of free cash flows. Thus, we can say that firms with larger and unpredictable demands on their financing needs will value their flexibility more than most stable firms. As firms and industries mature, the excess‐return on investment projects drops significantly such as their financial requirements. By this, borrowing needs will decrease and the value given by the company to the flexibility will also decrease. Therefore, if a company is mature enough – which means stable cash flows and lower returns on projects – it will not give so much importance to flexibility, not giving much value to it. We could summarize this trade‐off as: In times of crisis firms may more easily be under stress, which makes these agency costs higher. Perhaps firms don’t want to use more debt, as it becomes more expensive. Lack of liquidity in the market may still force firms to take on more expensive debt. On the other hand, firms can decide to retain earnings to face the liquidity problem and rising interest rates on new debt. 3.6. Agency benefits of debt: the managers are disciplined by debt
According to Jensen (1986), firms can generate free cash flows very often, over which managers have the power to decide how to spend them. These cash flows can be spent in operations, paid out in cash to the shareholders or invested in new assets, for instance. The underlying idea about the discipline of debt is that the managers tend to use the free cash flow ineffectively, wasting these resources in useless strategies. Then, firms with little debt or no debt at all, have these large cushions against mistakes because managers have no obligation to pay constantly interest and principal. Thus, we can say that firms with more debt are more efficient in terms of spending their free cash flows because all cash generated will be either spent in the firm’s operations or paid in form of interest and principal. This happens because of the stress caused in terms of default possibility to those inefficient projects.
Summarizing, due to the separation between the ownership and management, managers will not necessarily maximize stockholders interests without inducement for doing it, namely, debt. In other words, borrowing money will cause a financial stress and
commitment in the firms. This stress will make managers spend free cash flow more efficiently in order to pay constant interest and principal.
On the other hand, it is very important to know the amount of debt that can be raised. Actually, the amount of debt gives a company discipline that can be considered as a benefit until a certain point.
Because of the default risk, if a company borrows too much, managers will fear the slightest risk which can make them actually lose very good investment opportunities.
In times of crisis, it is likely that firms with an important debt level in their structure will be more efficient in terms of cash flow spending. They will choose to invest in fewer projects but good ones – with high level of profitability because debt disciplines managers: interest payment and possible debt covenants will limit cash flow spending. In times of crisis, in which cash flow generation is under a lot of pressure anyway, even low levels of debt may be sufficient to discipline managers. 3.7. Trade‐off theory: a summary The last equation presented summarizes the trade‐off theory, as we do in the following table: Table 1: Trade‐off theory summary Advantages of debt Disadvantages of debt Corporate tax advantages of debt: Higher taxes lead to higher tax benefit, increasing the value of the company if we consider taxes only in corporate level. Bankruptcy cost from raising debt: Higher business risks lead to higher costs. Agency benefits of debt: Greater separation between managers and stock holders leads to higher benefits. Conflicts between lenders and equity holders: Greater separation between stockholders and lenders leads to higher costs. Managers, investors and lenders will always have some kind of conflict of interest within the scope of the usage of free cash flows and capital structure. The trade‐off theory
argues that firms make their decisions in terms of capital structure by analyzing both advantages and disadvantages of debt.
According to Korteweg (2002), net effect of benefits and costs of adding debt to the financing structure, takes us to an optimal debt level:
Figure 3: Level of debt with taxes, financial distress and agency costs
This figure shows that if we consider all the benefits and costs of debt in an imperfect capital market, the firms will reach an optimal level of debt which can be represented by D*. As the level of debt increases, firms will benefit from the interest tax shield and the incentives to the management. But, if the amount of debt is too high, firms will increase its agency costs, risks associated with financial distress. 3.8. Pecking order theory: a different approach to the capital structure problem As mentioned before, a firm can have different debt ratios according to its life cycle. At different stages of its development the various factors described so far will play roles of different relevance. Start‐up firms will usually use a very small amount of debt or even use no debt. As firms grow, their cash flows become larger and predictable, and they start to use debt. The debt ratio tends to reach its peak when the firms are in mature growth stage. On this stage, firms can have more volatile earnings. This increases bankruptcy costs as firms will tend to not use more debt since the costs start to be higher than its benefits. So, in the earlier stages of development some of the financing sources that typically are available to larger firms are not even a choice to consider.
The pecking order theory argues, according to Myers and Majluf (1984), that firms can also choose their financing mix following a financing hierarchy. Retained earnings are the Value of the debt Value of th e fi rm VU VL D* PV(Interest tax shield) Value
most preferred choice of financing, followed by debt and new equity. Convertible preferred stock is the least preferred choice for managers. Pinegar and Wilbricht (1989) have done a survey asking managers what kind of financing they would prefer to use. Managers were asked to rank six different sources of financing from most preferred to least preferred: Table 2: Preferred source of financing to managers Ranking Source 1 Internal equity (retained earnings) 2 Straight debt 3 Convertible debt 4 External common stock 5 Straight preferred stock 6 Convertible preferred Source: Pinegar and Wilbricht (1989)
The hierarchy in financing choices happens because managers value flexibility and control, and mostly due to asymmetric information between insiders in the firm and outside investors. Managers, defending the interests of their current shareholders will avoid issuing new securities when the market is misvaluing them (in particular if stock is undervalued). External financing such as debt may reduce a company’s flexibility, especially for future issuances of debt because of bankruptcy costs. In addition, debt issuances in form of bonds can add unwanted control such as the covenants. Managers prefer retained earnings also because of issuance costs since it costs more to issue external debt or equity.
4. THE PORTUGUESE FIRMS WITHIN A CRISIS: AN EMPIRICAL APPROACH
4.1. Data characteristics and description of the main figures
This section provides a characterization of the data used on the study as well as a brief description of the main figures for the study of capital structure theory. The analysis was done based on the PSI‐20 index of the Lisbon Stock Exchange, the most important Portuguese index. The PSI‐20 index is made up of the shares issued by the 20 most traded companies listed on Lisbon Stock Exchange.
In the present study, we decided not to take into consideration the traded companies of the Financial Sector (the banks) as they have a different accounting system and regulation framework that could make the global analysis not comparable. At the end, we took off 4 listed Portuguese banks from the index – BANIF, BCP, BES and BPI – reaching a final list of 16 listed companies, naming it as PSI‐16: Altri, Brisa, Cimpor, EDP, EDP Renováveis, Galp, Jerónimo Martins, Mota‐Engil, Portucel, PT Telecom, REN, Semapa, Sonae, Sonaecom, Sonae Indústria and Zon.
The analysis is based on the firms’ financial statements and stock prices of each one that are publicly available. We used as a source of the financial statements, the Reuters3 database, which is internationally recognized as being one of the most important providers of financial information in the world. For the stock prices we used the information available on the NYSE Euronext4 website. We have also analyzed the annual financial reports of each company during the period for additional details. In the appendix 1 you may find this summarized information.
4.1.1. The evolution of Debt, Equity, and Debt‐to‐Equity Ratio
As a starting point of every capital structure analysis, we examined the level of the book value debt, the market value of equity and a comparison between these two external sources of financing throughout the analyzed years (2006‐2010). In appendix 2 we present graphs for each company in which we can observe the evolution of each of these elements. 3 <www.reuters.com> 4 <www.euronext.com>
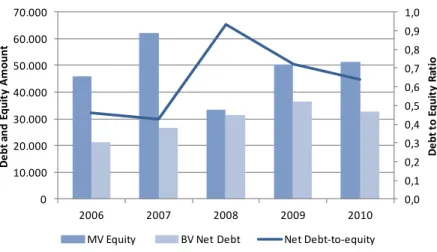
Just out of curiosity, the graph below shows the evolution of the Debt‐to‐Equity Ratio for the aggregated data, given by “Debt‐to‐Equity Ratio ” as well as the total amount of debt (book value) and the total market value of equity for the “PSI‐16”.
Figure 4: Debt‐to‐Equity Ratio for the “PSI‐16”
By analyzing the main features throughout the years, we could verify that the market value of equity was 45.9 billion euros in 2006 and has reached its peak just before the collapse towards the financial crisis in 2007 at 62.2 billion euros. In 2008, the companies feel the first signs of the increased volatility in the market as we show on the graph below:
Figure 5: Logarithmical returns 2006‐2010 (PSI‐20)
As from 2008, the daily volatility on the markets has made the market value of the firms fall to 33.5 billion euros – that represents a ‐46% variation in their values.
Turning to the specifics of a few of these companies, Sonae, Sonaecom and Sonae Indústria were the most penalized companies within the 16 – representing an average variation of ‐74%. On the other side, EDP Renováveis has lost only 3% of its value (‐3% 0,0 0,2 0,4 0,6 0,8 1,0 1,2 0 10.000 20.000 30.000 40.000 50.000 60.000 70.000 2006 2007 2008 2009 2010 De b t‐ to ‐Eq u it y Ra ti o De b t / Equi ty
MV Equity BV Debt Debt‐to‐equity
‐15% ‐10% ‐5% 0% 5% 10% 15% 09/2006 04/2007 11/2007 06/2008 01/2009 08/2009 03/2010 10/2010 05/2011
variation from 2007 to 2008). Jerónimo Martins, REN and Semapa had a variation of ‐23% in average on their market value of equity.
Regarding the book value of debt, we can see that the 16 companies, when considered together have increased the total amount of debt in their capital structure. However, some firms have gone against this trend as Cimpor decreased its total book value of debt in 34% from 2008 to 2010 as well as Mota Engil that have decreased 56% its book value of debt. Sonaecom, Sonae Ind. and J. Martins have also seen their book value of debt decreased by 20% in average.
Concerning the Debt‐to‐Equity Ratio, we can see that the firms have reached a common peak of their ratio in 2008, once the market value of equity was penalized as explained a few paragraphs before. The Debt‐to‐Equity ratio for Cimpor, J. Martins, Portucel and Galp, are clearly below the average as from 2008.
In addition to the previous description, it is important to note that if we consider the Book Value of Net Debt instead of the Book Value of Debt, we have found similar behavior as the previous data. In the appendixes of this study it possible to find the graph below – that show the aggregated data for the PSI‐16 – per each company. In total, we can see that after 2008, firms tended to increase their cash amount as we see the Net Book Value of Debt below decreasing rather than increasing. Detailed information on a per company basis is provided in the appendix 3. Figure 6: Net Debt‐to‐Equity Ratio for the “PSI‐16” Generally speaking, the financing structure of the Portuguese firms was clearly affected by the crisis. In 2008, we could see that the Debt or Net Debt‐to‐Equity ratio reached the 0,0 0,1 0,2 0,3 0,4 0,5 0,6 0,7 0,8 0,9 1,0 0 10.000 20.000 30.000 40.000 50.000 60.000 70.000 2006 2007 2008 2009 2010 De b t to E qui ty Ra ti o De b t an d E qui ty Am o u n t
peak in 2008 and it is decreasing since then when we consider cash retained (second ratio).
It is important to note that during the period between 2006 and 2010, the Book Value of Equity has not changed in any firm, except for a repurchase of shares done by PT Telecom in 2007 that have made their share capital (book value) significantly fall from 395 million to 30 million euros. All other companies have issued no new stock or have repurchased no outstanding shares during the period.
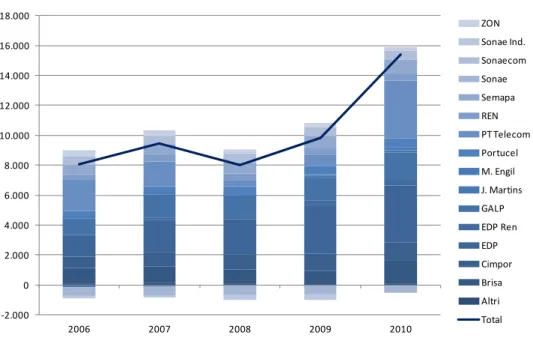
4.1.2. The evolution of retained earnings
As we present the Net Debt‐to‐Equity ratio, netted by the cash amount of each company we are starting to advance to another step in our descriptive analysis: the retained earnings. We present below a graph that shows the exact amount on the Retained Earning account of the balance sheets per each firm. You may find in the appendix 4 a table with the retained earning value per year, per each company. Figure 7: PSI‐16 firms retained earnings This graph show that despite of having some companies with losses rather than profits, we could check that, in general, they have increased their amount of retained earnings since the collapse of the financial crisis. In 2008, the sum of the Portuguese firms’ retained earnings was 8.7 billion euros. Two years later, this amount was 15.4 billion euros, representing an increase of 91% (or an increase of 7.3 billion euros). In this framework, Jerónimo Martins and PT Telecom have led the amount of earnings retained ‐2.000 0 2.000 4.000 6.000 8.000 10.000 12.000 14.000 16.000 18.000 2006 2007 2008 2009 2010 ZON Sonae Ind. Sonaecom Sonae Semapa REN PT Telecom Portucel M. Engil J. Martins GALP EDP Ren EDP Cimpor Brisa Altri Total
among the 16 firms, increasing from 4.1 million euros in 2008 to 199.4 million euros in 2010 and from 383.2 million to almost 4 billion euros, respectively. We must remind ourselves that, the PT Telecom huge profit has come from the hostile takeover bid from Telefónica to buy Vivo – an important subsidiary of PT Telecom, which represented a cash inflow of 5.67 billion euros.
4.1.3. Summarizing the facts
Overall we find as main facts about capital structure of these firms during the 2006‐2010 period: the absence of new issues of equity, an increase in retained earnings and cash, a decrease in the market value of equity, and a cautious utilization of debt. The main reason for fluctuation in the debt‐to‐equity ratio is the significant drop in the market values of stocks.
4.2. Analysis of the data
4.2.1. Interest Expenses, EBIT and Tax Benefit on Debt
We have seen that, because of taxes, the debt can bring benefits to firms. The advantage of using debt will be given by the Annual Interest Tax Shield – referenced on the chapter 3. This shield can be understood as the annual value created by the usage of debt. Therefore, we have computed of the annual interest tax shield for each company. But before that, it is very important to have in mind that, a firm will only benefit from the debt if it is able to generate enough earnings bigger or at least equal to the interest payments. By this, we present below two tables with the EBIT and Interest Payments for each firm in the sample from 2006 until 2010:
Table 3: PSI‐16 firms EBIT
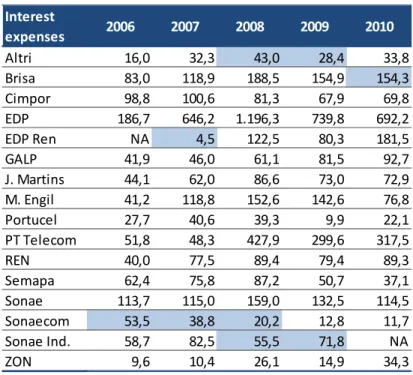
Table 4: PSI‐16 interest expenses
Above, it is possible to check that Portuguese firms have generated enough cash flows to cover interest payments, generally speaking. We highlighted in blue those years when the firms did not generate enough earnings to pay interest from debt. In those years, our analysis of the value created by the interest tax shield cannot be considered since the debt has created no value – no earnings were generated on that moment.
Specifically, we can see that some firms are more stable in the cash flow generation – these firms were actually not affected so much by the crisis, which is the case of EDP and EBIT 2006 2007 2008 2009 2010 Altri 43,7 58,0 39,7 12,6 109,1 Brisa 293,9 281,4 275,8 216,6 52,1 Cimpor 408,1 438,1 392,6 376,9 409,1 EDP 1.291,1 1.560,3 1.930,0 1.969,6 2.062,5 EDP Ren NA 4,3 231,6 230,8 289,9 GALP 968,2 935,6 167,3 458,8 638,7 J. Martins 215,8 225,2 302,8 349,8 451,8 M. Engil 84,2 148,2 192,7 172,4 131,7 Portucel 209,3 260,3 181,1 132,1 277,8 PT Telecom 977,1 915,7 1.056,7 691,9 413,8 REN 608,9 265,0 237,0 258,7 250,5 Semapa 275,7 303,3 216,9 154,2 282,8 Sonae 351,8 452,0 196,0 167,0 395,1 Sonaecom 48,7 22,0 2,8 23,9 64,5 Sonae Ind. 120,1 205,0 ‐22,5 ‐1,9 NA ZON 110,9 74,1 100,1 76,7 82,3 Interest expenses 2006 2007 2008 2009 2010 Altri 16,0 32,3 43,0 28,4 33,8 Brisa 83,0 118,9 188,5 154,9 154,3 Cimpor 98,8 100,6 81,3 67,9 69,8 EDP 186,7 646,2 1.196,3 739,8 692,2 EDP Ren NA 4,5 122,5 80,3 181,5 GALP 41,9 46,0 61,1 81,5 92,7 J. Martins 44,1 62,0 86,6 73,0 72,9 M. Engil 41,2 118,8 152,6 142,6 76,8 Portucel 27,7 40,6 39,3 9,9 22,1 PT Telecom 51,8 48,3 427,9 299,6 317,5 REN 40,0 77,5 89,4 79,4 89,3 Semapa 62,4 75,8 87,2 50,7 37,1 Sonae 113,7 115,0 159,0 132,5 114,5 Sonaecom 53,5 38,8 20,2 12,8 11,7 Sonae Ind. 58,7 82,5 55,5 71,8 NA ZON 9,6 10,4 26,1 14,9 34,3
EDP Renováveis5. Since these firms belong to the Utilities (Electric) sector, it is expected that they have very smooth and non‐volatile income – these firms are operating almost in monopoly and because of that they have more stable earnings. On the other hand, GALP is operating in a very unstable sector (Energy – Oil Exploration). Despite of being operating in a monopoly market, their earnings were strongly affected by the volatile prices of crude oil. We can check that on the crucial crisis year (2008), their earnings have reached the minimum level. However, they have taken advantage from debt because of a very low debt level – lower debt levels has led to lower interest payment covered entirely by the generated earnings.
So, we do find some support for taxes to be a relevant factor in determining the capital structure of these firms.
If we analyze Altri and Sonae Indústria6, for instance, we can clearly see that increasing debt level will not always lead to an increase on the value from the interest tax shield. Altri has ended up with one of the highest debt ratio after 2008 as well as Sonae Indústria. In that year and also in 2009, they were not able to create value from debt since their earnings were below their payments of interest from debt. In the next step of our computation of the Tax Benefit on Debt, we have calculated the Effective Tax Rate per each company and the Effective Interest Payment, given by, which we present on the table below: Effective Tax Rate Tax amountt Net income before taxest Effective Interest Ratet Interest Paymentt Debtt‐1 By computing the effective tax rate of the companies it is possible to check that some of them have actually no tax benefit from debt either because they have tax to receive and/or a small amount to pay. Although the corporate tax rate is 25% in Portugal for these firms, firms are usually being benefited by some fiscal advantage and/or have a tax credit within the fiscal authorities. It is interesting to note that Brisa has actually
5
EDP Renováveis has become publicly traded during 2007 and there are no records of their financial statements before in 2006.
received a tax credit in 2007 which explains the effective tax rate in a negative sense. Sonae and Sonae Indústria have also received tax credit in 2008 as shown above.
After those previous computations, we present the Annual Interest Tax Shield for each company:
Table 5: PSI‐16 firms Annual Interest Tax Shield
Generally speaking, the “PSI‐16” have created value through Interest Tax Shield as we can check on the above table. In this computation we can see some evidence towards the Trade‐off Theory since we can see the value added through the tax benefit on debt. Just note that there are minor exceptions to this analysis: Brisa and Sonae had fiscal benefits in 2007 and 2008, respectively. In those years, these two firms had fiscal benefits which reverted to the company as a credit of taxes. Yet and as explained before, the blank cells correspond to when the firm had its interest payment bigger than the EBIT.
In 2008, we can see that the analyzed firms were able to create 627.4 million euros of value from the tax savings by using debt, the highest creation of value. During the analyzed years, the peak of the total amount of debt was not reached in 2008 but in 2010. The explanation lies on the fact that debt adds discipline to managers as an advantage of using debt. Since in 2008/2009 we were living the height of the financial crisis, managers Interest Tax Shield 2006 2007 2008 2009 2010 Altri 7,2 6,5 Brisa ‐23,3 53,1 32,5 Cimpor 17,5 11,3 12,6 14,8 EDP 162,8 243,8 234,0 196,4 EDP Ren 21,7 41,2 73,7 GALP 11,6 33,5 23,8 34,7 J. Martins 14,6 19,7 14,9 12,8 M. Engil 51,6 64,7 42,2 6,3 Portucel 12,9 7,3 1,0 7,0 PT Telecom 12,6 95,6 92,0 70,7 REN 17,5 43,8 28,8 33,8 Semapa 23,6 13,1 6,3 14,3 Sonae 11,1 ‐9,2 17,9 36,5 Sonaecom 4,7 3,4 Sonae Ind. 20,5 ZON 2,2 29,0 5,5 9,3 TOTAL 342,5 627,4 557,5 520,2