radiation and theoretical methods
P. Limão-Vieira, D. Duflot, F. Ferreira da Silva, E. Lange, N. C. Jones, S. V. Hoffmann, M. A. Śmiałek, D. B. Jones, and M. J. Brunger
Citation: The Journal of Chemical Physics 145, 034302 (2016); doi: 10.1063/1.4955334 View online: https://doi.org/10.1063/1.4955334
View Table of Contents: http://aip.scitation.org/toc/jcp/145/3 Published by the American Institute of Physics
Articles you may be interested in
An experimental and theoretical investigation into the excited electronic states of phenol The Journal of Chemical Physics 141, 074314 (2014); 10.1063/1.4893116
High resolution photofragment translational spectroscopy studies of the near ultraviolet photolysis of phenol The Journal of Chemical Physics 125, 133318 (2006); 10.1063/1.2353818
Excited state hydrogen transfer dynamics in substituted phenols and their complexes with ammonia: energy gap propensity and ortho-substitution effect
The Journal of Chemical Physics 133, 124313 (2010); 10.1063/1.3480396
Advantage of spatial map ion imaging in the study of large molecule photodissociation The Journal of Chemical Physics 147, 013904 (2017); 10.1063/1.4975671
Elastic scattering and vibrational excitation for electron impact on para-benzoquinone The Journal of Chemical Physics 147, 244304 (2017); 10.1063/1.5010831
Time-resolved photoelectron imaging of excited state relaxation dynamics in phenol, catechol, resorcinol, and hydroquinone
Valence and lowest Rydberg electronic states of phenol investigated
by synchrotron radiation and theoretical methods
P. Limão-Vieira,1,a)D. Duflot,2,3F. Ferreira da Silva,1E. Lange,1N. C. Jones,4
S. V. Hoffmann,4M. A. Śmiałek,5,6D. B. Jones,7and M. J. Brunger7,8
1Laboratório de Colisões Atómicas e Moleculares, CEFITEC, Departamento de Física,
Faculdade de Ciências e Tecnologia, Universidade NOVA de Lisboa, 2829-516 Caparica, Portugal
2Univ. Lille, UMR 8523–Physique des Lasers Atomes et Molécules, F-59000 Lille, France 3CNRS, UMR 8523, F-59000 Lille, France
4ISA, Department of Physics and Astronomy, Aarhus University, Ny Munkegade 120,
DK-8000 Aarhus C, Denmark
5Department of Control and Power Engineering, Faculty of Ocean Engineering and Ship Technology,
Gda´nsk University of Technology, Gabriela Narutowicza 11/12, 80-233 Gda´nsk, Poland
6Department of Physical Sciences, The Open University, Walton Hall, MK7 6AA Milton Keynes,
United Kingdom
7School of Chemical and Physical Sciences, Flinders University, GPO Box 2100, Adelaide, SA 5001, Australia 8Institute of Mathematical Sciences, University of Malaya, 50603 Kuala Lumpur, Malaysia
(Received 27 May 2016; accepted 21 June 2016; published online 15 July 2016)
We present the experimental high-resolution vacuum ultraviolet (VUV) photoabsorption spectra of phenol covering for the first time the full 4.3–10.8 eV energy-range, with absolute cross sections determined. Theoretical calculations on the vertical excitation energies and oscillator strengths were performed using time-dependent density functional theory and the equation-of-motion coupled clus-ter method restricted to single and double excitations level. These have been used in the assignment of valence and Rydberg transitions of the phenol molecule. The VUV spectrum reveals several new features not previously reported in the literature, with particular reference to the 6.401 eV transition, which is here assigned to the 3sσ/σ∗(OH) ← 3π(3a′′
) transition. The measured absolute photoabsorption cross sections have been used to calculate the photolysis lifetime of phenol in the
earth’s atmosphere (0–50 km). Published by AIP Publishing. [http://dx.doi.org/10.1063/1.4955334]
I. INTRODUCTION
Phenol, C6H5OH, has attracted considerable attention
from the international scientific community because of its relevance to industry but it also serves as a model system to biologically related molecules (e.g., amino acids). The conversion of renewable biomass into biofuels has shown to be a non-cooperative procedure (known as being
recalcitrant), which still imposes serious cost-ineffective
processes in the de-polymerization of biomass into
ferment-able sugars.1,2 Phenol can also be used as a key model
for understanding the UV photo-induced dynamics of some amino acids, where O–H bond rupture from the phenol moiety can be regarded as a proton release process (or proton tunnelling) from tyrosine residues, which is known to be a prevalent mechanism in a wide range of natural
enzymes.3 Another key aspect for studying phenol has
been centred on probing non-radiative decay processes
(from S1 to S0) in aromatic biomolecules,4 as well as
exploring the role of πσ∗excited states in photodissociation process, allowing therefore to provide distinctively detailed
insights into the fragmentation dynamics.5 This has been
decisive to identify the importance of the strong vibronic
a)Author to whom correspondence should be addressed. Electronic mail:
[email protected]. Tel.: (+351) 21 294 78 59. Fax: (+351) 21 294 85 49.
coupling via a conical intersection between the S0 and
1πσ∗ potential energy surfaces at longer O–H bond
lengths.6–9
Phenol, an aromatic hydrocarbon, is considered as an important atmospheric molecule related to urban air pollution as precursor for the formation of photo-oxidants and secondary organic aerosols. The products of the reactions of the photochemical degradation of benzene, toluene, and xylene-isomers with OH radicals in the terrestrial atmosphere also
yield phenol production.10 Moreover, the contribution of
aromatic hydrocarbons to ozone formation in Europe was
estimated to be as high as 40%,11 whilst Etzkorn et al.12
have suggested that aromatics are the most important class of hydrocarbons for photochemical ozone formation.
Trost et al.13 have reported the room-temperature rate
coefficient for reactions of the OH radical with phenol
(kOH= 26.3 × 10⁻¹²cm3molecule−1s−1), showing that this is
likely to be the main sink mechanism for these molecules in the troposphere. Studies on NO3-initiated oxidation of phenol at
room temperature have been reported by Atkinson et al.10with a rate constant value of(2.1 ± 0.5) × 10−12cm3molecules−1
s−1, where reactions proceed via H-atom abstraction from
the OH group. Night time reactivity of NO3 radicals with
phenol can be regarded as an important sink mechanism for these aromatic hydrocarbons, as well as loss of NO3, possibly
contributing as a source of nitric acid, a key component of acid deposition.11,12
Accurate absorption cross section values, as well as a comprehensive description of the electronic states of aromatic hydrocarbon compounds, are needed as part of a wider research programme aimed at understanding the spectroscopy of these compounds and their role as trace gases in atmospheric chemical and physical reactions. A thorough literature survey reveals scarce data on the vacuum ultraviolet (VUV) electronic state spectroscopy of phenol in a wide energy range as is fully covered in the present contribution. Indeed, experimental information on phenol is mainly restricted to 244 < λ < 283 nm (4.38 < E < 5.08 eV)13 and
200 < λ < 290 nm (4.28 < E < 6.20 eV),14with these studies
including no assignments of the absorption bands. Kimura
and Nagakura15 report the wavelength region 155–300 nm
(4.13–8.00 eV) with four absorption bands assigned to π ← π∗
transitions.
The theoretical data of Lorentzon et al.16 cover the
energy region (4.53–7.84 eV) with a few assignments
of valence states and the first members (n= 3) of the
Rydberg series converging to the two lowest ionisation
energies. Miura and co-workers17 have reported oscillator
strengths of the HOMO(π) → LUMO(π∗
) transition through time-dependent density functional theory (TD-DFT), while electron energy-loss spectra have been reported by Ari
et al.18 Multiphoton ionisation photoelectron spectroscopy
of the phenol 1B
2 state has been obtained to provide
a consistent set of vibrational assignments,19 Kishimoto
et al.20 reported on Penning ionisation electron spectra,
and Livingstone and co-workers21 have performed detailed
studies to investigate the dynamical evolution of the initially
prepared S1 (ππ∗) excited state of phenol through a
time-resolved photoelectron imaging technique. The fragmentation dynamics of gas phase phenol following excitation in the wavelength region 279.145 ≥ λ ≥ 260.000 nm has been
investigated by photofragment translational spectroscopy.22
Molecular geometries and vibrational spectra of phenol have been reported by experimental and quantum chemical
data23 as well as by FTIR experiments.24 Rotationally
resolved fluorescence excitation spectra of the 4.51 eV electronic transition of phenol in a supersonic jet have been
measured.25Finally, we note comprehensive experimental and
theoretical studies on the excited electronic states of phenol26
providing the first investigation of all singlet and triplet states up to the first ionisation potential. This study prefaced substantive electron scattering investigations with phenol27–31
that illustrated the important role of phenol’s excited and ionised states in describing its scattering behaviour.
Recently we have explored the valence and Rydberg electronic state spectroscopy of a related isoelectronic aromatic hydrocarbon, toluene (C6H5CH3),32relevant to urban
pollution, where fossil fuel, industrial burning, and biomass burning are the common sources of emissions. Thorough knowledge gained on the spectroscopic nature of toluene assists in the assignment of the absorption bands of phenol.
In this paper, we report the results of an extensive study of the electronic state spectroscopy of phenol by high resolution VUV photoabsorption spectroscopy and ab initio theoretical calculations of the vertical excitation energies and oscillator strengths for the neutral electronic transitions. In Sec. II,
we provide a brief summary of the structure and properties of phenol. In addition to identifying the optical electronic transitions of phenol, the present work provides reliable photoabsorption cross sections in the range 4.3–10.8 eV.
In SectionIII, we present the computational methods and in
Section IV a brief discussion of the experimental details.
Section V is devoted to the results and discussion with
a comparison with other absolute photoabsorption cross sections. The absolute photoabsorption cross sections are used to calculate photolysis rates in the earth’s atmosphere up to the limit of the stratopause (50 km). Finally some conclusions that can be drawn from this study are given in SectionVI.
II. BRIEF SUMMARY OF THE STRUCTURE AND PROPERTIES OF PHENOL
Phenol has symmetry CSin the electronic ground state,
and the symmetry species available are A′ and A′′. The
calculated electron configuration of the ˜X1A′ ground state
according to Jones et al.26is (a) core orbitals(1a′
)2(2a′ )2(3a′ )2 (4a′ )2(5a′ )2(6a′ )2(7a′
)2and (b) valence orbitals(8a′
)2(9a′ )2 (10a′ )2 (11a′ )2 (12a′ )2 (13a′ )2 (14a′ )2 (15a′ )2 (16a′ )2 (17a′ )2 (18a′ )2 (1a′′ )2 (19a′ )2 (20a′ )2 (21a′ )2 (2a′′ )2 (3a′′ )2 (4a′′ )2. The
highest occupied molecular orbital (HOMO) 4a′′, the second
highest occupied molecular orbital (HOMO–1) 3a′′, and the
third highest occupied molecular orbital (HOMO–2) 2a′′have
πcharacter and may be labelled 4π, 3π, and 2π, respectively.
The lowest unoccupied molecular orbitals (LUMOs) 5a′′and
(LUMO+1) 6a′′are mainly of π∗antibonding character, with
(LUMO+1) having a slight σ∗character along the C–OH bond.
Note that the 3s/σ∗
(OH) is labelled (LUMO+1) in Ref. 26,
whereas here the LUMO notation is reserved to pure valence
MOs. Thus (LUMO+2) in Jones et al.26 is now labelled
(LUMO+1).
The earlier studies of Lorentzon et al.16 have predicted
at the CASPT2 (complete active space self-consistent field with second-order perturbation correction) level of theory the valence and 3s, 3p, and 3d Rydberg states whereas the recent experimental data on the electron-energy loss spectroscopy,26 at moderate electron energy resolution (∆E ∼ 70 meV), did not allow for a more quantitative assignment of the Rydberg-like transitions. Bearing in mind the resemblance between phenol and toluene photoabsorption spectra, we may anticipate for the former an overlap of Rydberg states with valence states resulting in a complex intensity distribution in the electronic spectrum. Rydberg states may be identified through knowledge of the ionisation energies and the application of quantum defect theory. The three lowest ionisation energies, which are required to calculate the quantum defects associated with transitions to Rydberg orbitals, have been identified experimentally to be at 8.64, 9.32, and 11.57 eV.20
III. COMPUTATIONAL DETAILS
Electronic structure calculations were performed with two
different methods (TD-DFT and equation-of-motion coupled
cluster method restricted to single and double excitations (EOM-CCSD)) to determine the excitation energies of the
TABLE I. Calculated vertical excitation energies (TD-DFT level at the LC-ωPBE/aug-cc-pVTZ+ R) (eV), optical oscillator strengths (fL), assignments, and
dominant configurations of phenol (C6H5OH) compared with experimental data and other work (details in text).
State E (eV) fL E (eV)a E (eV)b HOMO HOMO–1 Mixed character Expt. (eV)c
Cross-sections (Mb) 4π (4a′′) 3π (3a′′) ˜ X1A′ . . . .
21A′ 5.310 0.0336 4.53 4.99 HOMO → LUMO+HOMO–1 → LUMO+1 4.605 18.1
31A′ 6.122 0.0374 5.80 5.76 HOMO–1 → LUMO+HOMO → LUMO+1 6.00(4) 19.1 11A′′ 6.231 0.0001 5.76 5.13 3sσ/σ∗ (OH) 5.75(5) 21A′′ 6.744 0.0038 6.20 5.57 3pσ/σ∗(OH) 6.00(4) 31A′′ 7.031 0.0006 6.41 5.92 3pσ/σ∗ (OH) 41A′ 7.073 0.0576 6.31 7.01 3pπ
51A′ 7.120 0.6075 6.50 6.71 HOMO–1 → LUMO+HOMO → LUMO+1 6.736 192.5
61A′ 7.143 0.4208 6.56 6.66 HOMO–1 → LUMO+1+HOMO → LUMO 6.736 192.5 41A′′ 7.288 0.0010 6.42 5.98 3sσ/σ∗ (OH) 51A′′ 7.362 0.0021 6.75 6.31 3dσ 61A′′ 7.435 0.0142 6.95 6.54 3dσ 6.91(1) 71A′′ 7.617 0.0010 7.10 6.93 3dσ 71A′ 7.698 0.0110 6.92 3dπ 81A′′ 7.722 0.0116 6.88 6.35 HOMO–1 → 3pσ+HOMO → 4sσ 81A′ 7.739 0.0061 6.95 3dπ 91A′′ 7.797 0.0062 HOMO → 4sσ+HOMO–1 → 3pσ 101A′′ 7.934 0.0031 7.07 6.66 HOMO–1 → 3pσ+HOMO → 4pσ 111A′′ 7.952 0.0029 HOMO–1 → 3pσ+HOMO → 4pσ 91A′ 8.020 0.0010 4pπ 121A′′ 8.038 0.0001 4pσ 101A′ 8.042 0.0064 6.85 3pπ 6.736 131A′′ 8.081 0.0051 7.57 σring(CC)→ LUMO 141A′′ 8.178 0.0012 7.84 4pσ 7.39(5) 151A′′ 8.204 0.0014 7.57 3pσ 161A′′ 8.231 0.0012 4dσ 7.690 171A′′ 8.305 0.0009 4dσ 181A′′ 8.407 0.0009 7.62 HOMO–1 → 3dσ+HOMO → 4dσ 191A′′ 8.417 0.0021 HOMO → 3dσ+HOMO–1 → 3dσ 111A′ 8.419 0.0009 3pπ 201A′′ 8.441 0.0011 4dσ aReference16(CASPT2/ANO+R).
bReference26(TD-DFT B3LYP/aug-cc-pVDZ).
cThe last decimal of the energy value is given in brackets for these less-resolved features.
neutral molecules (TablesIandII) and the lowest ionisation energy. Density Functional Theory (DFT) using the LC-ωPBE
long range corrected functional33–35 has been implemented
with the Gaussian 09 code.36 The geometry (Fig. 1)
and harmonic frequencies were obtained using Dunning’s cc-pVTZ basis set.37Then the properties of the excited states (energies and oscillator strengths in the length gauge) were obtained using TD-DFT for both triplet and singlet states. The basis set was augmented to aug-cc-pVTZ for all atoms and a set of diffuse (5s5p2d) orbitals, taken from Kaufmann et al.38
was added to the centre of the benzenic ring (aug-cc-pVTZ+R
basis set). The nature of the transitions was assessed by visual inspection of the natural transition orbitals (NTOs),39
computed for each calculated triplet and singlet transition. Phenol geometry was also obtained at the CCSD(T)
level with the Molpro 2012.1 code40with the cc-pVTZ basis
set (Fig. 1). The lowest lying singlet transitions were then
calculated at the EOM-CCSD (equation-of-motion coupled cluster method restricted to single and double excitations)
level, using the aug-cc-pVTZ+R basis set. The nature
of each transition was assessed by visual inspection of the corresponding EOM-CCSD natural orbitals for each transition. Finally, the lowest vertical ionization energy was also obtained at the RCCSD(T) level.39
IV. EXPERIMENTAL DETAILS
A. Phenol sample
The liquid sample used in the VUV measurements was purchased from Sigma-Aldrich, with a stated purity
of ≥99.5%. The sample was degassed by repeated
freeze–pump–thaw cycles.
B. VUV photoasorption
The high-resolution VUV absorption spectrum of phenol
(Fig. 2) was measured at the ASTRID2 storage ring at
TABLE II. Calculated vertical excitation energies (EOM-CCSD level at the aug-cc-pVTZ+R basis set) (eV), optical oscillator strengths (fL), assignments, and
dominant configurations (C6H5OH) compared with experimental data and other work (details in text).
State E (eV) fL ⟨r2⟩a E (eV)b E (eV)c HOMO HOMO–1 HOMO–2 Mixed character Expt. (eV)d
Cross-sections (Mb)
4π (4a′′) 3π (3a′′) 2π (2a′′)
˜ X1A′ . . . 88 21A′ 4.947 0.0210 91 4.53 4.99 LUMO (5a′′, 1π∗) 4.605 18.1 11A′′ 5.699 0.0002 108 5.76 5.13 3sσ/σ∗(OH) 5.75(5) 31A′ 6.162 0.0337 99 5.80 5.76 LUMO+1 (6a′′, 2π∗) 6.00(4) 19.1 21A′′ 6.184 0.0043 168 6.20 5.57 3pσ/σ∗(OH) 6.00(4) 31A′′ 6.491 0.0004 160 6.41 5.92 3pσ 41A′′ 6.634 0.0011 138 6.42 5.98 3sσ/σ∗(OH) 5.89(3)/6.401 41A′ 6.642 0.0183 161 6.31 7.01 3pπ 51A′′ 6.876 0.0053 181 6.75 6.31 3dσ 61A′′ 6.906 0.0089 178 6.95 6.54 3dσ 6.91(1) 51A′ 7.011 0.3889 113 6.50 6.66 HOMO → LUMO +HOMO–1 → LUMO+1 6.736 192.5 71A′′ 7.079 0.0117 153 6.88 6.35 3pσ 61A′ 7.101 0.5172 123 6.56 6.71 HOMO–1 → LUMO +HOMO → 3dπ 6.736 192.5 81A′′ 7.113 0.0001 194 7.10 6.93 3dσ 91A′′ 7.276 0.0130 164 7.07 6.66 3pσ 71A′ 7.280 0.0840 202 6.92 3dπ 101A′′ 7.325 <0.0001 298 4sσ 7.12(8) 81A′ 7.337 0.1376 192 6.95 3dπ 111A′′ 7.494 0.0012 425 4pσ 7.39(5) 91A′ 7.555 0.0603 178 6.85 3pπ 6.736 121A′′ 7.581 0.0002 436 4pσ 101A′ 7.592 0.0069 434 4pπ 131A′′ 7.654 0.0007 163 7.57 7.08 3dσ 141A′′ 7.732 0.0002 272 7.62 HOMO–1 → 3dσ +HOMO → 4dσ 151A′′ 7.758 0.0004 261 7.84 HOMO → 4dσ +HOMO–1 → 3dσ 161A′′ 7.798 0.0016 426 4dσ 7.690 171A′′ 7.836 0.0016 312 4dσe 7.690 181A′′ 7.879 0.0002 675 5sσ 7.802 191A′′ 7.903 0.0002 362 4dσ 201A′′ 7.972 0.0001 243 3dσ 211A′′ 7.989 0.0022 818 5pσ 7.885 111A′ 7.992 0.0027 974 4dπ 221A′′ 8.007 0.0009 1013 5pσ 231A′′ 8.023 0.0018 443 5dσ 121A′ 8.043 0.0040 210 3dπ 131A′ 8.069 0.0093 369 3dπ 7.562 141A′ 8.120 0.0024 304 5dπ 241A′′ 8.124 0.0059 865 5dσ 8.040 151A′ 8.146 0.0046 206 5dπ 251A′′ 8.165 0.0046 1046 5dσ 261A′′ 8.170 0.0002 355 4sσ 7.803 271A′′ 8.228 0.0052 104 7.57 σ ring→ LUMO 281A′′ 8.246 0.0010 208 5dσ 291A′′ 8.281 0.0005 1005 5pσ 161A′ 8.344 0.0007 978 5pπ 301A′′ 8.347 0.0018 433 4pσ 171A′ 8.420 0.0007 442 4pπ 8.072
TABLE II. (Continued.)
State E (eV) fL ⟨r2⟩a E (eV)b E (eV)c HOMO HOMO–1 HOMO–2 Mixed character Expt. (eV)d
Cross-sections (Mb) 181A′ 8.712 0.0745 167 LUMO (5a′′, 1π) 191A′ 8.829 0.0036 872 4dπ 8.400 201A′ 8.858 0.0003 372 4dπ Ion 8.598 RCCSD(T)
aMean value of r2(electronic radial spatial extents). bReference16(CASPT2/ANO+R).
cReference26(TD-DFT B3LYP/aug-cc-pVDZ).
dThe last decimal of the energy value is given in brackets for these less-resolved features. eThis MO has a f-shape character as in the σ∗
(CC) MO of cyclopropane, see discussion in Refs.52and53.
The apparatus used for measurement of photoabsorption spectra has undergone several alterations since that originally described in the work of Eden et al.41with those modifications
being described recently in Ref. 42. Briefly, the gas cell,
FIG. 1. Calculated structure of phenol, C6H5OH, optimized at (a)
LC-ωPBE/cc-pVTZ geometry and (b) CCSD(T)/cc-pVTZ geometry. Distances in Å.
which allows moderate (up to 80◦C) heating of a sample
during measurement, has a path length of 15.5 cm and is fitted with a heated 1 Torr Baratron capacitance manometer (Setra model 774). To ensure that the data are free of any saturation effects, the absorption cross sections were measured at an appropriate pressure in the range 0.02–0.43 mbar, with typical attenuations of less than 40%. The light exits the cell through
a MgF2 window, which sets the lower limit of detectable
light to 115 nm. A small gap between the photo-multiplier tube (PMT) detector and the absorption cell is evacuated using a scroll pump for measurements below 200 nm. Above 220 nm, air is allowed into this gap to let oxygen absorb higher orders of light (at half the chosen wavelength) which may be passing through the cell. In this way, photoabsorption measurements can be performed with spectrally pure radiation from 115 nm to 340 nm, ensuring artefact-free spectra. Absolute photoabsorption cross sections (σ) are obtained using the Beer-Lambert law It = I0exp (−nσ x), where It is
the radiation intensity transmitted through the gas sample, I0
is that through the evacuated cell, n is the molecular number density of the sample gas, σ is the absolute photoabsorption cross section, and x is the absorption path length (15.5 cm). ASTRID2 is operated in a so-called top-up mode, keeping the stored electron beam current (and thus the intensity for a given wavelength) quasi-constant by adding small amounts of current to ASTRID2 to make up for the constant beam decay.
FIG. 2. High resolution VUV photoabsorption spectrum of phenol, C6H5OH,
The beam current thus varies about 3% during a scan, and this is taken into account by recording and normalizing to an accurately determined beam current.
The accuracy of the cross section is estimated to be better than ±5%. Only when absorption by the sample is very weak (I0≈ It), does the error increase as a percentage of the
measured cross section.
V. ELECTRONIC STATE SPECTROSCOPY: RESULTS AND DISCUSSION
The absolute high resolution VUV photoabsorption spectrum of phenol measured at room temperature is shown
in Fig. 2, extending from 3.9 to 10.8 eV and Figs. 3–7
show expanded views in five subsection energy regions. The major absorption bands can be classified as a mixture of Rydberg series and molecular valence transitions of (π∗← π) character. TableIcompares the experimental results with the TD-DFT calculations and demonstrates reasonably good agreement. The calculations indicate that the electronic transitions for phenol have mixed valence-Rydberg character. The RCCSD(T) lowest vertical ionisation energy is 8.60 eV (Table II) and agrees well with Lorentzon et al.16 (8.21 and
8.56 eV) and Kishimoto et al.20 (8.64 eV). The measured
lowest vertical IE of phenol (8.64 eV)20 agrees well with
the theoretical prediction.16 There exists several different
numbering schemes of the vibrational modes of phenol in the literature, and we have followed the notation adopted
in the studies of Anderson et al.19 and Nix et al.22 in
Secs.V A–V B.
A. Valence spectroscopy of phenol
According to the calculation results in TablesIandII, the absorption bands centred at 4.605, 6.00(4), and 6.736 eV have
been assigned to (π∗← π) transitions. The calculated wave
functions show a mixing between excitations from the HOMO
(4π) and HOMO–1 (3π) to the LUMO (π∗) and LUMO+1
(π∗) MO’s, and also a 3sσ (a′′) Rydberg character for the
latter. An identical behaviour has been observed for toluene.27
FIG. 3. High resolution VUV photoabsorption spectrum of phenol, C6H5OH,
in the 4.3–5.1 eV photon energy range. For the vibrational excitation assign-ments, see TableIIIand text for details.
FIG. 4. High resolution VUV photoabsorption spectrum of phenol, C6H5OH,
in the 5.3–6.3 eV photon energy range. For the vibrational excitation and Rydberg state assignments, see TablesIVandVIand text for details.
The calculated transition energies at the EOM-CCSD level
(TableII) are generally overestimated by about 0.3 eV when
compared to experiment, whereas for TD-DFT level of theory (TableI) such a difference increases on average to 0.5 eV. Thus, in this case the EOM-CCSD results are more reliable than the TD-DFT ones, especially for Rydberg transitions.
Nev-ertheless, the present TD-DFT/LC-ωPBE/aug-cc-pVTZ+R
calculations appear to be closer to other theoretical results
than the TD-DFT/B3LYP/aug-cc-pVDZ of Ref. 26. The
assignments in the lowest absorption band are in a reasonable agreement with the work of Nix et al.,22reporting the band at 4.507 eV (275.113 nm), while electron energy loss data of Ari et al.18place the first three bands at 4.59, 5.93, and 6.68 eV, respectively, and that of Kimura and Nagakura15at 4.59, 5.82, and 6.70 eV.
The first band is reported here with a maximum absolute cross section of 18.1 Mb (at 4.605 eV), whereas the second has a maximum of 19.1 Mb (at 6.00(4) eV) and the third
at 192.5 Mb (at 6.736 eV) (see Tables I and II). The
feature at 6.401 eV, with a rather weak calculated oscillator strength, fL≈ 0.001, is here tentatively assigned for the first
time to σ∗
(OH) ← 3π(3a′′
) with the aid of the theoretical
FIG. 5. High resolution VUV photoabsorption spectrum of phenol, C6H5OH,
in the 6.2–7.6 eV photon energy range. For the vibrational excitation and Rydberg state assignments, see TablesVandVIand text for details.
FIG. 6. High resolution VUV photoabsorption spectrum of phenol, C6H5OH,
in the 7.3–8.7 eV photon energy range. For the vibrational excitation and Rydberg state assignments, see TablesVandVIand text for details.
calculations (Table II). However, a careful look at Table II
reveals that for this energy transition, other contributions from
3pσ/σ∗
(OH) ← 4π and 3sσ/σ∗
(OH) ← 3π may be present.
The feature at 6.736 eV has been identified as an n= 3p
member of a Rydberg series converging to the ionic electronic first excited state of phenol (see SectionV B); the rather high calculated intensity (fL≈ 0.060 in Table II) is primarily due
to the pure valence π* character of the MO. Pure Rydberg transitions (Table VI) with considerable values of oscillator strengths in this energy range are discussed in Sec.V B.
1. Valence and vibronic excitation in the range 4.4–5.5 eV
The lowest-lying excited state of phenol (2π∗← 3π
+ 1π∗← 4π), with a maximum at 4.605 eV, with a local cross
section value of 18.1 Mb (Fig. 3), has been assigned to the
S1–S0(π∗← π) transition and shows extensive fine structure,
which is much better resolved than in previous absolute cross
section measurements22 and therefore new assignments are
proposed. The vertical energy is in good agreement with
the calculated value of 4.99 eV of Jones et al.26 as well as
from the present calculations in Tables I andII, where the
FIG. 7. High resolution VUV photoabsorption spectrum of phenol, C6H5OH,
in the 8.6–10.8 eV photon energy range with Rydberg and vibrational excita-tion assignments. See TablesVandVIand text for details.
TABLE III. Proposed vibrational assignments in the 4.3–5.1 eV absorption band of phenol, C6H5OH.a
Energy (eV) Assignment Energy (eV) Assignment This workb Nix et al.22
4.355 7a0 1 . . . . 4.380 180 1 . . . . 4.383 6a0 2 . . . . 4.406 120 1 . . . . 4.416 18b0 2 . . . . 4.440 6b0 1 . . . . 4.443 6a0 1 4.442 6a 0 1 4.458 18b0 1 . . . . 4.501 16b1 1 c . . . . . . 4.508 00 0 4.507 000 . . . 4.512 40 15 1 0 4.513 ? 4.513 41 0τOH 0 1 4.548 τOH1 1 4.548 τOH11 . . . 4.554 16a2 0 4.555 18b1 0 4.556 18b 1 0 4.567 6a1 0 4.567 6a01 4.577 6b1 0 . . . . 4.60(1) (s) 18b2 0 . . . . 4.605 121 0 . . . . 4.624 6a2 0 . . . . 4.626 18a1 0 4.626 18a 1 0 4.636 9a1 0 4.629 9a01 4.649 6b2 0 . . . . 4.65(4) (w) 18b30 . . . . 4.666 7a1 0 . . . . 4.683 6a03/6a101220 . . . . 4.702 122 0 . . . . 4.713 6b30 . . . . 4.721 6a1 07a 1 0 . . . . 4.741 6a201220 4.763 9a2 0 . . . . 4.781 1107a10/6a207a10 4.781 1107a10 4.798 123 0/6a 3 012 2 0 . . . . 4.818 1101220 4.817 1101220 4.822 7a2 0 . . . . 4.838 6a307a10 . . . . 4.877 6a1 07a 2 0 . . . . 4.896 1240 . . . .
a(s)—shoulder feature, (w)—weak feature, (b)—broad structure (the last decimal of the
energy value is given in brackets for these less-resolved features). ? feature remains unassigned.
bVibrational modes notation adopted from Refs.19and22. cFrom Ref.44.
EOM-CCSD level of accuracy (4.947 eV, Table II) gives a
better agreement with the experimental data. The adiabatic transition is observed at 4.508 eV (34.6 Mb) in very good agreement with the value of Nix et al.22at 4.507 eV (275.113
nm). Vieuxmaire et al.43report an adiabatic excitation energy
at 4.612 eV at CAS(10,9)/6-31G** level of theory against the
experimental value of 4.507 eV according to Bist et al.44and Berden et al.,45the latter being a comprehensive study on the structure and dynamics of internal rotation of phenol. We also note that rotationally resolved fluorescence excitation spectra
of phenol by Martinez et al.46 place the (0-0) transition at
4.507 eV. This absorption band shows resolvable rovibronic
they are revisited and compared with the detailed data of Nix et al.,22with several new features reported here for the first time.
The present high-resolution spectrum reveals that the fine structure is due to several modes (see TableIIIfor the proposed detailed assignments), with the main contributions from the oxygen stretching motion mode, ν′6a(a′), and the O–H torsion
mode, ν′
6b(a′). These modes also appear coupled with other
modes. Due to the complexity of such fine structure in the
absorption band in Fig.3, and in order to avoid congestion,
we have represented a few modes only. It is noteworthy that the normal vibrational description may lead to some Fermi
resonances, making assignments particularly difficult. The
features below the 00
0 transition are tentatively assigned to
hot-bands based on the previous work of Nix et al.22 The
feature at 4.548 eV is tentatively assigned as a sequence band of the OH torsion mode, further to assignments of Nix et al.22
2. Valence and vibronic excitation in the range 5.3–7.0 eV
The lowest valence excitation band in this energy range
(Fig. 4) has been assigned to the (1π∗← 3π+ 2π∗← 4π)
transition in agreement with previous reports.16,26 The 00 0
transition is here proposed at 5.75(5) eV (see TableIV). The
1142 cm−1(0.142 eV) spacing reported by Anderson et al.19
for phenol excited states is in very good agreement with the
mean value of 0.106 eV (Fig.4and TableIV), which has been
assigned to the excitation of ring CH in-plane deformation and CC stretching mode, ν′9a(a′) with 1167 cm−1(0.145 eV) in the
neutral ground state.19,22,23,47The next band with the highest
oscillator strength (fL≈ 0.61 at TD-DFT level and ≈0.39 at
EOM-CCSD), peaking at 6.736 eV, has been assigned to
(1π∗← 3π+ 2π∗← 4π) in Table I, whereas in the case of
toluene it was reported at 6.786 eV and assigned to a mixed
Rydberg/valence (1π∗← 3π+ 3pπ (a′′
) ← 2π).32We note that
the calculated vertical excitation energies are obtained more accurately from the calculations at the EOM-CCSD level of
theory rather than the TD-DFT (LC-wPBE/aug-cc-pVTZ+R)
level when compared to the experimental values (Table II).
According to the calculations, the 3pπ(a′
) ← 3π(3a′′
) Rydberg transition has a considerable oscillator strength (0.06) at the EOM-CCSD level and contributes to the feature observed in this energy range. A few quanta of the oxygen stretching motion mode, ν′6a (a′), are excited (see Table V) and the
000 transition is proposed at 6.461 eV, although we note
TABLE IV. Proposed vibrational assignments in the 5.3–6.3 eV absorption band of phenol, C6H5OH.a
Energy (eV) Assignment ∆E (eV) 5.75(5) (b) 00 0 . . . 5.85(9) (b) 91 0 0.104 5.89(3) (b) . . . . 6.00(4) (b) 91 0 0.111 6.10(2) (b,w) 92 0 0.098
a(b)—broad structure; (w)—weak feature (the last decimal of the energy value is given
in brackets for these less-resolved features).
a weak feature at 6.401 eV. Since the latter lies on an underlying state with a different slope from the rising left-hand side of the most intense absorption feature, we tentatively assign it to the σ∗(OH) ← 3π(3a′′
) transition according to
the calculations in Table II, although we do not discard
the possibility of another transition, from 3pσ/σ∗(OH) ← 4π
and 3sσ/σ∗(OH) ← 3π, contributing to the spectrum. This
energy region exhibits evidence for transitions to Rydberg
states at 6.736, 6.91(1), and 7.12(8) eV (see Section V B
and Table VI), converging to the ionic electronic first
excited and ionic ground states, respectively, and also shows some quanta excitation number of oxygen stretching motion
mode, ν′
6a (a
′), (Table V) with a mean excitation energy of
0.056 eV. However, Anderson et al.19 pointed out that in
the neutral excited states of phenol, the strong absorption band is dominated by two fundamental modes assigned to oxygen stretching modes ν6a′ (a′) and ν′12(a′), with excitation
energies of 526 and 935 cm−1. Nonetheless, the normal mode
vibrational description may lead to Fermi resonances, making assignments particularly difficult. Finally we note in Fig.4a rather broad background contribution that can be attributed to a pre-dissociative state. A careful look at TablesI andII
shows a rather low oscillator strength (fL= 0.0002 in TableII)
transition, assigned to σ∗
(OH) ← 4π at ∼5.75 eV (Fig.3) and
in good agreement with the S2 (1πσ∗) state of Livingstone
et al.21calculated at 5.55 eV at the EOM-CCSD level.
B. Rydberg transitions
The VUV photoabsorption spectrum above 6.0 eV
consists of a few structures superimposed on a diffuse
absorption feature extending to the lowest IEs, which are reported here for the first time. The experimental ionisation energy values of Kishimoto et al.20are used to determine the
Rydberg series. The proposed Rydberg structures are labelled in Figs.4–7and listed in TableVI. The peak positions have been tested using the Rydberg formula: En= Ei− R/(n − δ)2,
where Eiis the ionisation energy, n is the principal quantum
number of the Rydberg orbital of energy En, R is the Rydberg
constant (13.61 eV), and δ is the quantum defect resulting from the penetration of the Rydberg orbital into the core. The experimental values for the lowest terms of the ns, np, and nd
(n= 3) Rydberg series (TableVI) are in good agreement with
the calculations in TableII.
The lowest transition energy is assigned to 3sσ/σ∗
(OH) ← 4π at 5.75(5) eV for the Rydberg series converging to the ionic electronic ground state, with a quantum defect δ = 0.83 (TableVI), accompanied by vibronic structure, which is proposed to be mainly due to excitation of ring CH in-plane
deformation and CC stretching mode, ν′
9(a′), with an average
value of 0.104 eV (Fig.4and TableIV) (and even of oxygen
stretching motion mode, ν′6a (a′)), in very good agreement
with 0.150 eV for the ˜X2A′′state from the work of Anderson
et al.20However, these authors note that this mode is a weakly active mode in the C6H5OH+ion. The higher members of this
Rydberg series are proposed to extend to n= 7. Because of
the complexity of such fine structure in the absorption band in Fig.6, and in order to avoid congestion, we have presented only a few modes.
TABLE V. Proposed vibrational assignments in the 6.2–10.8 eV absorption region of phenol, C5H5OH.a
Energy (eV) Assignment ∆E (eV) Energy (eV) Assignment ∆E (eV)
6.461 000 . . . 7.690 4d . . . 6.52(2) (s) 6a1 0 0.061 7.741 4d+6a 1 0 0.051 . . . 7.799 4d+6a20 0.058 6.634 6a3 0 . . . 6.68(4) (b) 6a40 0.050 7.803 5s/4s . . . 6.735 6a5 0 0.051 7.858 5s/4s+6a 1 0 0.055 6.790 6a60 0.055 6.84(8) (s) 6a7 0 0.058 7.885 5p . . . 7.951 5p+6a10 0.066 6.91(1) (s) 3d . . . 8.001 5p+6a2 0 0.050 6.96(2) (s,w) 3d+6a10 0.051 8.05(6) (w) 5p+6a30 0.055 7.01(7) (s,w) 3d+6a2 0 0.055 7.915 (w) . . . . 7.39(5) (s) 4p . . . 7.962 6a1 0 0.047 7.44(4) (s) 4p+6a10 0.049 8.007 6a20 0.045 7.496 4p+6a2 0 0.052 7.562 4p+6a03/3d 0.066 8.093 6s . . . 7.622 3d+6a1 0 0.060 8.15(2) (s) 6p/6s+6a 1 0 0.059 7.675 3d+6a20 0.053 8.197 6p/6s+6a20 0.045 7.735 3d+6a3 0 0.060 8.429 9s . . . 7.60(6) (s) . . . 8.50(1) (b) 9s+6a1 0 0.072 7.66(0) (w) 6a10 0.054 8.565 9s+6a20/5p 0.064 7.711 6a2 0 0.051 7.76(9) (s) 6a30 0.058 8.472 5s . . . 7.823 (w) 6a4 0 0.054 8.52(1) (s) 5s+6a 1 0 0.049 7.880 6a50 0.057 8.84(3) (b) 6p . . . 9.00(4) (b) 6p+8a10/7p/3p 0.161 9.17(0) (b) 6p+8a2 0/7p +8a 1 0/3p+8a 1 0 0.166 a(s)—shoulder structure, (b)—broad structure, (w)—weak structure (the last decimal of the energy value is given in brackets for
these less-resolved features).
The first members of the np and nd series are associated with peaks at 6.00(4) eV (δ= 0.73) and 6.91(1) eV (δ = 0.19),
respectively (Table VI). The nd series shows an n= 3
vibrational excitation with two quanta of ring distortion mode,
ν′6a (a′), with an average value of 0.053 eV (Fig. 6 and
Table V), in very good agreement with 0.059 eV for the
˜
X2A′′ state from the work of Anderson et al.20 The higher
members of these Rydberg series, for which the relative intensity decreases, are difficult to assign due to their overlap with other transitions and possible vibronic structure (see TableV). Close to the lowest ionic limit, features tentatively
assigned to the ring distortion mode, ν′
6a(a′), appear quite
abundantly.
The first members of the ns, np, and nd series converging to the ionic electronic first excited state of phenol (3a′′−1) are
associated with the peaks at 5.89(3) eV (δ= 1.01), 6.736 eV
(δ= 0.70), and 7.562 eV (δ = 0.22), respectively (TableVI). The rather high quantum defect for the 3s Rydberg member is due to the contribution of the valence σ∗(OH) state (TableII).
The Rydberg transitions (Fig.6) are accompanied by vibronic
structure, which is tentatively attributed to excitation of the ν′6a
(a′) mode (TableV); however, the normal mode configuration may also lead to Fermi resonances.
As far as members of the Rydberg series converging to the ionic electronic second excited state are concerned, n= 3 for
ns, np and nd are proposed at 8.178, 9.00(4), and 9.70(9) eV,
respectively (Table VI), with quantum defects 1.00, 0.70,
and 0.30, respectively. Some of the fine structure has been assigned to vibrational excitation involving the ring distortion
mode ν′6a (a′), as well as ring and OH bending character,
ν′8a(a′), the latter in good agreement with the photoelectron
spectrum of Anderson et al.,20although we were able to assign new features (see TableVIand Fig.7).
We have not made any attempt to identify higher members (n > 3) of the Rydberg series, due to the broad and structureless nature of the absorption bands. Note that the clear increase in the absorption with energy, in the range above 9.0 eV, may be related to low-lying pre-dissociative or dissociative excited neutral states.
C. Absolute photoabsorption cross-sections and atmospheric photolysis
The present optical measurements were carried out in the pressure range 0.02–0.43 mbar and reveal no evidence for changes in absolute cross sections or peak energies as a function of pressure, thus we believe that the present spectra are free of any saturation effects. Previous absolute VUV pho-toabsorption cross sections of phenol are available in the
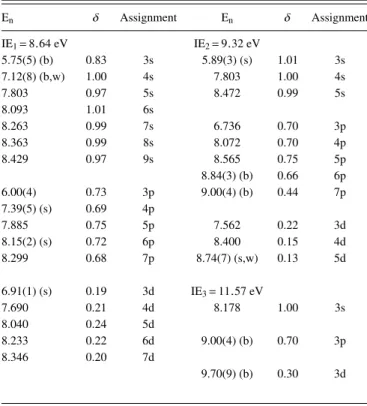
TABLE VI. Energy value (eV), quantum defect (δ), and assignment of the Rydberg series converging to the ionic electronic ground (4a′′−1), first (3a′′−1), and second (2a′′−1) excited states of phenol, C6H5OH.a
En δ Assignment En δ Assignment IE1= 8.64 eV IE2= 9.32 eV 5.75(5) (b) 0.83 3s 5.89(3) (s) 1.01 3s 7.12(8) (b,w) 1.00 4s 7.803 1.00 4s 7.803 0.97 5s 8.472 0.99 5s 8.093 1.01 6s 8.263 0.99 7s 6.736 0.70 3p 8.363 0.99 8s 8.072 0.70 4p 8.429 0.97 9s 8.565 0.75 5p 8.84(3) (b) 0.66 6p 6.00(4) 0.73 3p 9.00(4) (b) 0.44 7p 7.39(5) (s) 0.69 4p 7.885 0.75 5p 7.562 0.22 3d 8.15(2) (s) 0.72 6p 8.400 0.15 4d 8.299 0.68 7p 8.74(7) (s,w) 0.13 5d 6.91(1) (s) 0.19 3d IE3= 11.57 eV 7.690 0.21 4d 8.178 1.00 3s 8.040 0.24 5d 8.233 0.22 6d 9.00(4) (b) 0.70 3p 8.346 0.20 7d 9.70(9) (b) 0.30 3d
a(b)—broad structure, (w)—weak structure, (s)—shoulder structure (the last decimal of
the energy value is given in brackets for these less-resolved features).
(4.35–5.06 eV),13 200–290 nm (4.28–6.20 eV),14 and
160–240 nm (5.17–7.75 eV).15Etzkorn et al.,12Trost et al.,13
Grosch et al.,14and Kimura and Nagakura15reported absolute
cross sections of magnitude 19.8 Mb (275.1 nm, 4.51 eV), ∼37 Mb (275 nm, 4.51 eV), ∼19.1 Mb (275 nm, 4.51 eV), and 36.1 Mb (6.82 eV), compared to the present value of
34.6 Mb at 4.508 eV. Such differences, as in the case
of Etzkorn et al.,12 are mainly attributable to experimental
resolution, where a value of 0.15 nm is reported, against the present value of 0.075 nm. We have noted over the last decade an excellent agreement of previous cross sections measured on the UV1 beam line on ASTRID with the most precise data available in the literature (see the work of Eden et al.48and references therein and more recently Ref.49). This indicates that the present absolute phenol cross sections are reliable over the energy range studied (4.3-10.8 eV).
The present absolute cross sections below 6.89 eV (above
180 nm) can be used in combination with solar actinic flux50
measurements from the literature to estimate the photolysis rate of phenol in the atmosphere from an altitude close to the ground to the stratopause at 50 km. Details of the
calculation programme are presented in Ref. 51, in which
the quantum yield for dissociation following absorption is assumed to be unity. The reciprocal of the photolysis rate at a given altitude corresponds to the local photolysis lifetime. Photolysis lifetimes of around 24 sunlit hours were calculated at ground level, with less than an hour above 30 km. This shows that phenol molecules can be broken up quite efficiently by UV absorption even at low altitudes. From the ground level up to the tropopause, the lifetimes can be low,
such that photolysis may be a sink mechanism. However, the rate coefficients obtained by Trost et al.13 for reactions between the OH radical and phenol have shown that this may provide a main reactive sink mechanism in the troposphere.
Moreover, night time reactivity of NO3radicals with phenol
can be also regarded as an important sink mechanism.10
Therefore, compared with radical reactions, UV photolysis is not expected to play a significant role in the tropospheric removal of phenol molecules.
VI. CONCLUSIONS
The present work provides the first comprehensive study to date of the VUV electronic spectroscopy of phenol and provides the most reliable set of absolute photoabsorption cross sections between 4.3 and 10.8 eV. The observed valence and Rydberg transitions have been assigned with the help of ab initiocalculations on the vertical excitation energies and oscillator strengths at two different levels of accuracy. The theoretical results are in good agreement with the experiments,
predicting significant mixing of Rydberg and π∗states, and
allowed for novel assignments in the photon energy covered in this work which have not been previously reported in the literature. The state at 6.401 eV is tentatively assigned for the first time to the σ∗(OH) ← 3π(3a′′
) transition. The analysis of the observed vibronic structure in the photoabsorption spectra is generally consistent with earlier data, although the higher resolution of the present experiments has enabled us to propose for the first time assignments for the valence and Rydberg excitations. The photolysis lifetimes of phenol have also been carefully derived for the earth’s troposphere and stratosphere and show that solar photolysis is expected to be a weak sink in the terrestrial atmosphere.
ACKNOWLEDGMENTS
P.L.V. and F.F.S. acknowledge the Portuguese Na-tional Funding Agency FCT-MCTES through Grant Nos.
UID/FIS/00068/2013 and IF-FCT IF/00380/2014. E.L.
acknowledges the Brazilian Agency Conselho Nacional de Desenvolvimento Científico e Tecnológico (CNPq) and the Science Without Borders Programme for opportunities to study abroad. D.D. acknowledges support from the CaPPA project (Chemical and Physical Properties of the Atmosphere), funded by the French National Research Agency (ANR) through the PIA (Programme d’Investissement d’Avenir) under Contract No. ANR-10-LABX-005 and by the Regional Council “Nord-Pas de Calais” and the “European Funds for Regional Economic Development” (FEDER). M.A. ´S. would like to acknowledge the Visiting Research Fellow position at The Open University. This work was performed using HPC resources from GENCI-CINES (Grant No. 2015-088620). The Centre de Ressources Informatiques (CRI) of the Université of Lille also provided computing time. The authors wish to acknowledge the beam time at the ISA synchrotron at Aarhus University, Denmark. We also acknowledge the financial support provided by the European Community’s Seventh
under Grant Agreement No. 312284. M.J.B. acknowledges financial support provided through the Australian Research Council (ARC).
1A. J. Ragauskas, C. K. Williams, B. H. Davison, G. Britovsek, J. Cairney,
C. A. Eckert, W. J. Frederick, J. P. Hallett, D. J. Leak, C. L. Liotta, J. R. Mielenz, R. Murphy, R. Templer, and T. Tschaplinski,Science311, 484 (2006).
2M. E. Himmel, S. Y. Ding, D. K. Johnson, W. S. Adney, M. R. Nimlos, J. W.
Brady, and T. D. Foust,Science315, 804 (2007).
3G. M. Roberts, A. D. Chatterley, J. D. Young, and V. G. Stavros,J. Phys.
Chem. Lett.3, 348 (2012).
4A. I. Sobolewski, W. Domcke, C. Dedonder-Lardeux, and C. Jouvet,Phys.
Chem. Chem. Phys.4, 1093 (2002).
5M. N. R. Ashfold, G. A. King, D. Murdock, M. G. D. Nix, T. A. A. Oliver,
and A. G. Sage,Phys. Chem. Chem. Phys.12, 1218 (2010).
6M. N. R. Ashfold, B. Cronin, A. L. Devine, R. N. Dixon, and M. G. D. Nix,
Science312, 1637 (2006).
7M. N. R. Ashfold, A. L. Devine, R. N. Dixon, G. A. King, M. G. D. Nix, and
T. A. A. Oliver,Proc. Natl. Acad. Sci. U. S. A.105, 12701 (2008).
8O. P. J. Vieuxmaire, Z. Lan, A. L. Sobolewski, and W. Domcke,J. Phys.
Chem.129, 224307 (2008).
9S. G. Ramesh and W. Domcke,Faraday Discuss.163, 73 (2013). 10R. Atkinson, W. P. L. Carter, C. N. Plum, A. M. Winer, and J. N. Pitts, Jr.,
Int. J. Chem. Kinet.16, 887 (1984).
11R. G. Derwent, M. E. Jenkin, and S. M. Saunders,Atmos. Environ.30, 181
(1996).
12T. Etzkorn, B. Klotz, S. Sørensen, I. V. Patroescu, I. Barnes, K. H. Becker,
and U. Platt,Atmos. Environ.33, 525 (1999).
13B. Trost, J. Stutz, and U. Platt,Atmos. Environ.31, 3999 (1997). 14H. Grosch, Z. Sárossy, H. Egsgaard, and A. Fateev,J. Quant. Spectrosc.
Radiat. Trans.156, 17 (2015).
15K. Kimura and S. Nagakura,Mol. Phys.9, 117 (1965).
16J. Lorentzon, P.-Å. Malmqvist, M. Fulscher, and B. O. Roos,Teor. Chim. Acta91, 91 (1995).
17M. Miura, Y. Aoki, and B. Champagne,J. Chem. Phys.127, 084103 (2007). 18T. Ari, H. Güven, and N. Ecevit,J. Electron Spectrosc. Relat. Phenom.73,
13 (1995).
19S. L. Anderson, L. Goodman, K. K. Jespersen, A. G. Ozkabak, R. N. Zare,
and C.-F. Zheng,J. Chem. Phys.82, 5329 (1985).
20N. Kishimoto, M. Furuhashi, and K. Ohno, J. Electron Spectrosc.
Relat. Phenom.113, 35 (2000).
21R. A. Livingstone, J. O. F. Thompson, M. Iljina, R. J. Donaldson, B. J.
Sussman, M. J. Paterson, and D. Townsend,J. Chem. Phys.137, 184304 (2012), and references therein.
22M. G. D. Nix, A. L. Devine, B. Cronin, R. N. Dixon, and M. N. R. Ashfold,
J. Chem. Phys.125, 133318 (2006).
23H. Lampert, W. Mikenda, and A. Karpfen,J. Phys. Chem. A101, 2254
(1997).
24G. Y. Gor, S. Tapio, A. V. Domanskaya, M. Räsänen, A. V. Nemukhin, and
L. Khriachtchev,Chem. Phys. Lett.517, 9 (2011).
25S. J. Martinez III, J. C. Alfano, and D. H. Levy,J. Mol. Spectrosc.152, 80
(1992).
26D. B. Jones, G. B. da Silva, R. F. C. Neves, H. V. Duque, L. Chiari, E. M.
de Oliveira, M. C. A. Lopes, R. F. da Costa, M. T. do N. Varella, M. H. F. Bettega, M. A. P. Lima, and M. J. Brunger,J. Chem. Phys.141, 074314 (2014).
27R. F. C. Neves, D. B. Jones, M. C. A. Lopes, K. L. Nixon, G. B. da Silva, H.
V. Duque, E. M. de Oliveira, R. F. da Costa, M. T. do. N. Varella, M. H. F. Bettega, M. A. P. Lima, K. Ratnavelu, G. García, and M. J. Brunger,J. Chem.
Phys.142, 104305 (2015).
28R. F. C. Neves, D. B. Jones, M. C. A. Lopes, K. L. Nixon, E. M. de Oliveira,
R. F. da Costa, M. T. do. N. Varella, M. H. F. Bettega, M. A. P. Lima, G. B. da Silva, and M. J. Brunger,J. Chem. Phys.142, 194302 (2015).
29R. F. C. Neves, D. B. Jones, M. C. A. Lopes, F. Blanco, G. García, K.
Ratnavelu, and M. J. Brunger,J. Chem. Phys.142, 194305 (2015).
30R. F. da Costa, E. M. de Oliveira, M. H. F. Bettega, M. T. do N. Varella, D. B.
Jones, M. J. Brunger, F. Blanco, R. Colmenares, P. Limão-Vieira, G. García, and M. A. P. Lima,J. Chem. Phys.142, 104304 (2015).
31G. B. da Silva, R. F. C. Neves, L. Chiari, D. B. Jones, E. Ali, D. H. Madison,
C. G. Ning, K. L. Nixon, M. C. A. Lopes, and M. J. Brunger,J. Chem. Phys.
141, 124307 (2014).
32C. Serralheiro, D. Duflot, F. Ferreira da Silva, S. V. Hoffmann, N. C. Jones,
N. J. Mason, B. Mendes, and P. Limaõ-Vieira,J. Phys. Chem. A119, 9059 (2015).
33O. A. Vydrov and G. E. Scuseria,J. Chem. Phys.125, 234109 (2006). 34O. A. Vydrov, J. Heyd, A. V. Krukau, and G. E. Scuseria,J. Chem. Phys.
125, 074106 (2006).
35O. A. Vydrov, G. E. Scuseria, and J. P. Perdew,J. Chem. Phys.126, 154109
(2007).
36M. J. Frisch, G. W. Trucks, H. B. Schlegel, G. E. Scuseria, M. A. Robb,
J. R. Cheeseman, G. Scalmani, V. Barone, B. Mennucci, G. A. Petersson, H. Nakatsuji, M. Caricato, X. Li, H. P. Hratchian, A. F. Izmaylov, J. Bloino, G. Zheng, J. L. Sonnenberg, M. Hada, M. Ehara, K. Toyota, R. Fukuda, J. Hasegawa, M. Ishida, T. Nakajima, Y. Honda, O. Kitao, H. Nakai, T. Vreven, J. A. Montgomery, Jr., J. E. Peralta, F. Ogliaro, M. J. Bearpark, J. Heyd, E. N. Brothers, K. N. Kudin, V. N. Staroverov, R. Kobayashi, J. Normand, K. Raghavachari, A. P. Rendell, J. C. Burant, S. S. Iyengar, J. Tomasi, M. Cossi, N. Rega, N. J. Millam, M. Klene, J. E. Knox, J. B. Cross, V. Bakken, C. Adamo, J. Jaramillo, R. Gomperts, R. E. Stratmann, O. Yazyev, A. J. Austin, R. Cammi, C. Pomelli, J. W. Ochterski, R. L. Martin, K. Morokuma, V. G. Zakrzewski, G. A. Voth, P. Salvador, J. J. Dannenberg, S. Dapprich, A. D. Daniels, Ö. Farkas, J. B. Foresman, J. V. Ortiz, J. Cioslowski, and D. J. Fox, 09, Gaussian, Inc., Wallingford, CT, USA, 2009.
37T. H. Dunning, Jr.,J. Chem. Phys.90, 1007 (1989).
38K. Kaufmann, W. Baumeister, and M. Jungen,J. Phys. B22, 2223 (1989). 39R. L. Martin,J. Chem. Phys.118, 4775 (2003).
40H.-J. Werner, P. J. Knowles, G. Knizia, F. R. Manby, M. Schütz, P. Celani,
T. Korona, R. Lindh, A. Mitrushenkov, G. Rauhut, K. R. Shamasundar, T. B. Adler, R. D. Amos, A. Bernhardsson, A. Berning, D. L. Cooper, M. J. O. Deegan, A. J. Dobbyn, F. Eckert, E. Goll, C. Hampel, A. Hesselmann, G. Hetzer, T. Hrenar, G. Jansen, C. Köppl, Y. Liu, A. W. Lloyd, R. A. Mata, A. J. May, S. J. McNicholas, W. Meyer, M. E. Mura, A. Nicklaß, D. P O’Neill, P. Palmieri, D. Peng, K. Pflüger, R. Pitzer, M. Reiher, T. Shiozaki, H. Stoll, A. J. Stone, R. Tarroni, T. Thorsteinsson, and M. Wang, , version 2006.1, a package of ab initio programs, 2006, seehttp://www.molpro.net.
41S. Eden, P. Limão-Vieira, S. V. Hoffmann, and N. J. Mason,Chem. Phys.
323, 313 (2006).
42M. H. Palmer, T. Ridley, S. V. Hoffmann, N. C. Jones, M. Coreno, M. de
Simone, C. Grazioli, M. Biczysko, A. Baiardi, and P. Limão-Vieira,J. Chem.
Phys.142, 134302 (2015).
43O. P. J. Vieuxmaire, Z. Lan, A. L. Sobolewski, and W. Domcke,J. Chem.
Phys.129, 224307 (2008).
44H. D. Bist, J. C. D. Brand, and D. R. Williams,J. Mol. Spectrosc.24, 413
(1967).
45G. Berden, W. L. Meerts, M. Schmitt, and K. Kleinermanns,J. Chem. Phys.
104, 972 (1996).
46S. J. Martinez III, J. C. Alfano, and D. H. Levy,J. Mol. Struct.152, 80 (1992). 47B. M. Giuliano, I. Reva, L. Lapinski, and R. Fausto,J. Chem. Phys.136,
024505 (2012).
48S. Eden, P. Limão-Vieira, S. V. Hoffmann, and N. J. Mason,Chem. Phys.
331, 232 (2007).
49M. A. ´Smiałek, M. Łabuda, J. Guthmuller, M.-J. Hubin-Franskin, J.
Del-wiche, D. Duflot, N. J. Mason, S. V. Hoffmann, N. C. Jones, and P. Limão-Vieira,J. Chem. Phys.141, 104311 (2014).
50W. B. DeMore, S. P. Sander, D. M. Golden, R. F. Hampson, M. J. Kurylo,
C. J. Howard, A. R. Ravishankara, C. E. Kolb, and M. J. Molina, Chem-ical Kinetics and PhotochemChem-ical Data for Use in Stratospheric Modelling, Evaluation No. 12, 15 January 1997.
51P. Limão-Vieira, S. Eden, P. Kendall, N. J. Mason, and S. V. Hoffmann,
Chem. Phys. Lett.364, 535 (2002).
52M. B. Robin,Chem. Phys. Lett.119, 33 (1985).