1
This article was published in Applied Catalysis A: General, 470C, 45-55, 2014 http://dx.doi.org/10.1016/j.apcata.2013.10.034
Effect of the preparation method on the catalytic activity and stability
of Au/Fe
2O
3catalysts in the low-temperature water-gas shift reaction
M. A. Soria1, P. Pérez1, S.A.C. Carabineiro2, F. J. Maldonado-Hódar3, A. Mendes1, Luis
M. Madeira1*
1 LEPAE – Chemical Engineering Department, Faculty of Engineering - University of
Porto, Rua Dr. Roberto Frias, s/n, 4200-465 Porto, Portugal.
2 LCM - Laboratory of Catalysis and Materials - Associate Laboratory LSRE/LCM,
Chemical Engineering Department, Faculty of Engineering - University of Porto, Rua Dr. Roberto Frias, s/n, 4200-465 Porto Portugal.
3Carbon Research Group - Inorganic Chemistry Department - Faculty of Sciences -
University of Granada, Spain.
* Corresponding author. Tel.: +351-22-5081519; Fax: +351-22-5081449; E-mail: [email protected]
2
Abstract
The low temperature water–gas-shift reaction has been studied over a series of nanosized Au/Fe2O3 catalysts. The effect of the synthesis method on the catalytic activity has been
analysed. A series of catalysts with different Au loadings has been prepared by different methods: Deposition-Precipitation (DP), Liquid Phase Reductive Deposition (LPRD) and Double Impregnation Method (DIM). The Au/Fe2O3 catalysts prepared by DP showed
the highest CO conversion. The catalysts were characterised by hydrogen temperature programmed reduction (TPR-H2), high-resolution transmission electron microscopy
(HRTEM), X-ray powder diffraction and X-ray photoelectron spectroscopy. TPR-H2
analysis revealed that gold promotes the reducibility of the Fe2O3 support, which is crucial
in this redox reaction. HRTEM evidences a very good dispersion of gold over the iron support, with nanoparticles in the range 2.2-3.1 nm for the DP and LPRD series, and a negligible increase in the average particle size of the used samples. For the DIM series, much larger Au particles (~6.6 nm) were obtained.
Keywords
3
1. Introduction
The water–gas shift (WGS) reaction (eq.1) is widely used in the chemical industry to convert CO from syngas into CO2 and produce additional H2 [1].
H2O + CO ↔ CO2 + H2 ΔH0298 = -41 kJ mol-1 (1)
This is an important process to produce CO-free hydrogen or to adjust the H2/CO ratio.
The latter is especially desirable for downstream processes, such as Fischer-Tropsch and methanol synthesis [2]. On the other hand, high purity hydrogen is very important to use in fuel-cell power systems and ammonia synthesis, since CO is a poison for the iron catalyst used in ammonia production and for the anodic platinum electrode of the fuel cells [3, 4].
The WGS has the advantage that is a mildly exothermic equilibrium-limited reaction, thus is thermodynamically favoured at lower temperatures but it has the disadvantage that the reaction kinetics is reduced under such conditions, decreasing so the yield of H2 and
increasing the amount of catalyst required to reach valuable CO conversions. Traditionally, in order to achieve high reaction rate and a high CO conversion, the WGS reaction is carried out in two catalytic reaction steps including high-temperature shift (HT-WGS) and low-temperature shift (LT-WGS) reactors [1, 5]. The first step, HT-WGS, operates in the temperature range of 350–450 °C, which has fast reaction rate but low CO equilibrium conversion values. The second stage, LT-WGS, generally performed in the range of 200–250 ºC, is thermodynamically favourable to further convert CO, but relatively slow in terms of reaction rate [6-10].
There are two main classes of materials used in industry for the WGS reaction: Fe–Cr oxide mixtures for HT-WGS and Cu–Zn or Co–Mo oxides for LT-WGS [1, 11].It is also
4
known that oxide-supported noble metals (Pt, Au, etc.) are also able to catalyse the LT-WGS reaction [12-18], for which better catalysts are required.
In spite of their high cost, noble metal catalysts have been gaining increased interest in the last decades, due to their promising usage in fuel cell applications [11, 19]. Basically,
in situ fuel cell grade production of hydrogen requires a WGS reactor loaded with
catalysts that: (i) are non-pyrophoric, (ii) do not require pre-reduction treatment, and (iii) are robust in cycles of rapid heating and cooling. Cu-based conventional catalysts require strict reduction conditions that, after activation, are highly reactive towards air (pyrophoric), being hazardous during start-up and shut-down cyclic operation [20-22]. Au-based catalysts can be successfully used in those applications because they are able to overcome these drawbacks.
Different oxides (i.e. Fe2O3, TiO2, ZnO, Zr2O, CeO2) have been described as supports for
gold-based catalysts [14-18, 23-25]. The increase in activity when gold is added to these oxides in LT-WGS was explained as a synergetic effect between gold and the metal oxide [24-26]. The nature of the support plays an important role in the activity of Au-based catalysts. Particularly, in the case of Fe2O3 support, the Fe2+ / Fe3+ redox couple has a
significant role in the WGS because the reaction takes place via a redox mechanism [25, 27, 28].
Deposition-precipitation (DP) and co-precipitation (CP) are the most common methods used for the synthesis of Au-based catalysts for LT-WGS reaction [20, 24, 25, 29-31]. Recently, liquid-phase reductive deposition (LPRD) and double impregnation (DIM) techniques have been also used to prepare these catalysts [32, 33]. These not so common and relatively new methods are environmentally and economically more favourable for the production of highly active Au-based catalysts. Moreover, Au-based catalysts
5
prepared by LPRD and DIM have shown good performances towards the CO oxidation reaction [33-36]. To the best of our knowledge, Au-based catalysts prepared by LPRD or DIM techniques have not been used for WGS reaction yet.
The aims of this work are: (i) to study how the preparation method and the amount of Au affect the activity of Au-based samples for the LT-WGS reaction, and (ii) to gain insight into the physico-chemical properties influencing the activity and stability of Au/Fe2O3
catalysts for the mentioned reaction.
2. Experimental
2.1 Catalysts Preparation
2.1.1 Double Impregnation Method (DIM)
The DIM method is similar to the traditional wetness impregnation, but it involves a second impregnation step with the addition of an aqueous solution of Na2CO3 [33, 37,
38]. First, the support was impregnated with an aqueous solution (5×10⁻³ M) of
HAuCl4.3H2O (Alfa Aesar) and then with an aqueous solution of Na2CO3 (10-2 M), under
constant ultrasonic stirring. The slurry was then thoroughly washed with distilled water and dried in an oven at 120 °C overnight. α-Fe2O3 (Sigma Aldrich) was used as support.
Different amounts of Au (1.5, 3 and 5 wt. %) were used, thus providing samples with different metal loads. The experimental content of gold in similar samples prepared by DIM was checked by means of ICP and was reported in several previous works [34, 39-41].
2.1.2 Liquid Phase Reductive Deposition (LPRD)
An aqueous solution of HAuCl4.3H2O (5×10⁻³ M) was mixed with an aqueous solution
6
The resulting solution was aged in the dark, at room temperature, for 24 h, in order to complete the hydroxylation of Au3+ ions. Then, the appropriate amount of support
(-Fe2O3) was added to the solution and, after ultrasonic dispersion for 30 min, the
suspension was aged in the oven, at 100 ºC, overnight. The resulting solid was washed repeatedly with distilled water for chloride removal and again dried in the oven at 100 ºC overnight. Different Au-based catalysts with 1.5, 3 and 5 wt. % of Au were prepared. The actual gold loading for samples prepared by LPRD was assessed by ICP as reported in several previous works [41, 43].
2.1.3 Deposition-precipitation (DP)
Several samples containing 1.5, 3 and 5 wt. % of Au were prepared by the DP method [44]. A solution of NaOH (1 M) was added to an aqueous solution of HAuCl4 (5×10⁻³ M)
in order to rise the pH of the solution to 9. The support (-Fe2O3) was then added with
stirring at room temperature (1 g per 50 ml of solution). The resulting suspension was heated to 70 ºC and vigorously stirred for 1 h; after cooling the solid obtained was filtered, thoroughly washed with deionized water and then vacuum-dried at room temperature.
In all the methods reported above, a commercial -Fe2O3, with a BET surface area of 6
m2 g-1 and an average particle size of 63 nm [38], was used as support. The catalysts
prepared by DP, LPRD and DIM techniques were labelled as xAu/Fe2O3_DP,
xAu/Fe2O3_LPRDP and xAu/Fe2O3_DIM, respectively,where x represents the nominal
loading of Au in wt. %. For the DP series, the actual gold loading was 1.6 ± 0.1, 2.5 ± 0.1 and 4.6 ± 0.2 wt. % for samples 1.5Au/Fe2O3_DP, 3Au/Fe2O3_DP and 5Au/Fe2O3_DP,
7
The Au/Fe2O3 (5 nominal wt. % of Au) catalyst, supplied by the World Gold Council
(WGC), was also used for comparison purposes. This catalyst was labelled as 5Au/Fe2O3_
reference and contains 4.7 ± 0.2 wt. % of Au as determined by AAS.
2.2 Catalytic Activity Runs
Activity measurements were carried out in a fixed-bed reactor. This reactor consists in a stainless steel tube with a length of 60 mm and 10 mm o.d., loaded with 0.2 g of Au-based catalyst (Ø < 200 µm) diluted with glass beads (Sigma Aldrich 212-300 μm) and framed in both ends by two discs of stainless steel mesh (10-15 μm).
Before WGS tests, the catalyst was heated in situ up to 200 °C (5 °C/min) under 50 mlN/min N2 flow. Then, the catalyst was reduced at this temperature using 50 mlN/min of
a 15% H2/N2 feed mixture. After 45 minutes of reduction, a 50 mlN/min of N2 flow was
used during 30 min to sweep H2 from the system. The catalyst was then exposed to a
standard water–gas shift composition feed of 4.7 vol. % CO, 10.1 vol. % CO2, 35.4 vol.
% H2O and 28.5 vol. % H2, balanced with N2. The catalytic tests were performed at
atmospheric pressure, at different temperatures between 150 and 300 ºC, with a total flow rate of 50 mlN/min (thus the contact time was W/Q = 6.67 x10⁻⁵ g·h·mlN-1).
Figure 1 shows the set-up used for the catalytic activity measurements in the LT-WGS reaction. The feed gases were controlled by mass flow controllers (Bronkhorst). A Controlled Evaporation and Mixing (CEM,Bronkhorst) unit was used to evaporate the water while mixing the generated steam with the feed gases. The reactor was encased in an electric oven (Memmert, Type UNE200), controlled by a programmable temperature controller. The tubes between the CEM and the reactor were heated at 115 ºC in order to prevent steam condensation. Moisture in the product reaction gases was condensed by a peltier cooling placed at the reactor output (Marlow industries, model RC 12-6L).
8
The dry product gases were analysed with a DANI 1000 gas chromatograph equipped with a chromatographic column (Supelco Carboxen 1010 Plot, from Sigma-Aldrich, 30 m × 0.32 mm i.d.) and a micro-thermal conductivity detector (TCD) and operated with He as carrier gas (1 mLN min-1).The catalytic activity was expressed as percentage of the
CO conversion (XCO (%)) calculated as [(Fin – Fout) / Fin] 100, where Fin and Fout are the
CO molar flow at the input and output of the reactor, respectively.
Thermodynamic equilibrium CO conversion (XCOeq) was calculated by means of the
Gibbs free energy minimization method via ASPEN-HYSYS software, as described elsewhere [45].
2.3 Catalysts Characterisation
The gold loading was determined by atomic absorption spectrometry (AAS) by means of a Unicam 939 atomic absorption spectrophotometer equipped with a deuterium lamp background correction. An Au hollow cathode lamp (Heraeus), operating at 242.8 nm, was used as the radiation source. For the analysis, 20 mg of sample were diluted in aqua regia by agitation at room temperature. The error of the analysis was within ± 5 %.
Temperature programmed reduction (TPR-H2) experiments were performed in a fully
automated AMI-200 Catalyst Characterization Instrument (Altamira Instruments), equipped with a quadruple mass spectrometer (Dymaxion 200 amu, Ametek). In a typical TPR-H2 experiment, 50 mg of sample was placed in a U-shaped quartz tube located inside
an electrical furnace and subjected to a 10 ºC/min heating rate up to 1000 ºC, under He flow of 29 mlN/min and H2 flow of 1.5 mlN /min.
High-resolution transmission electron microscopy (HRTEM) images were obtained by means of a Phillips CM-20 electron microscope which operated at 120 kV and with
point-9
to-point resolution of 2.7 Å and 0.14 Å between lines. The images were recorded at direct magnification of 600,000x and were used for the particle size and particle size distribution determination. For the analysis, the powders were dispersed in ethanol and homogenized by ultrasonic dispersion before “fishing” the catalysts particles from the dispersion, allowing the drying at ambient conditions.
X-ray diffraction (XRD) was carried out with a Bruker D8 Advance diffractometer using the Kα radiation of Cu. The 2 range between 10 and 80º was scanned with a step of 0.02º and step time of 15 s.
The X-ray photoelectron spectroscopy (XPS) analysis was performed using a Kratos AXIS Ultra HSA apparatus, with VISION software for data acquisition and CASAXPS software for data analysis (spectra deconvolution). The analysis was carried out with a monochromatic Al K X-ray source (1486.7 eV), operating at 15 kV (90 W), in FAT mode (Fixed Analyser Transmission), with a pass energy of 40 eV for regions ROI and 80 eV for survey. The binding energies were calibrated by fixing the C-(C, H) contribution of the C1s adventitious carbon at 285 eV. Data acquisition was performed with a pressure lower than 110-6 Pa, and it was used a charge neutralisation system.
3. Results
3.1 Catalytic activity
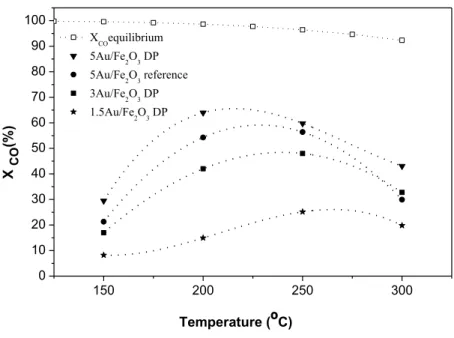
Figure 2 shows CO conversion (XCO) as a function of temperature for the LT-WGS
reaction for the different Au/Fe2O3 catalysts prepared by the DP method; it also includes
data gathered with the 5Au/Fe2O3 _reference catalyst from World Gold Council. The
equilibrium CO conversion is also included in this figure. Samples 5Au/Fe2O3_DP,
10
conversion, namely, it increases from 150 to around 200 ºC and then decreases for higher temperatures. In the case of 1.5Au/Fe2O3_DP sample, the XCO steadily increases with
reaction temperature, reaching a maximum at 250 ºC. A further increase of temperature results in a slight decrease of XCO.
Whatever the temperature, the activity of the Au-based catalysts prepared by the DP technique increases with the Au loading (5Au/Fe2O3_DP > 3Au/Fe2O3_DP >
1.5Au/Fe2O3_DP). Furthermore, the 5Au/Fe2O3_DP catalyst is more active than the
5Au/Fe2O3_reference in the entire range of the temperatures explored. It is worth noting
that at 300 ºC the 3Au/Fe2O3_DP (3 wt.% Au) catalyst shows nearly the same activity as
the commercial sample, despite the latter having a higher Au loading (5 wt.%).
CO conversion as a function of temperature for the Au-based catalysts prepared by LPRD method is shown in Figure 3. The activity of these catalysts is higher for smaller Au loadings (1.5Au/Fe2O3_LPRD > 3Au/Fe2O3_LPRD > 5 Au/Fe2O3_LPRD), showing the
opposite trend as the counterpart catalysts prepared by DP. For all catalysts, the activity increases with temperature up to 250 ºC; afterwards it remains nearly constant (1.5Au/Fe2O3_LPRD) or slightly decreases (3 and 5 wt. % Au).
The Au-based catalysts prepared by the DIM method have a very low CO conversion (≤ 10 %) in the range of temperatures analysed (data not shown).
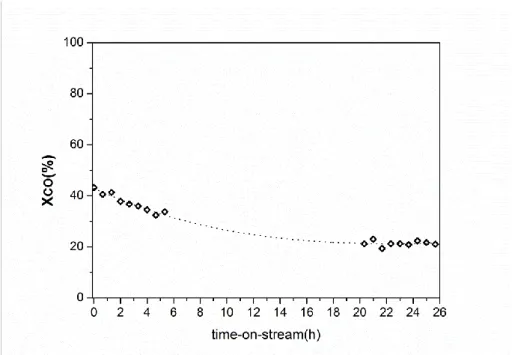
With the more promising catalytic materials, DP series, further tests were then carried out. Namely, the stability of the 3Au/Fe2O3_DP catalyst was assessed based on the CO
conversion history studiedat 200 ºC. The results obtained are shown in Figure 4. It can be seen that carbon monoxide conversion with such material decreases slowly during the first 20 h of reaction, and then tends to stabilize.
11
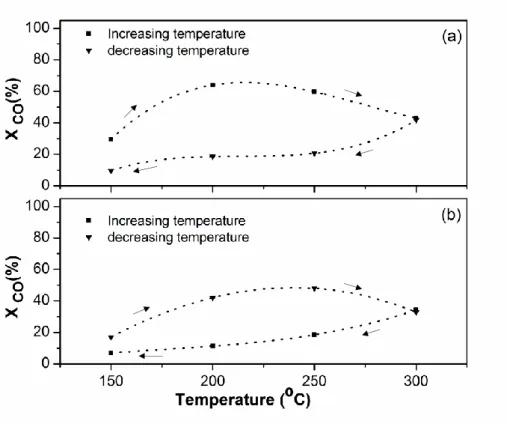
Figures 5a-5b illustrate the catalytic activity of the 5Au/Fe2O3_DP and a 3Au/Fe2O3_DP
samples, respectively, as a function of temperature during: (i) an heating step (T is increased from 150 to 300 ºC) and (ii) a cooling step (T is decreased from 300 to 150 ºC). This figure clearly shows that regardless of temperature, the XCO value recorded during
the decreasing temperature test (300 ºC → 150 ºC) is always dramatically lower than the corresponding counterpart during the increasing temperature test (150 ºC → 300 ºC).
3.2 Characterisation
3.2.1 TPR-H2
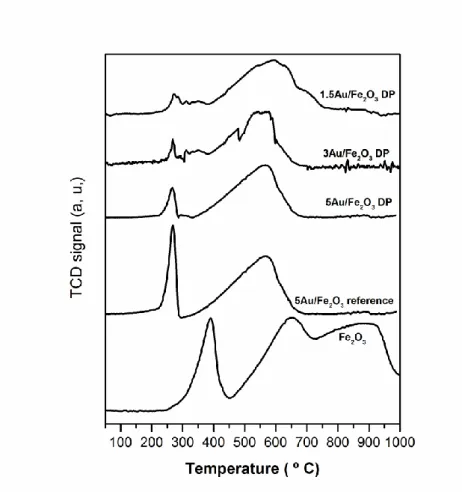
The TPR-H2 results obtained for bulk -Fe2O3, 5Au/Fe2O3_reference and Au/Fe2O3_DP
samples are illustrated in Figure 6. Large differences in the reducibility of the bulk -Fe2O3 and the Au/Fe2O3_DP samples can be seen. Bulk -Fe2O3 presents a very sharp
peak centred at 390 ºC and two partially overlapped broad peaks with maxima at ~650 and ~900 ºC, respectively. The Au/Fe2O3_DP catalysts present a sharp peak at low
temperature (~265 ºC) and another broad peak at higher temperature (~565 ºC). It should be noted that, in the case of 1.5Au/Fe2O3_DP, both peaks are shifted towards slightly
higher temperatures, compared to the catalysts with higher Au loading (3 and 5 wt.% Au). Furthermore, the high temperature peak is broader than those of the other samples and presents a shoulder around 700 ºC.
The TPR-H2 profiles for the series of samples prepared by the DIM technique are shown
in Figure 7. The samples containing 1.5 and 3 wt. % of Au exhibit four major peaks at ~180, ~360, ~570 and ~770 ºC. The 5Au/Fe2O3_DIM sample shows a very similar
TPR-H2 profile; the only difference is that the peak at the lower temperature appears at 300 ºC
12
TPR-H2 profiles for the samples prepared by LPRD are given in Figure 8. All the samples
show two small peaks at ~150 and ~270 ºC and two large overllaped peaks between ~400 and ~850 ºC.
3.2.2 XRD
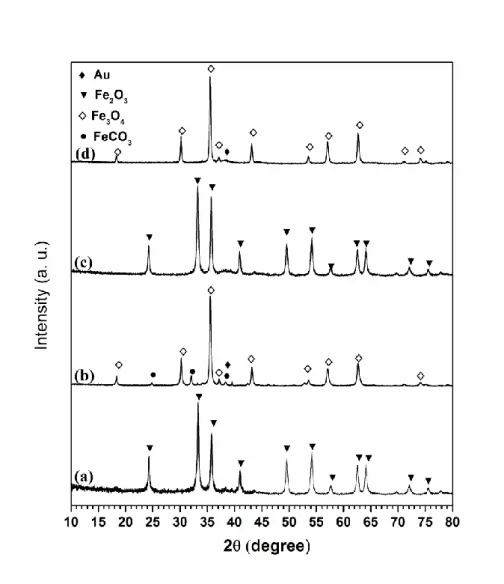
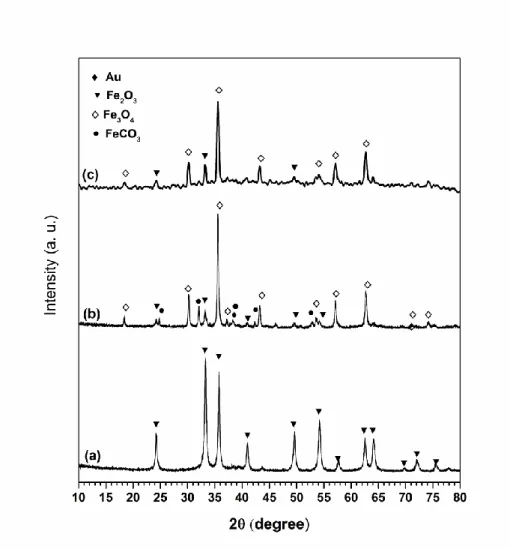
Figures 9 and 10 show the X-ray diffraction patterns of some fresh and used Au-based samples that revealed to be particularly active; samples used refer to those employed in runs at 300 ºC, unless otherwise stated. Fresh catalysts 5Au/Fe2O3_DP,
1.5Au/Fe2O3_LPRD (Figure 9) and 3Au/Fe2O3_DP (Figure 10) present the same
diffraction patterns with peaks at 24.1°, 33.1°, 35.6°, 40.9°, 49.5°, 54.2°, 57.6°, 62.5°, 64.1°, 72.0º and 75.6º, characteristic of the crystal structure of rhombohedral hematite -Fe2O3 (JCPDS file Nº 86-0550). The XRD patterns of the used samples are clearly
different. The spent 5Au/Fe2O3_DP sample (Figure 9, diffractogram d) shows reflections
at 18.4º, 30.1º, 35.4º, 37.1º, 43.2º, 53.6º, 57.1º, 62.6º, 71.2º, 74.0º and 75.0º which match with cubic magnetite reference (Fe3O4; JCPDS file Nº 80-0390). The diffractogram d also
presents a broad peak at 38.2º corresponding to Au0 (JCPDS file Nº 04-0784). The spent
1.5Au/Fe2O3_LPRD catalyst (Figure 9, diffractogram b) shows reflections attributed to
magnetite, and other peaks assigned to siderite (FeCO3;JPCDS file Nº 83-1764) and Au0.
The spent 3Au/Fe2O3_DP catalyst (Figure 10, diffractogram b), besides hematite,
magnetite and Au0 also exhibit peaks assigned to siderite, while the 3Au/Fe
2O3_DP
sample after stability test at 200 ºC for 25 h (Figure 10, diffractogram c) just shows peaks attributed to hematite and magnetite. Au2O or Au2O3 were not observed in
any of the XRD patterns.
13
Figures 11a-11d give representative HRTEM images of the fresh and used Au-based catalysts prepared by DP and LPRD techniques that revealed to be more active. Au nanoparticles (indicated by an arrow in the figure) can be clearly distinguished from the Fe2O3 support. The gold cores look distinctly darker than the iron oxide due to the higher
electron density. The HRTEM images clearly demonstrate that the Au nanoparticles are homogeneously distributed over the support on the catalyst before and after reaction.
The Au particle size distributions of some fresh and used catalysts are shown in Figures 12 and 13, respectively. HRTEM analysis for Au-based catalysts prepared by DP and DIM methods reveals that the average gold nanoparticle size is very similar regardless the gold loading (~2.3 and 6.6 nm for DP and DIM respectively). However, for Au/Fe2O3_LPRD catalysts the average gold nanoparticle size slightly increases with the
loading of Au (2.5 and 3.1 nm for 1.5 and 5 wt. % Au, respectively). For the series of Au/Fe2O3 used samples, the gold (average) nanoparticle size increased very little after
reaction.
3.2.4. XPS
Figure 14 compares the XPS Au 4f spectra for the as-prepared 5Au/Fe2O3_DIM,
3Au/Fe2O3_DP and 1.5Au/Fe2O3_LPRD catalysts. In all the Au-based samples the Au 4f
XPS peak appears as a doublet; 4f7/2 and 4f5/2.
According to the peaks position of the Au 4f7/2 and 4f5/2 and comparing with the literature
[38, 46-49], it can be inferred that the sample prepared by the DP method has cationic gold (Au1+ and Au3+), while the catalysts prepared by LPRD and DIM methods contain
mainly metallic gold (Au0).
14
4.1 Effect of gold on the reducibility of the -Fe2O3 support
The TPR-H2 profile of the support (Figure 6) indicates that -Fe2O3 is reduced in a
three-step mechanism. The low temperature peak was attributed to the first stage of reduction of hematite to magnetite (Fe2O3 → Fe3O4) [27, 50, 51]. The two high temperature peaks
were assigned to the two-step magnetite reduction sequence, namely: Fe3O4 → FeO →
Fe [27, 50, 51]. This three-step mechanism of -Fe2O3 reduction is consistent with several
results reported in literature [27, 31, 51-53]. However, other authors claimed that the reduction of -Fe2O3 proceeds by a two-step mechanism (Fe2O3 → Fe3O4 → Fe), based
on the fact that only two peaks were observed [50, 51, 54]. The peak at low temperature is attributed to reduction of hematite into magnetite (Fe2O3 → Fe3O4) and the high
temperature peak is assigned to direct reduction of Fe3O4 into Fe. This difference of
reduction mechanism depends on the operational condition used for TPR experiment (i.e. mass/type of the catalyst, heating rate, composition of H2 stream, etc.).
As evidenced by XRD, in the as-synthetized Au/Fe2O3_DP catalysts (Figures 9-10), only
one phase is present, corresponding to Fe2O3. Therefore, the peak at low temperature in
the TPR-H2 profile could be ascribed to the reduction of Fe2O3 into Fe3O4. It is important
to note that the higher the Au loading in the DP series, the higher is the shift of this peak towards lower temperatures with respect to that of the Fe2O3 support (Figure 6). This
trend is in agreement with previous studies of Au/Fe2O3 catalysts reported in literature
[23, 27, 55, 56] where this effect was explained in terms of the activation (adsorption-dissociation) of molecular hydrogen on the gold metal and the spillover of the atomic hydrogen to the -Fe2O3 material [23, 27, 57, 58], and is supported by the fact that the
15
As already mentioned, the high temperature peaks attributed to successive reduction of Fe3O4 in Au/Fe2O3_DP samples is different from that of the -Fe2O3 support. In fact,
these catalysts show only one broad peak that is shifted (~100 ºC) to lower temperatures compared with the -Fe2O3 profile. This shows that the presence of Au not only promotes
the reduction of Fe3O4, but changes the reduction mechanism of Fe3O4 from a two-step
process (-Fe2O3, two overlapped peaks) to a one-step process (Au/Fe2O3 one single
peak).
The TPR-H2 profiles of the Au-based samples prepared by DIM (Figure 7) and LPRD
(Figure 8) methods point to the same conclusion as in the DP catalysts, namely, gold promotes the reducibility of the -Fe2O3 support. However, for these samples, the
reduction of Fe3O4 to metallic Fe occurs in a two-step process, similarly to the -Fe2O3
support. It is clear that the reducibility of the Au-based catalysts is strongly different depending on the synthesis method. Indeed, according to the preparation, the Fe2O3
reducibility decreases in the order: DP > LPRD > DIM. This suggests a higher interaction between the gold and the Fe3O2 in the DP method, which resulted in more active catalysts.
There is not a general consensus in the literature about the temperature at which supported gold oxide is reduced. The reduction of bulk gold oxide was reported as two sharp reduction peaks at 195 °C and at 232 °C [53]. Some authors observed the reduction of gold oxide in the 100-150 ºC range for Au/Fe2O3 samples prepared by the co-precipitation
method [48, 58, 59]. They claimed that the peak of reduction of AuxOy species appears at
lower temperature, with respect to bulk gold oxide, as a consequence of a much higher surface area of Au/Fe2O3 catalysts [48, 60].
Nevertheless, other authors reported that the reduction of the AuxOy species occurs at
16
technique. In this case, it is assumed that the reduction of gold oxides and Fe2O3 to Fe3O4
transformation occurs simultaneously. It was argued that some sort of interaction between the iron oxide ant the Au species could explain why the reduction of gold species occurs at higher temperature. This latter issue is in good agreement with our finding for the Au-based samples prepared by the DP method (Figure 6), suggesting a strong interaction between Au and Fe.
On the other hand, XPS of the samples prepared by DP method shows the presence of gold as Au1+ and Au3+ (Figure 14), although no crystalline Au
xOy species were found by
XRD, even in the sample containing 5 wt. % of Au. It seems likely that such species are highly dispersed as evidenced by HRTEM. In addition, based on the fact that the area of the lower temperature peak increases as a function of the loading of Au (cf. Figure 6), it appears that the reduction of both gold and iron oxides occurs simultaneously in Au/Fe2O3_DP samples.
As for the Au-based samples prepared by DIM and LPRD methods, XPS analysis reveals that these catalysts contain principally metallic gold. Therefore, it is very likely that the broad peak observed at around 150 °C in the TPR-H2 corresponds to the reduction of the
hydroxylated iron oxide. Besides, for this kind of samples it was reported that the reduction of the hydroxylated iron oxide occurs at this temperature [38].
4.2 Influence of the preparation method over the catalyst’s activity in the LT-WGS reaction
As already said, the Au/Fe2O3_DP and 1.5Au/Fe2O3_LPRD catalysts were very active in
the LT-WGS reaction. This confirms what was found in previous works [24, 25, 28, 61, 62] for samples prepared by DP or co-precipitation methods. Moreover, it was found that the CO conversion increases with the temperature, reaching a maximum (around 200-250
17
ºC) and then slightly decreases with further temperature increase. A similar trend was already reported elsewhere [24, 25, 28, 61, 62].
The CO conversion of Au/Fe2O3 catalysts prepared by the DP and DIM methods changes
according to the following trend: 5Au/Fe2O3 > 3Au/Fe2O3 > 1.5Au/Fe2O3. The fresh
5Au/Fe2O3 (Au average particle size = 2.2 nm), 3Au/Fe2O3 (Au average particle size =
2.5 nm) and 1.5Au/Fe2O3 (Au average particle size = 2.3 nm) samples prepared by DP
show nearly the same Au average particle size, as evidenced by HRTEM (Figure 12). This suggests that Au is highly dispersed over the samples, although they have different Au contents. In the case of the Au/Fe2O3 catalysts prepared by DIM method, the Au
average particle size is 6.6 nm for 1.5Au/Fe2O3_DIM and 5Au/Fe2O3_DIM fresh samples.
Thus, for Au/Fe2O3_DP (and also Au/Fe2O3_DIM) catalysts, the activity strongly
depends on the Au loading, increasing for higher metal loads because its dispersion is nearly not affected.
However, for the catalysts prepared by the LPRD method the activity follows the opposite trend, namely: 1.5Au/Fe2O3_LPRD > 3Au/Fe2O3_LPRD > 5Au/Fe2O3_LPRD. HRTEM
analysis of 1.5Au/Fe2O3_LPRD and 5Au/Fe2O3_LPRD fresh catalyst reveals that the Au
average particle size is 2.5 and 3.1 nm, respectively. This suggests that the activity of the Au/Fe2O3_LPRD catalysts depends on the Au nanoparticles dispersion.
Comparing the activity of the catalysts prepared by the different techniques, XCO
decreases according to the following order: Au/Fe2O3_DP > Au/Fe2O3_LPRD >
Au/Fe2O3_DIM. This trend matches the order of interaction between the gold and the
Fe2O3 as suggested by TPR analysis; the strongest is the metal-support interaction, the
highest is the activity. Therefore, this indicates that the high catalytic activity of the Au/Fe2O3 catalysts is not only related to the gold dispersion but also to a higher interaction
18
of gold particles with the iron oxide support, both these issues depending on the adopted preparation method.
On the other hand, the slightly decrease of activity observed in Au/Fe2O3_DP and
Au/Fe2O3_LPRD samples above 200-250 ºC (cf. Figures 2 and 3, respectively) could be
related to the sintering of gold particles. However, HRTEM of some of the used catalysts prepared by DP and LPRD did not show significant changes in Au particle size. Thus, it seems that sintering of Au particles per se cannot account for the loss of activity shown by Au/Fe2O3_DP and Au/Fe2O3_LPRD samples, but other aspects must be also taken into
account, such as changes of the oxidation state of iron, as observed by XRD (Figure 9 and 10).
Some authors [25, 27, 28] reported that the formation of CO2 and H2 in WGS reaction
occurs via a reduction-oxidation mechanism of the -Fe2O3. The XRD patterns of some
used catalysts evidence changes of the iron oxide phase, which depends on the preparation method and for the same method on the Au content (Figures 9-10). For example, in the used 5Au/Fe2O3_DP only magnetite (Fe3O4) is observed, while in the spent
3Au/Fe2O3_DP sample residual hematite (Fe2O3), magnetite and siderite (FeCO3) are
observed, and in the used 1.5Au/Fe2O3_LPRD magnetite and siderite are seen. This
clearly indicates that changes of the iron oxide structure take place during reaction, in good agreement with TPR results, which shows that reduction of ferrite to magnetite occurs around 200 ºC. Thus, a suitable ratio between both oxidation states, i.e. Fe2+ and
Fe3+ species, seems essential for high catalytic activity.
4.3 Stability of the catalysts
Carbon monoxide conversion with the time on stream on 3Au/Fe3O2_DP catalyst showed
19
has also been observed during cyclic temperature-programed operation (Figure 5) since in the cooling stage (300 to 150 ºC) CO conversion does not reach the values obtained during the heating stage (150 to 300 ºC). Deactivation of the Au/Fe2O3 catalysts has also
been reported elsewhere [28]. The HRTEM of the 3Au/Fe3O2_DP sample after stability
test shows that the average gold nanoparticle size (Figure 13d) did not vary with respect to the fresh sample (Figure 12b). Therefore, apparently no sintering occurred during the stability test. According to the study of reducibility of the Au/Fe2O3_DP catalysts and
their characterization (HRTEM and XRD) after reaction, it seems likely that the stability of the catalyst mainly depends on the oxidation state of the iron species during reaction.
4.4 Performance of the materials vs. other catalysts
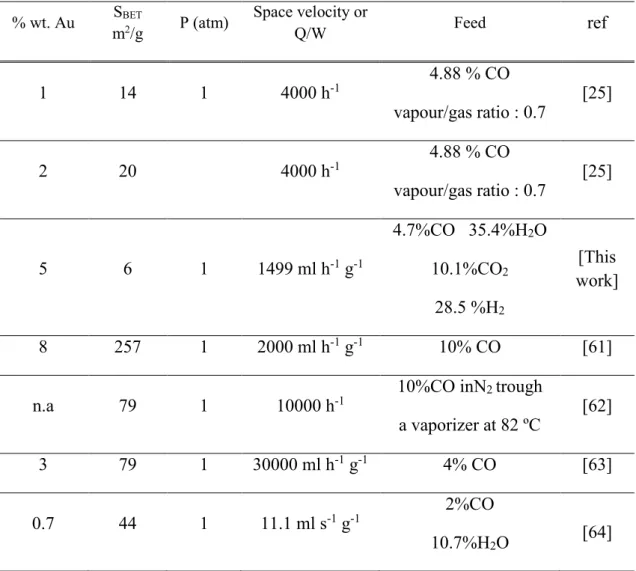
Figure 15 compares the carbon monoxide conversion at different reaction temperatures for the 5Au/Fe2O3_DP catalyst (material prepared in this work exhibiting the highest XCO values) and Au/Fe2O3 catalysts reported in the literature. Table 1 summarizes the
gold content, specific surface area (SBET) of this series of catalysts, as well as the
experimental conditions used for the tests. A proper comparison between our results and those reported in the literature is hard to establish due to the very different working conditions and/or catalysts employed, as shown in Table 1. Despite of the latter, the catalyst prepared in this work is among the best performing catalysts (Figure 15), even if in the reactor feed a reformate stream containing WGS products has been employed and the catalyst has been prepared from a support with a very low surface area.
5. Conclusions
The TPR-H2 profiles of the Au/Fe2O3 system reveals that gold promotes the reducibility
of the Fe2O3 support. The activity of the Au/Fe2O3 catalysts prepared by DP and LPRD
20
Au/Fe2O3_DP samples, the highest activity in the LT-WGS reaction matches the highest
Au content (5 wt. %), whereas for the Au/ Fe2O3_LPRD samples the catalyst containing
the lowest nominal amount of Au (1.5 wt. %) was the most active. This was assigned to the higher Au nanoparticles size found on samples prepared by LPRD with higher loadings, thus affecting the gold dispersion over the support; for the DP series, Au dispersion was almost not affected (particle size ~2.3 nm). For the Au/Fe2O3_DIM
catalysts, a much larger size of the Au nanoparticles was obtained (6.6 nm).
The catalytic activity of Au/Fe2O3 catalysts strongly depends not only on the dispersion
of gold, but also on the reducibility of the support. Gold is highly dispersed on iron oxide, with Au average particle size in the range of 2.2-3.1 nm for DP and LPRD series. Regarding stability, 3Au/Fe2O3_DP catalyst became somewhat deactivated with time on
stream, but this is mostly related to changes in iron oxidation state, not to Au sintering; after a period of ca. 20 h activity tended to stabilize.
Acknowledgements
The authors acknowledge financing from the Portuguese Foundation for Science and Technology (FCT) through the project PTDC/EQU-ERQ/098730/2008. M.A. Soria, Patricia Pérez and Sónia Carabineiro are grateful to the FCT for the postdoctoral grant (SFRH / BD / 88444 / 2012), doctoral grant (SFRH / BD / 73673 / 2010) and for the CIENCIA 2007 program, respectively.
21
5. References
[1] Ke Liu, Chunshan Song, V. Subramani, Hydrogen and Syngas Production and Purification Technologies, Wiley, Alche, January 2010.
[2] J. Li, H. Yoon, T.-K. Oh, E.D. Wachsman, Int J of Hydrogen Energ 37 (2012) 16006-16012.
[3] D. Cameron, R. Holliday, D. Thompson, J Power Sources 118 (2003) 298-303. [4] H.F. Abbas, W.M.A. Wan Daud, Int J of Hydrogen Energ 35 (2010) 1160-1190. [5] D. Ma, C.R.F. Lund, Ind. Eng. Chem. Res 42 (2003) 711-717.
[6] J.Y. Lee, D.-W. Lee, K.-Y. Lee, Y. Wang, Catal Today 146 (2009) 260-264. [7] M. Maroño, E. Ruiz, J.M. Sánchez, C. Martos, J. Dufour, A. Ruiz, Int J of Hydrogen Energ 34 (2009) 8921-8928.
[8] T.A. Adams Ii, P.I. Barton, Int J of Hydrogen Energ 34 (2009) 8877-8891. [9] P. Gawade, B. Mirkelamoglu, U.S. Ozkan, J. Phys. Chem. C 114 (2010) 18173-18181.
[10] D. Mendes, A. Mendes, L.M. Madeira, A. Iulianelli, J.M. Sousa, A. Basile, Asia-Pac. J. Chem. Eng 5 (2010) 111-137.
[11] C. Ratnasamy, J.P. Wagner, Catal Rev 51 (2009) 325-440.
[12] Q. Fu, H. Saltsburg, M. Flytzani-Stephanopoulos, Science 301 (2003) 935-938. [13] T. Bunluesin, R.J. Gorte, G.W. Graham, Appl Catal B-Environ 15 (1998) 107-114.
[14] C.H. Kim, L.T. Thompson, J Catal 230 (2005) 66-74.
[15] B.A. Lenite, C. Galletti, S. Specchia, Int J of Hydrogen Energ 36 (2011) 7750-7758.
[16] V. Idakiev, T. Tabakova, Z.Y. Yuan, B.L. Su, Appl Catal A-Gen 270 (2004) 135-141.
[17] Y. Zhang, Y. Zhan, C. Chen, Y. Cao, X. Lin, Q. Zheng, Int J of Hydrogen Energ 37 (2012) 12292-12300.
[18] D. Mendes, H. Garcia, V.B. Silva, A.l. Mendes, L.M. Madeira, Ind Eng Chem Res 48 (2008) 430-439.
[19] D.L. Trimm, Appl Catal A-Gen 296 (2005) 1-11.
[20] D. Andreeva, I. Ivanov, L. Ilieva, M.V. Abrashev, App Catal A-Gen 302 (2006) 127-132.
[21] A. Faur Ghenciu, Current Opinion in Solid State and Materials Science 6 (2002) 389-399.
[22] S. Hilaire, X. Wang, T. Luo, R.J. Gorte, J. Wagner, App Catal A-Gen 258 (2004) 271-276.
[23] D. Andreeva, Gold Bull 35 (2002) 82-88.
[24] D. Andreeva, V. Idakiev, T. Tabakova, A. Andreev, J Catal 158 (1996) 354-355. [25] D. Andreeva, V. Idakiev, T. Tabakova, A. Andreev, R. Giovanoli, Appl Catal A-Gen 134 (1996) 275-283.
[26] D. Andreeva, T. Tabakova, V. Idakiev, P. Christov, R. Giovanoli, App Catal A-Gen 169 (1998) 9-14.
[27] B. Aeijelts Averink Silberova, G. Mul, M. Makkee, J.A. Moulijn, J Catal 243 (2006) 171-182.
22
[29] A. Karpenko, Y. Denkwitz, V. Plzak, J. Cai, R. Leppelt, B. Schumacher, R.J. Behm, Catal Lett 116 (2007) 105-115.
[30] H. Daly, A. Goguet, C. Hardacre, F.C. Meunier, R. Pilasombat, D. Thompsett, J Catal 273 (2010) 257-265.
[31] K. Li, M. Haneda, Z. Gu, H. Wang, M. Ozawa, Mater Lett 93 (2013) 129-132. [32] Y. Sunagawa, K. Yamamoto, H. Takahashi, A. Muramatsu, Catal Today 132 (2008) 81-87.
[33] S. Carabineiro, N. Bogdanchikova, M. Avalos-Borja, A. Pestryakov, P. Tavares, J. Figueiredo, Nano Res 4 (2011) 180-193.
[34] S.A.C. Carabineiro, B.F. Machado, R.R. Bacsa, P. Serp, G. Dražić, J.L. Faria, J.L. Figueiredo, J Catal 273 (2010) 191-198.
[35] S.A.C. Carabineiro, A.M.T. Silva, G. Dražić, P.B. Tavares, J.L. Figueiredo, Catal Today 154 (2010) 21-30.
[36] S.A.C. Carabineiro, P. Tavares, J. Figueiredo, Appl Nanoscience 2 (2012) 35-46. [37] M. Bowker, A. Nuhu, J. Soares, Catal Today 122 (2007) 245-247.
[38] S.A.C. Carabineiro, N. Bogdanchikova, P.B. Tavares, J.L. Figueiredo, RSC Advances 2 (2012) 2957-2965.
[39] S.A.C. Carabineiro, S.S.T. Bastos, J.J.M. Órfão, M.F.R. Pereira, J.J. Delgado, J.L. Figueiredo, App Catal A-Gen 381 (2010) 150-160.
[40] S.S.T. Bastos, S.A.C. Carabineiro, J.J.M. Órfão, M.F.R. Pereira, J.J. Delgado, J.L. Figueiredo, Catal Today 180 (2012) 148-154.
[41] E.G. Rodrigues, S.A.C. Carabineiro, J.J. Delgado, X. Chen, M.F.R. Pereira, J.J.M. Órfão, J Catal 285 (2012) 83-91.
[42] S.A.C. Carabineiro, A.M.T. Silva, G. Dražić, P.B. Tavares, J.L. Figueiredo, Catal Today 154 (2010) 293-302.
[43] V.P. Santos, S.A.C. Carabineiro, P.B. Tavares, M.F.R. Pereira, J.J.M. Órfão, J.L. Figueiredo, App Catal B- Environ 99 (2010) 198-205.
[44] F. Moreau, G.C. Bond, A.O. Taylor, J Catal 231 (2005) 105-114.
[45] M.A. Soria, C. Mateos-Pedrero, A. Guerrero-Ruiz, I. Rodríguez-Ramos, Int J of Hydrogen Energ 36 (2011) 15212-15220.
[46] E.D. Park, J.S. Lee, J Catal 186 (1999) 1-11.
[47] W.S. Epling, G.B. Hoflund, J.F. Weaver, S. Tsubota, M. Haruta, J. Phys. Chem. 100 (1996) 9929-9934.
[48] M. Khoudiakov, M.C. Gupta, S. Deevi, App Catal A-Gen 291 (2005) 151-161. [49] G.J. Hutchings, M.S. Hall, A.F. Carley, P. Landon, B.E. Solsona, C.J. Kiely, A. Herzing, M. Makkee, J.A. Moulijn, A. Overweg, J.C. Fierro-Gonzalez, J. Guzman, B.C. Gates, J Catal 242 (2006) 71-81.
[50] J. Zieliński, I. Zglinicka, L. Znak, Z. Kaszkur, App Catal A-Gen 381 (2010) 191-196.
[51] W.K. Jozwiak, E. Kaczmarek, T.P. Maniecki, W. Ignaczak, W. Maniukiewicz, App Catal A-Gen 326 (2007) 17-27.
[52] A. Venugopal, J. Aluha, D. Mogano, M.S. Scurrell, Appl Catal A- Gen 245 (2003) 149-158.
[53] A. Venugopal, M.S. Scurrell, Appl Catal A-Gen 258 (2004) 241-249. [54] H.-Y. Lin, Y.-W. Chen, C. Li, Thermochimica Acta 400 (2003) 61-67.
[55] T. Tabakova, G. Avgouropoulos, J. Papavasiliou, M. Manzoli, F. Boccuzzi, K. Tenchev, F. Vindigni, T. Ioannides, Appl Catal B-Environ 101 (2011) 256-265.
[56] B.E. Solsona, T. Garcia, C. Jones, S.H. Taylor, A.F. Carley, G.J. Hutchings, Appl Catal A-Gen 312 (2006) 67-76.
23
[57] F. Boccuzzi, A. Chiorino, M. Manzoli, D. Andreeva, T. Tabakova, J Catal 188 (1999) 176-185.
[58] G. Wang, H. Lian, W. Zhang, D. Jiang, T. Wu, Kinet Catal 43 (2002) 433-442. [59] Z. Hao, L. An, H. Wang, T. Hu, React Kinet Catal Lett. 70 (2000) 153-160. [60] J.-N. Lin, B.-Z. Wan, App Catal B- Environ 41 (2003) 83-95.
[61] J. Hua, K. Wei, Q. Zheng, X. Lin, App Catal A-Gen 259 (2004) 121-130. [62] J. Li, Y. Zhan, F. Zhang, X. Lin, Q. Zheng, Chin J Catal 29 (2008) 346-350. [63] A. Luengnaruemitchai, S. Osuwan, E. Gulari, Catal Commun 4 (2003) 215-221. [64] W. Deng, C. Carpenter, N. Yi, M. Flytzani-Stephanopoulos, Top Catal 44 (2007) 199-208.
24
Tables
Table 1. Properties and experimental conditions employed during tests with Au/Fe2O3
catalysts. The variation of XCO as a function of temperature for these catalysts are
shown in Figure 15. % wt. Au SBET m2/g P (atm) Space velocity or Q/W Feed ref 1 14 1 4000 h-1 4.88 % CO vapour/gas ratio : 0.7 [25] 2 20 4000 h-1 4.88 % CO vapour/gas ratio : 0.7 [25] 5 6 1 1499 ml h-1 g-1 4.7%CO 35.4%H2O 10.1%CO2 28.5 %H2 [This work] 8 257 1 2000 ml h-1 g-1 10% CO [61]
n.a 79 1 10000 h-1 10%CO inN2 trough
a vaporizer at 82 ºC [62]
3 79 1 30000 ml h-1 g-1 4% CO [63]
0.7 44 1 11.1 ml s-1 g-1 2%CO
25
Figures
Figure1. Scheme of the set-up used for catalytic activity measurements in the LT-WGS
reaction. He CO CO2 H2 N2 CEM MFC MFC MFC MFC LMFC MFM GC Vent SI D Vent H2O Oven
MFC: Mass Flow Controller MFC: Mass Flow Meter
LMFC: Liquid Mass Flow Controller CEM: Controlled Evaporation and Mixing T: Thermocouple
GC: Gas Chromatograph SI: Sample Injector D: Detector Fixed–bed reactor T Drain Cold trap
26
Figure 2. Effect of gold content on CO conversion (XCO) vs. temperature in LT-WGS
reaction over Au/Fe2O3_DP catalysts; 5Au/Fe2O3_reference catalyst is also included.
Feed (vol. %): 4.7 CO, 10.1 CO2, 35.4 H2O, 28.5 H2 and 21.3 of N2. W/Q = 6.6710-5 g
h mlN-1. XCOeq = Equilibrium CO conversion at equilibrium.
150 200 250 300 0 10 20 30 40 50 60 70 80 90 100 XCOequilibrium 5Au/Fe2O3 DP 5Au/Fe2O3 reference 3Au/Fe2O3 DP 1.5Au/Fe2O3 DP X CO (%) Temperature (
º
C)27
Figure 3. Effect of gold content on CO conversion (XCO) vs. temperature in the LT-WGS
reaction over Au/Fe2O3_LPRD catalysts. Feed (vol. %): 4.7 CO, 10.1 CO2, 35.4 H2O,
28.5 H2 and 21.3 of N2. W/Q = 6.6710-5 g h mlN-1. XCOeq = Equilibrium CO conversion
28
Figure 4. CO conversion history for the 3Au/Fe2O3_DP catalyst at 200 ºC. Feed (vol. %):
29
Figure 5. CO conversion (XCO) as a function of temperature in the LT-WGS reaction
over the 5Au/Fe2O3_DP (a) and 3Au/Fe2O3_DP (b) samples; with (■) increasing or (▼)
decreasing the reaction temperature. Feed (vol. %): 4.7 CO, 10.1 CO2, 35.4 H2O, 28.5 H2
30
Figure 6. TPR-H2 profiles of α-Fe2O3, 5Au/Fe2O3_reference and Au/Fe2O3_DP catalysts
31
32
33
Figure 9. X-ray diffractograms of: (a) 1.5Au/Fe2O3_LPRD fresh (b) 1.5Au/Fe2O3_LPRD
34
Figure 10. X-ray diffractograms of: (a) 3Au/Fe2O3_DP fresh (b) 3Au/Fe2O3_DP used
35
Figure 11. HRTEM images of the (a) 5Au/Fe2O3_DP fresh (b) 5Au/Fe2O3_DP used
(c) 1.5Au/Fe2O3_LPRD fresh and (d) 1.5Au/Fe2O3_LPRD used.
(a) (b) (c) (d) Au Au Au Au 50 nm 50 nm 50 nm 50 nm
36
Figure 12. Gold particles size distribution in some fresh catalysts: (a) 1.5Au/Fe2O3_DP,
(b) 3Au/Fe2O3_DP, (c) 5Au/Fe2O3_DP, (d) 1.5Au/Fe2O3_LPRD, (e) 5Au/Fe2O3_LPRD,
37
Figure 13. Gold particles size distribution in some used catalysts: (a) 3Au/Fe2O3_DP, (b)
5Au/Fe2O3_DP and (c) 5Au/Fe2O3_LPRD, and (d) 3Au/Fe2O3_DP after stability test
38
Figure 14. Au 4f XPS spectra of (a) 3Au/Fe2O3_DP, (b) 5Au/Fe2O3_DIM and (c)
1.5Au/Fe2O3_LPRD catalysts. 92 91 90 89 88 87 86 85 84 83 82 81 80 Au3+ Au3+ Au+ Au+ Au0 Au0 Int en sity (u . a .) (c) (b)
Binding Energy (eV)
39
Figure 15. Carbon monoxide conversion vs. temperature for 5Au/Fe2O3_DP and other
catalysts reported in the literature (experimental conditions and details given in Table 1).