UNIVERSIDADE DE ÉVORA
Mestrado em Biologia da ConservaçãoDissertação
“Estratégias adaptativas de Cistus
a diferentes condições de secura e insolação”
Elsa Fonseca
Orientadora: Dr.ª Margarida Vaz
Coorientadores: Dr.ª Maria Paula Simões
Dr. Luiz Gazarini
2
UNIVERSIDADE DE ÉVORA
Mestrado em Biologia da Conservação
Dissertação
“Estratégias adaptativas de Cistus
a diferentes condições de secura e insolação”
Elsa Fonseca
Orientadora: Dr.ª Margarida Vaz
Coorientadores: Dr.ª Maria Paula Simões
Dr. Luiz Gazarini
3
A natureza é o único livro que oferece um conteúdo
valioso em todas as suas folhas.
Johann Goethe4
AGRADECIMENTOS
Agradeço,
Aos professores Dr.ª Margarida Vaz, Dr.ª Maria Paula Simões e Dr. Luiz Gazarini pela sempre pronta orientação, ajuda, disponibilidade e incentivo.
À comissão de curso do Mestrado em Biologia da Conservação por me ter fornecido as linhas diretrizes essenciais para a elaboração desta dissertação, pelo apoio e encaminhamento.
Ao ICAAM (Instituto de Ciências Agrárias e Ambientais Mediterrânicas) que financiou este estudo e ao Centro de Geofísica da Universidade de Évora pela cedência de dados.
Ao meu colega Ricardo Vivas pelas madrugadas, à Lúcia Monteiro, Inês Fernandes, Luísa Catarino, Ana Dias, Eliana Loureiro, Ricardo Leite, Ricardo Trippe e Estrela Matilde pela ajuda na colocação do material no campo e pela recolha de folhada tanto em dias de chuva como de muito calor e, que nunca desistiram de mim, mesmo na reta final aquando do meu estado de “hibernação” em modo de escrita.
Aos meus meninos Nike, Lili, Nico, Raizen, Taisen e Lopinhos pela boa energia que me transmitem. À minha, sempre, doce Tita…
E, naturalmente, à minha família, em especial à minha mãe pelo positivismo e no “amanhã vai ser melhor”, ao meu pai pelo “vício” da natureza, ao meu irmão pela determinação, à minha sobrinha e ao meu avô por aquele abraço tão bom que só eles sabem dar. São eles os meus alicerces, a minha fonte de motivação, inspiração e orgulho e a quem devo o que sou hoje. A eles dedico este trabalho.
A todos os que me acompanharam, apoiaram e contribuíram para a concretização deste meu objetivo, o meu…
5
ÍNDICE
A - ÍNDICE DE FIGURAS ... 6
B - ÍNDICE DE TABELAS ... 8
C - LISTA DE SÍMBOLOS E ABREVIATURAS ... 9
D - RESUMO ... 11
E - ABSTRACT ... 12
1 - INTRODUÇÃO GERAL ... 13
1.1 - Alterações climáticas previstas ... 14
1.2 - O montado ... 14
1.3 - Objetivos ... 16
1.4 - Plantas em estudo: Cistus ... 16
1.4.1 - Cistus ladanifer Linnaeus (1753)... 17
1.4.2 - Cistus monspeliensis Linnaeus (1753) ... 18
1.4.3 - Cistus populifolius Linnaeus (1753) ... 19
1.4.4 - Cistus psilosepalus Sweet (1826) ... 20
1.5 - Área de estudo ... 20
2 - ARTIGO CIENTÍFICO... 22
Abstract ... 22
Keywords ... 22
Introduction ... 23
Materials and methods ... 25
Results ... 30
Discussion ... 45
References ... 55
3- CONSIDERAÇÕES FINAIS ... 63
6
A - ÍNDICE DE FIGURAS
Introdução Geral
Figura 1. Cistus ladanifer L. (Detalhe das folhas à esquerda e da flor à direita)…...18
Figura 2. Cistus monspeliensis L………....19
Figura 3. Cistus populifolius L. (Detalhe das folhas à esquerda e da flor à direita)...19
Figura 4. Cistus psilosepalusSweet……….……...20
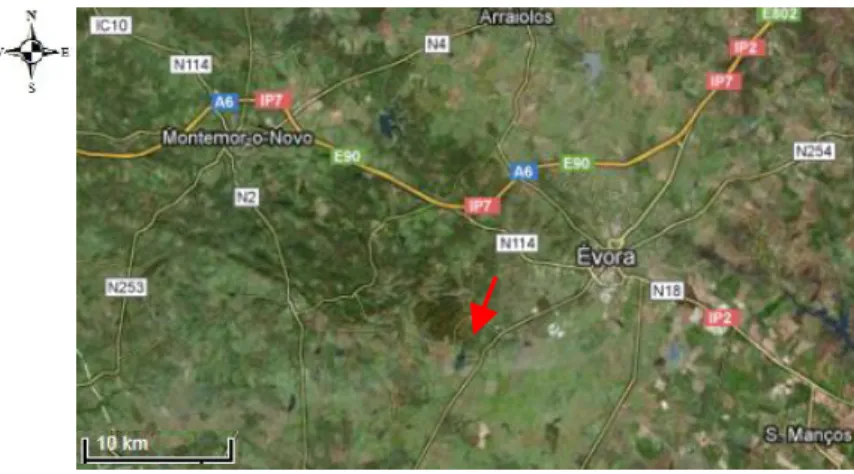
Figura 5. Localização da área de estudo à escala 1:10 (fonte: Google maps 2013)...21
Artigo científico
Figure 1. Climatological normals (CN) for 1971–2000 (T: average air temperature and R: total rainfall) for the study area……….…………..25Figure 2. (A) Average air temperature (T) and total rainfall (R); (B) Solar radiation (Rs) and vapour pressure deficit (VPD) in the study period (March–November 2012), by a meteorological station located in the study area………...…...……31
Figure 3. Phenological diagram of Cistus ladanifer (CLAD), C. monspeliensis (CMON), C. populifolius (CPOP) and C. psilosepalus (CPSI) for the study period (DBVG – dolichoblast vegetative growth; BBVG – brachyblast vegetative growth; FBF – flower bud formation; FL – flowering; FTS – fruit setting; LSDB – leaf shedding of dolichoblast; and LSBB – leaf shedding of brachyblast), from March to October 2012 (n=9 shoots).………....32
Figure 4. Accumulated leaf emergence (ALE) and accumulated leaf shedding (ALS) on dolichoblast (A), brachyblast (B), and the whole shoot (C) of Cistus ladanifer (CLAD), C. monspeliensis (CMON), C. populifolius (CPOP), and C. psilosepalus (CPSI), from March to October 2012. Means±SE are represented (n=9)……….……34
Figure 5. Soil water content (%) at 0–10 cm (A) and 10–20 cm (B) soil depths beneath shrub canopies of Cistus ladanifer (CLAD), C. monspeliensis (CMON), C. populifolius (CPOP), and C. psilosepalus (CPSI). Values are mean±SE (n=3). Means for the same date and depth followed by different letters are significantly different (P<0.05) ……….………...….35
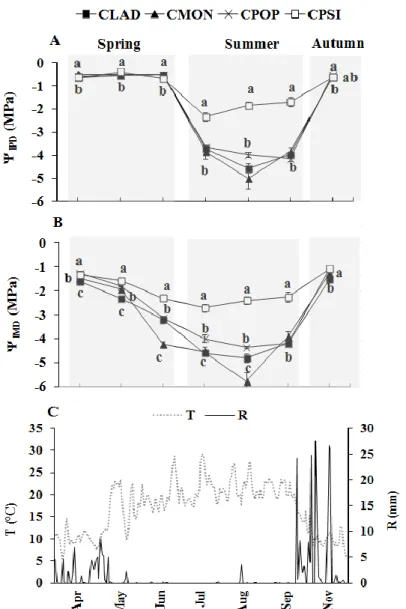
7 Figure 6. (A) Predawn leaf water potential (ΨlPD); (B) mid-day leaf water potential (ΨlMD) of Cistus ladanifer (CLAD), C. monspeliensis (CMON), C. populifolius (CPOP), and C. psilosepalus (CPSI), from April to November 2012; (C) daily air temperatures (T) and rainfall (R) for the same period. Values are mean±SE (n=12). Significant differences (P<0.05) between species are indicated by different letters………...36
Figure 7. (A) Stomatal conductance (gs), (B) photosynthetic rate (A), (C) transpiration rate (Tr) at environment conditions in Cistus ladanifer (CLAD), C. monspeliensis (CMON), C. populifolius (CPOP), and C. psilosepalus (CPSI) in spring, summer and autumn 2012. Values are mean±SE (n=24). Significant differences (P<0.05) between species are indicated by different letters………..38
Figure 8. Vapour pressure deficit based on leaf temp (VPDL) and maximum photosynthetic photon flux density (PPFDmax) at environment conditions (360 nm) in
Cistus ladanifer (CLAD), C. monspeliensis (CMON), C. populifolius (CPOP), and C. psilosepalus (CPSI) in spring, summer and autumn 2012. Values are mean±SE
(n=24)………..39
Figure 9. Assimilation rate (A) versus photosynthetic photon flux density (PPFD) curves in Cistus ladanifer (CLAD), C. monspeliensis (CMON), C. populifolius (CPOP), and C. psilosepalus (CPSI) in spring, summer and autumn 2012. Bars represent the standard error of the mean (n=24). R2 higher than 0.80………..………40
Figure 10. Seasonal variation of the specific leaf area (SLA) of Cistus ladanifer (CLAD), C. monspeliensis (CMON), C. populifolius (CPOP), and C. psilosepalus (CPSI). Means±SE are represented (n=40). Significant differences (P<0.05) between species are indicated by different letters……….…….41
Figure 11. Seasonal variation of leaf litter dry weight (g m-2) of Cistus ladanifer (CLAD), C. monspeliensis (CMON), C. populifolius (CPOP) and C. psilosepalus (CPSI), from March to October 2012. Each leaf litter value is the mean and bars represent the standard error of the mean (n=9)………42
Figure 12. Seasonal variation of N, P, K, Ca, Mg, and Mn concentrations (mg g-1) in leaf litter of Cistus ladanifer (CLAD), C. monspeliensis (CMON), C. populifolius (CPOP), and C. psilosepalus (CPSI), from March to October 2012………..………….45
8
B - ÍNDICE DE TABELAS
Table 1. Accumulated number of brachyblasts (BB) and leaves produced and shed on dolichoblast (DB), brachyblast, and whole shoot (WS), of Cistus ladanifer (CLAD), C.
monspeliensis (CMON), C. populifolius (CPOP), and C. psilosepalus (CPSI), from
March to October 2012………33
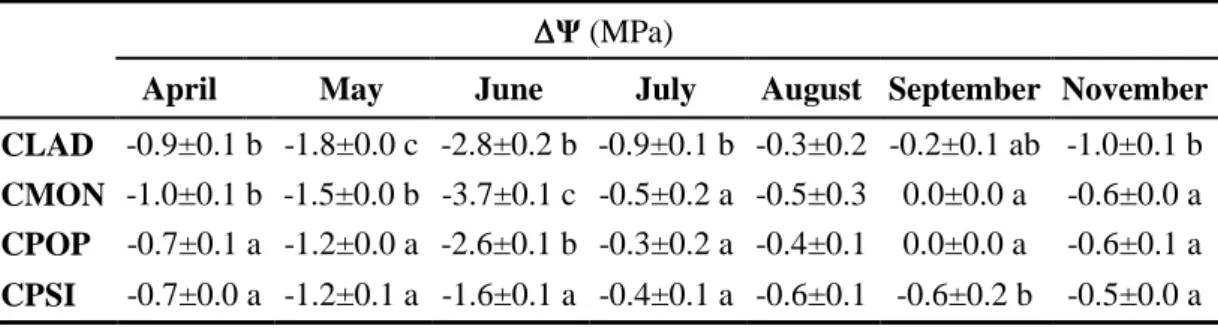
Table 2. Delta leaf water potential (Ψ, MPa) of Cistus ladanifer (CLAD), C.
monspeliensis (CMON), C. populifolius (CPOP), and C. psilosepalus (CPSI), from
April to November 2012………...………...…37
Table 3. Results of one-way ANOVA analysis for vapour pressure deficit based on leaf temp (VPDL, kPa) and maximum photosynthetic photon flux density (PPFDmax, µmol photons m-2 s-1) of Cistus ladanifer (CLAD), C. monspeliensis (CMON), C. populifolius (CPOP) and C. psilosepalus (CPSI), in spring, summer and autumn 2012………39
Table 4. Quantum yield (Φ, mol CO2 m-2 s-1/mol photons m-2 s-1), light-saturated photosynthesis (Amax, mol CO2 m-2 s-1) and dark respiration (Rdmol CO2 m-2 s-1) in
C. ladanifer (CLAD), C. populifolius (CPOP), C. monspeliensis (CMON) and C. psilosepalus (CPSI) in spring, summer and autumn 2012. ...40
Table 5. Leaf nitrogen concentration (N, mg g-1 and mg cm-2) in Cistus ladanifer (CLAD), C. monspeliensis (CMON), C. populifolius (CPOP) and C. psilosepalus (CPSI) in spring, summer and autumn 2012.………....…..…41
Table 6. Litterfall production (g m-2) of Cistus ladanifer (CLAD), C. monspeliensis (CMON), C. populifolius (CPOP), and C. psilosepalus (CPSI), from March to October 2012 (LLF - leaf litterfall; OLF - other litterfall; TLF - total litterfall)…………...……42
Table 7. Results of one-way ANOVA analysis for seasonal leaf litter production (g m-2) of Cistus ladanifer (CLAD), C. monspeliensis (CMON), C. populifolius (CPOP) and C.
psilosepalus (CPSI), from March to October 2012……….…………43
Table 8. Weighted mean nutrient concentrations in leaf litter of Cistus ladanifer (CLAD), C. monspeliensis (CMON), C. populifolius (CPOP), and C. psilosepalus (CPSI), from March to October 2012..………43
9
C - LISTA DE SÍMBOLOS E ABREVIATURAS
A - Photosynthetic rate (µmol CO2 m-2 s-1)
A/PPFD - Curves of photosynthetic response to photosynthetic photon flux density
ALE - Accumulated leaf emergence (ner) ALS - Accumulated leaf shedding (ner)
Amax -Light-saturated photosynthetic rate (µmol CO2 m-2 s-1) BB - Brachyblasts
Ca – Leaf Calcium concentration (mg g-1) CLAD - Cistus ladanifer L.
CMON - Cistus monspeliensis L. CN - Climatological normals CPOP - Cistus populifolius L. CPSI - Cistus psilosepalus Sweet DB - Dolichoblasts
gs - Stomatal conductance (mol m-2 s-1)
K –Leaf Potassium concentration (mg g-1) LLF - Leaf litterfall (g m-2)
Mg –Leaf Magnesium concentration (mg g-1) Mn – Leaf Manganese concentration (mg g-1)
N – Leaf nitrogen concentration (per area, mg cm-2, and per mass, mg g-1) OLF - Other litterfall (g m-2)
P - Leaf Phosphorus concentration (mg g-1)
PPFD - Photosynthetic photon flux density (μmol photons m-2 s-1)
PPFDmax - Maximum photosynthetic photon flux density (μmol photons m-2 s-1) R - Rainfall (mm)
10 Rs - Solar radiation (W m-2)
SE - Standard error
SLA - Specific leaf area (cm2 g-1) SWC - Soil water content (%) T - Average air temperature (ºC) TLF - Total litterfall (g m-2)
Tr - Transpiration rate (mmol H2O m-2 s-1) VPD - Vapour pressure deficit (kPa)
VPDL - Vapour pressure deficit based on leaf temp (kPa) WS - Whole shoot
Ψ - Delta leaf water potential (MPa)
Φ - Initial slope (quantum yield) (mol CO2 m-2 s-1/mol photons m-2 s-1) ΨlMD - Mid-day leaf water potential (MPa)
11
D - RESUMO
“Estratégias adaptativas de Cistus a diferentes
condições de secura e insolação”
Na região Mediterrânica, os efeitos das alterações climáticas esperam-se sob a forma de longos períodos de seca, em especial em ecossistemas como o montado. Em montados com baixa regeneração natural, os arbustos podem proporcionar a germinação e o crescimento das suas plântulas. De março a outubro de 2012, foram caracterizadas as estratégias feno-morfológicas e fisiológicas de Cistus ladanifer, Cistus
monspeliensis, Cistus populifolius e Cistus psilosepalus, através de medições
fenológicas, teor de água no solo, potenciais hídricos, trocas gasosas e concentração de nutrientes. Os resultados obtidos sugerem que as estratégias de C. ladanifer e C.
monspeliensis incluem mecanismos de tolerância à seca, C. psilosepalus de prevenção
e, os mecanismos de C. populifolius, parecem estar entre a prevenção e a tolerância. Entender essas estratégias e respostas à seca, poderá permitir prever as futuras comunidades de espécies em cenários de crescente secura e o estabelecimento de diretrizes na gestão do montado.
12
E - ABSTRACT
"Adaptive strategies of Cistus to different
conditions of drought and insolation"
In the Mediterranean region, the effects of climate change are expected in form of long periods of drought, particularly in ecosystems such as montado. In montados with low natural regeneration of their trees, shrubs may promote their seed germination and seedling growth. During March to October 2012, it was characterized the pheno-morphological and physiological strategies of Cistus ladanifer, Cistus monspeliensis,
Cistus populifolius and Cistus psilosepalus, by phenological, soil water content, water
potential, gas exchange and nutrient concentration measurements. The results suggest that the strategies of C. ladanifer and C. monspeliensis include drought-tolerance mechanisms, C. psilosepalus a drought avoidance mechanism and C. populifolius seem be in-between avoidance and tolerance. Understanding these strategies and responses to drought may be important for predicting future species assemblages in scenarios of increasing dryness and for laying down guidelines in montado management.
13
1 - INTRODUÇÃO GERAL
As plantas são uma componente fundamental dos ecossistemas, constituindo a sua estrutura física e, são de importância essencial para a o funcionamento da atmosfera do planeta (Bilz et al. 2011), influenciando expressivamente o clima e os recursos hídricos (Hamilton e Hamilton 2006).
O ritmo biológico das plantas, reflete a adaptabilidade das espécies em explorar condições ambientais favoráveis, de forma a obterem ganhos de carbono e alocar produtos resultantes da fotossíntese para o crescimento e a reprodução (Correia et al. 1992; Gratani e Crescente 1997). Uma variedade de padrões fenológicos evoluiu de forma a otimizar a adaptação à flutuação sazonal da disponibilidade de água (Simões et al. 2008) e de nutrientes do solo (Correia et al. 1992), particularmente em climas marcadamente sazonais, como o tipo Mediterrânico (Gill e Mahall 1986), onde os principais pulsos de disponibilização ocorrem no início da primavera e do outono (Simões 2003), sendo a seca uma restrição para o crescimento e a produtividade das espécies perenes (Gratani et al. 2006; Mooney et al. 1974).
Nesses ecossistemas, as plantas devem conseguir resistir a um verão longo, quente e seco, quando o défice hídrico está associado a elevadas intensidades de luz e temperaturas, que impõem restrições à assimilação de carbono (Faria et al. 1998; Chaves et al. 2002; Pereira et al. 2004, 2007), sendo os défices hídricos atenuados pelas chuvas de outono (Vaz et al. 2010).
As respostas da fotossíntese à redução da água do solo compreendem duas fases distintas: a primeira, caracterizada por uma diminuição da condutância estomática (Faria et al. 1998; Chaves et al. 2002, 2003; Centritto et al. 2003; Flexas et al. 2006, 2007) e uma diminuição da condutância no mesófilo (Flexas et al. 2006, 2007; Galmés et al. 2007a, 2007b) e, uma segunda fase, em que continuadas reduções da condutância estomática podem conduzir a prejuízos metabólicos (Flexas et al. 2006). Quando o stresse hídrico se desenvolve progressivamente ao longo de semanas ou meses, alterações bioquímicas na folha, que resultam numa diminuição da regulação do metabolismo fotossintético, podem ocorrer como resposta à redução de substratos de carbono (Chaves e Oliveira 2004; Flexas et al. 2007), causada pela restrição estomática (Vaz et al. 2010).
14 1.1 - Alterações climáticas previstas
Na Europa e, em especial na região mediterrânica, os efeitos das alterações climáticas prevêem-se sob a forma de aumento da temperatura média anual, redução da precipitação média anual, acentuação da mediterraneidade (sazonalidade climática) e, aumento da frequência de episódios de precipitação intensa e de períodos longos de seca. Prevê-se que as temperaturas médias aumentem 2–4 °C nos próximos 50 anos e causem alterações consideráveis nos padrões regionais e sazonais de precipitação (IPCC 2007).
No continente europeu, Thuiller et al. (2005) preveem que em 2080 as alterações climáticas resultarão numa perda de 27–42 % das espécies, com extremos potenciais variando de 2,5–86 % de perda da diversidade florística atual. Assim, a longo prazo, pensa-se que as alterações climáticas se tornem um fator expressivo que ameace as espécies vegetais. As alterações na temperatura e, mais importante a disponibilidade de água, poderão resultar em modificações na distribuição das espécies e das comunidades e numa forte pressão seletiva para mais genótipos com maior capacidade de adaptação (Maxted et al 2008). A água é um dos fatores mais limitantes para o crescimento das plantas em ambientes semiáridos e regula muitos processos ecológicos, não só devido à sua escassez, mas também por causa da sua variabilidade no espaço e no tempo e, pela imprevisibilidade das chuvas (Ehleringer et al 1999; Lázaro et al. 2001; Schwinning e Sala 2004; Sher et al. 2004).
Supõem-se que as alterações climáticas previstas venham a influenciar diretamente as relações planta-inseto que co-evoluíram (Harrington et al. 1999), e consequentemente a fenologia, o ciclo de vida, o crescimento e as taxas de desenvolvimento das plantas (Bornman e Teramura 1993), podendo desta forma resultar em alterações dramáticas na sua distribuição (Bale et al. 2002), nomeadamente, em ecossistemas muito particulares como o montado.
1.2 - O montado
O montado, enquanto ecossistema mediterrânico, encontra-se sob a influência de um clima húmido, com a precipitação concentrada no inverno, em que os meses mais quentes apresentam temperaturas médias superiores a 22 ºC (Pereira et al. 2009). Nas
15 regiões em que se situa este ecossistema a variabilidade inter-anual da precipitação é elevada, apresentando um coeficiente de variação da ordem dos 30 % para o Alentejo, traduzindo-se na ocorrência frequente de secas, especialmente nas regiões mais a Sul (Pereira e Paulo 2004). Por outro lado, a repartição da precipitação e da evapotranspiração potencial ao longo do ano apresentam características marcadamente sazonais (Pereira et al. 2009).
Os montados encontram-se seriamente ameaçados pelo pouco cuidado que tem sido dedicado à regeneração natural de sobreiros e azinheiras. Em Portugal, os povoamentos denotam uma idade avançada, uma menor densidade devida à intensidade das práticas agrícolas e a uma incidência preocupante de pragas e doenças. As práticas agrícolas e a condução dos animais em pastoreio que se têm desenvolvido nos montados não são adequadas aos processos de dispersão, estabelecimento de jovens plantas e ao seu desenvolvimento até árvores adultas. Em montados mais densos, o pastoreio pode até ter efeitos benéficos no vigor da recuperação do arvoredo, pela remoção da vegetação herbácea e de algum mato potenciadores de incêndios. Noutros casos, dever-se-á excluir o pastoreio durante períodos variáveis, em função da espécie pecuária e da situação de partida, ou conciliar os matos com o pastoreio, de forma a permitir a germinação das bolotas e proceder posteriormente à proteção dos renovos (Pereira et al. 2009).
Sendo o montado um ecossistema com elevado número de árvores adultas, comparativamente à sua taxa de regeneração, a manutenção e gestão dos arbustos são de grande importância, uma vez proporcionarem um microclima e um substrato vegetal favorável às plântulas que ocorram sob as suas copas. Desta forma, torna-se relevante determinar quais os arbustos a manter, tendo em conta a sua eficiência e os que s supõe melhor resistirem às alterações climáticas previstas, como o aumento da temperatura do ar e da seca na região Mediterrânica (Miranda et al. 2002). Assim, tornam-se necessários mais estudos acerca de onde e, porque motivos, determinadas espécies poderão prevalecer sobre outras (Simões et al. 2008).
16 1.3 - Objetivos
A presente dissertação, apresentada sob a forma de artigo científico e a submeter a uma revista indexada ao sistema ISI web of knowledge, tem como objetivo caracterizar as estratégias feno-morfológicas e fisiológicas subjacentes ao crescimento e sobrevivência de quatro espécies de Cistus, Cistus ladanifer L., C. monspeliensis L., C. populifolius L. e C. psilosepalus Sweet, que coocorrem nas atuais condições de seca no Mediterrâneo. Entender essas estratégias e respostas à seca, pode ser importante para prever as futuras comunidades de espécies em cenários de crescente secura e o estabelecimento de diretrizes na gestão do montado. Para o efeito, foram efetuadas medições fenológicas, de teor de água no solo, potencial hídrico foliar, medições de trocas gasosas foliares e análise de curvas de resposta à luz, área foliar específica, quantificação de folhada e concentração de nutrientes.
1.4 - Plantas em estudo: Cistus
Na Bacia do Mediterrâneo, a vegetação nativa é caracterizada por um matagal denso com espécies anuais, de folha caduca e semi-decídua, tolerantes à seca e por espécies esclerófilas lenhosas perenes (Mooney e Dunn 1970). Espécies esclerófilas estão adaptadas à baixa disponibilidade de água durante o verão, por meio de folhas pequenas, coriáceas e escuras cobertas por pequenas e grossas cutículas (Read e Sanson 2003). Pequenas folhas e área foliar específica reduzida têm sido vistas como adaptações ao clima do tipo Mediterrânico em muitas espécies de plantas perenes (Ackerly 2004).
Componentes arbustivas significativas nos ecossistemas Mediterrânicos pertencem à família Cistaceae, sendo o género Cistus um dos mais característicos, particularmente predominantes em matagais (Carlier et al. 2008). A maioria dos Cistus têm uma vida útil relativamente curta (10–20 anos), apesar de Cistus ladanifer L. ter maior longevidade, com uma vida útil de 30–50 anos (Arianotsou-Faraggitaki e Margaris 1982; Roy e Sonie 1992; Patón et al. 1998).
Para além da sua importância ecológica, este género inclui espécies que produzem metabolitos com importância económica e/ou têm grande potencial para aplicações industriais ou medicinais (Carlier et al. 2008). Arbustos Cistus melhoraram os níveis
17 hídricos, de nutrientes, taxas de assimilação de carbono e de crescimento, criando condições microclimáticas e propriedades físico-químicas no solo para as plântulas que ocorrem sob as suas copas (Armas e Pugnaire 2005). Além disso, a sombra destas plantas reduz as amplitudes térmicas e a evaporação da água do solo (Domingo et al. 1999), podendo ainda facilitar a germinação de sementes e o crescimento de plântulas. A sombra proporcionada também reduz o stresse térmico e a transpiração das plantas de sub-bosque, protegendo-os da foto-inibição (Nobel 1980; Fuentes et al. 1984; Vetaas 1992; Moro et al. 1997).
A conservação e a gestão, nomeadamente dos matos são, assim, fundamentais para uma redução da erosão dos solos, devido à acumulação de matéria orgânica por parte destes (Andreu et al. 1998). Os matos proporcionam regeneração natural de árvores e sobrevivência de plântulas que ocorrem sob a proteção da cobertura arbustiva (Plieninger et al. 2003, 2004), assim como promovem biodiversidade, constituindo um habitat para muitas espécies (Simões et al. 2009).
Arbustos como Cistus podem, desta forma, ser associados não apenas a estágios de sucessão regressiva mas, também, à regeneração e a estágios de sucessão progressiva secundária. Manchas de solo sob a copa de arbustos podem ser importantes locais sumidouros de nutrientes que influenciam a estrutura da comunidade. Desta forma, a manutenção do estrato arbustivo pode promover o desenvolvimento de espécies mais exigentes uma vez que, áreas de elevada fertilidade, são suscetíveis de serem locais privilegiados para a regeneração da vegetação (Simões et al. 2009).
1.4.1 - Cistus ladanifer Linnaeus (1753)
C. ladanifer ocorre no sul da França, na metade ocidental da Península Ibérica e no
norte de África (Marrocos e Argélia). É uma espécie de clima quente e seco, com invernos chuvosos e ocorre em solos siliciosos (Castroviejo et al. 1993). Frequentemente, é a única espécie lenhosa a resistir no matagal tipicamente seco, em solos ácidos e pobres em nutrientes (Carlier et al. 2008). Desenvolve-se a uma altitude ente os (0) 300–1000 (1500) m (Guzmán et al. 2009) e, em termos de condições de insolação, é uma espécie subheliofila (Dansereau 1958), predominando em florestas degradadas de Quercus suber/ilex (Guzmán et al. 2009). As suas folhas possuem uma
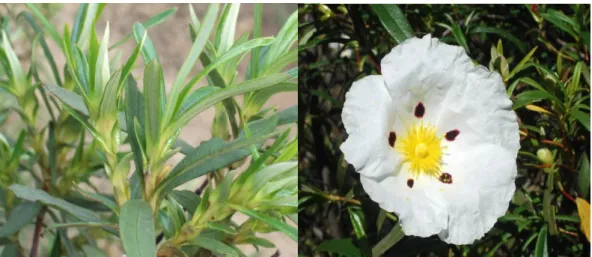
18 forma linear-lanceolada (Figura 1) de comprimento entre os 40–80 mm e de largura 6– 21 mm (Guzmán et al. 2009). As suas folhas são de margem plana, venação pinada e de superfície lisa e textura coriácea (Guzmán et al. 2009).
C. ladanifer tem sido utilizada na região Mediterrânica desde a antiguidade (Deforce
2006) pela sua produção de resina aromática, o labdanum, cuja secreção é de cerca de 12,5 % (Gülz et al 1996).
Figura 1. Cistus ladanifer L. (Detalhe das folhas à esquerda e da flor à direita).
1.4.2 - Cistus monspeliensis Linnaeus (1753)
C. monspeliensis ocorre na região mediterrânica, Madeira e Tenerife e, assim como C. ladanifer, é uma espécie de clima quente e seco, e de invernos chuvosos (Castroviejo et
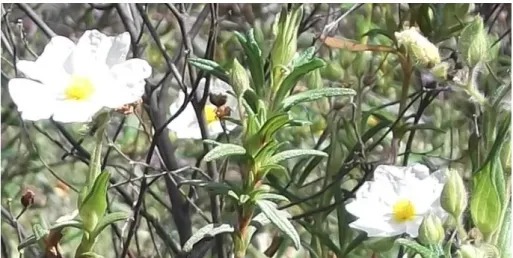
al. 1993) e ocorre em solos siliciosos (Guzmán et al. 2009). É uma espécie arbustiva de pequeno porte, semi-decídua de verão com dimorfismo foliar entre o verão e o inverno (Correia et al. 1992; de Lillis e Fontanella 1992). Desenvolve-se a uma altitude ente os 0–800 (1200) m (Guzmán et al. 2009) é uma espécie subheliofila (Dansereau 1958), predominando em florestas degradadas de Quercus suber/ilex e de Pinus (Guzmán et al. 2009). As suas folhas possuem uma forma linear-lanceolada (Figura 2) de comprimento entre os 15–45 mm e de largura 2–7 mm (Guzmán et al. 2009). As suas folhas são de margem plana ligeiramente revolutosa, venação paralela e de superfície lisa e textura coriácea (Guzmán et al. 2009). A secreção de labdanum, ronda os 10,7% (Gülz et al 1996).
19
Figura 2. Cistus monspeliensis L.
1.4.3 - Cistus populifolius Linnaeus (1753)
C. populifolius está restrito à Península Ibérica e Narbonne, Aude (França) (Castroviejo
et al. 1993). É de clima seco (Guzmán et al. 2009), mas, em termos de condições de insolação, é uma espécie submesófila (Dansereau 1958), ocorrendo em locais mais sombrios e barrancos frescos (Castroviejo et al. 1993). Desenvolve-se em solos siliciosos (Guzmán et al. 2009), é uma espécie calcífuga (Castroviejo et al. 1993) e ocorre numa altitude entre 200–1500 m (Guzmán et al. 2009) em florestas degradadas de Quercus e Pinus (Guzmán et al. 2009). As suas folhas possuem uma forma ovado-lanceoladas (Figura 3) de comprimento entre os 50–95 mm e de largura 25–55 mm (Guzmán et al. 2009). De margem plana e venação pinada, as suas folhas possuem uma superfície lisa de textura coriácea (Guzmán et al. 2009). A secreção de labdanum, ronda os 5,6 % (Gülz et al 1996).
20 1.4.4 - Cistus psilosepalusSweet (1826)
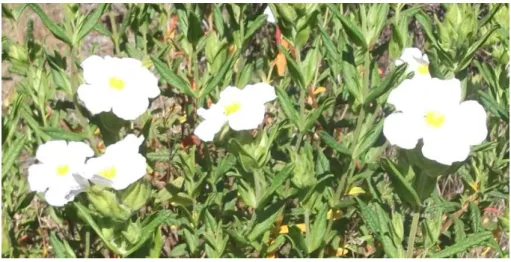
C. psilosepalus ocorre a N, NW e W da Península Ibérica. É uma espécie de climas húmidos e de zonas de influência oceânica e de verões secos (Castroviejo et al. 1993) e, é uma espécie submesófila (Dansereau 1958). Ocorre sobre solos siliciosos (Guzmán et al. 2009) sendo, tal como C. populifolius, uma espécie calcífuga (Castroviejo et al. 1993). Pode ser encontrado a uma altitude entre 0–800 (1100) m em matagais (Guzmán et al. 2009). As suas folhas possuem uma forma lanceolado-elíptica (Figura 4) de comprimento entre os 30–65 mm e de largura 10–23 mm (Guzmán et al. 2009). Estas são de margem plana, venação reticulada e de superfície lisa e textura macia (Guzmán et al. 2009). A secreção de labdanum, é de apenas 2,0 % (Gülz et al 1996).
Figura 4. Cistus psilosepalus Sweet.
1.5 - Área de estudo
O estudo foi realizado no sul de Portugal, perto de Évora, (38○ 32’ N; 8○ 01’ W; 240 m de altitude), em ambiente de montado, onde o clima é tipicamente mediterrânico, com invernos húmidos e verões secos (Simões et al. 2009). A média da quantidade de precipitação total é 609,4 milímetros, a temperatura média anual é de 15,9 º C (normais climatológicas para 1971–2000) e, o período seco pode durar até cinco meses (Simões et al. 2008).
Em termos da tipologia bioclimática, a área de estudo encontra-se no macroclima mediterrâneo (Rivas-Martínez et al. 2004), apresentando um período seco bem definido, nos meses de verão, com precipitação inferior ao dobro da temperatura, em pelo menos
21 dois meses do ano (Capelo 1996). O bioclima é Mesomediterrânico Pluviestacional oceânico (Rivas-Martínez et al. 2004).
Biogeograficamente localiza-se no Reino Holárctico, Região Mediterrânica, Subregião Mediterrânica Ocidental, Província Mediterrânica Ibérica Ocidental, Sub-província Luso-Extremadurense, Sector Marianico-Monchiquense, Subsector Araceno-Pacense e Distrito Alentejano (Costa et al. 1998; Rivas-Martínez et al. 2002).
A paisagem é suavemente ondulada, com inclinações variando entre os 3 e os 8% e o substrato geológico consiste em granitos e gnaisses (Carvalhosa et al. 1969). Os solos são de origem granítica e correspondem a Leptossolos e Cambissolos Quartzosos (WRB 2006), com uma textura de argila-arenosa a areia-argilosa (Driessen et al., 2001).
22
2 - ARTIGO CIENTÍFICO
Plant/Leaf traits and adaptive strategies of Cistus species to
Mediterranean drought and insolation
E. Fonseca, M. Vaz1,2, M.P. Simões1, L. Gazarini1
1 Instituto de Ciências Agrárias e Ambientais Mediterrânicas (ICAAM)/Dep. Biologia, Universidade de
Évora, Apartado 94, 7002-554 Évora, Portugal
2
Corresponding author (mvaz@uevora.pt)
Abstract
In the Mediterranean region, the effects of climate change are expected in the form of increase in mean annual temperature, mean annual precipitation decreased and long periods of drought, particularly in very specific ecosystems such as montado. The
montados are seriously threatened by the reduced attention that has been dedicated to
natural regeneration and shrubs may promote their seed germination and seedling growth. In this context, it was characterized, during March to October 2012, the pheno-morphological and physiological strategies of Cistus ladanifer, Cistus monspeliensis,
Cistus populifolius and Cistus psilosepalus, by phenological, soil water content, water
potential, gas exchange, specific leaf area, litterfall and nutrient concentration measurements. The results suggest that the strategies of C. ladanifer and C.
monspeliensis include drought-tolerance mechanisms, C. psilosepalus a drought
avoidance mechanism and C. populifolius seem be in-between avoidance and tolerance. It seems that the diversity of Cistus may decrease in scenarios of dryness and C.
ladanifer and, in particularly, C. monspeliensis, among the studied species, will be
dominant shrub species. Understanding these strategies and responses to drought may be important for predicting future species assemblages in scenarios of increasing dryness and for laying down guidelines in montado management.
Keywords: Cistus, Curves photosynthesis light, Drought, Leaf water potential, Mediterranean
23 Introduction
In Europe, and especially in the Mediterranean region, the effects of climate change are expected in the form of increase in mean annual temperature, mean annual precipitation decreased, accentuation of mediterraneaty (climatic seasonality) and increased frequency of episodes of intense precipitation and long periods of drought. An increase of 2–4 °C in average temperatures is predicted in the next 50 years, with considerable changes in the patterns of regional and seasonal precipitation (IPCC 2007). Changes in temperature and, more importantly, in the availability of water, may result in changes in the distribution of species and communities and in a strong selective pressure for more genotypes with greater adaptability (Maxted et al 2008). It is assumed that the expected climate change will directly affect plant-insect associations that co-evolved (Harrington et al. 1999), phenology, life cycle, growth and plant development rates (Bornman & Teramura 1993), which can result in dramatic consequences in their distribution (Bale et al. 2002), particularly in very specific ecosystems such as montado. The montado, while Mediterranean ecosystem, is under the influence of a humid climate, with rainfall concentrated in the winter, in which the warmer months present mean temperatures above 22 ºC (Pereira et al. 2009). In regions where this ecosystem is situated the inter-annual variability of rainfall is high, with a variation coefficient in the order of 30 % for the Alentejo, resulting in frequent occurrence of droughts, especially in the southern regions (Pereira & Paulo 2004). Moreover, the distribution of precipitation and potential evapotranspiration throughout the year also has markedly seasonal features (Gill & Mahall 1986; Pereira et al. 2009) with the main pulses release occurring in early-spring and -autumn (Simões 2003). Drought is a primary constraint for growth and productivity of perennial species (Gratani et al. 2006; Mooney et al. 1974) and a variety of phenological patterns occurs to optimise adaptation to the seasonal fluctuation of water availability (Simões et al. 2008) and soil nutrients (Correia et al. 1992).
In these ecosystems, plants should resist to a long, hot and dry summer, when the water deficit is associated with high light intensities and temperatures by imposing restrictions on carbon assimilation (Faria et al. 1998; Chaves et al. 2002; Pereira et al. 2004, 2007). Water deficits are alleviated by the autumn rains (Vaz et al. 2010). The responses of photosynthesis to soil water depletion comprise two distinct phases: a first stage characterized by a decrease in stomatal conductance (Faria et al. 1998; Chaves et
24 al. 2002, 2003; Centritto et al. 2003; Flexas et al. 2006, 2007) and decrease in mesophyll conductance (Flexas et al. 2006, 2007; Galmés et al. 2007a, 2007b) and a second stage in which further decreases in stomatal conductance may coincide with metabolic impairment (Flexas et al. 2006). When water stress develops gradually over periods comprising weeks or months, changes in leaf biochemistry that result in the downregulation of photosynthetic metabolism may occur in response to lowered carbon substrates (Chaves & Oliveira 2004, Flexas et al. 2007), caused by stomatal restriction (Vaz et al. 2010).
Significant components shrub in Mediterranean ecosystems belongs to the Cistaceae family, in which Cistus is one of the most characteristic genera (Carlier et al. 2008). Conservation and management of shrubs are fundamental to prevent soil erosion due to accumulation of organic material produced (Andreu et al. 1998) and improved water and nutrients levels, carbon assimilation rates and growth, creating microclimatic conditions and physico-chemical properties in the soil of seedlings that occur under their canopies (Armas & Pugnaire 2005). Furthermore, the shadow reduces the thermal amplitudes of these plants and evaporation of soil water (Domingo et al. 1999), and may also facilitate seed germination and seedling growth. The shade provided also reduces heat stress and plant transpiration from the understory, protecting them from photo-inhibition (Nobel 1980; Fuentes et al. 1984; Vetaas 1992; Moro et al. 1997). Shrubs as
Cistus may be associated not only with stages of retrogressive succession, but also with
stages of secondary progressive succession. Soil patches observed beneath shrub canopies may be important local nutrient sinks that influence community structure. Therefore, shrub development may promote the invasion of more demanding species, since local areas of high fertility are likely to be favoured sites for vegetation regeneration (Simões et al. 2009).
The montados are seriously threatened by the reduced of natural regeneration of cork and holm oaks (Quercus suber and Quercus rotundifolia). Montados denote an advanced age, a lower density due to the intensity of farming practices and an increasing incidence of pests and diseases. Since the montado is an ecosystem with large numbers of mature trees, compared to its rate of regeneration, the maintenance and management of shrubs are of major importance, since they provide a microclimate and a favorable vegetal substrate to plant seedlings that occur under their canopies. Thus, it becomes relevant to determine which shrubs to maintain, taking into account its efficiency and which species are expected better resist to the expected climate change.
25 In this context, it was compared, under the same constraints of climate, the life strategies of Cistus ladanifer L., C. monspeliensis L., C. populifolius L. and C.
psilosepalus Sweet, in order to determine their potential ability to adapt and survive to
the climate change expected for the Mediterranean region. Our main objective was to characterize the pheno-morphological and physiological strategies underlying growth and survival of four co-occuring Cistus species in current Mediterranean drought conditions. Understanding these strategies and responses to drought may be important for predicting future species assemblages in scenarios of increasing dryness and for laying down guidelines in montado management.
Materials and methods
Study area
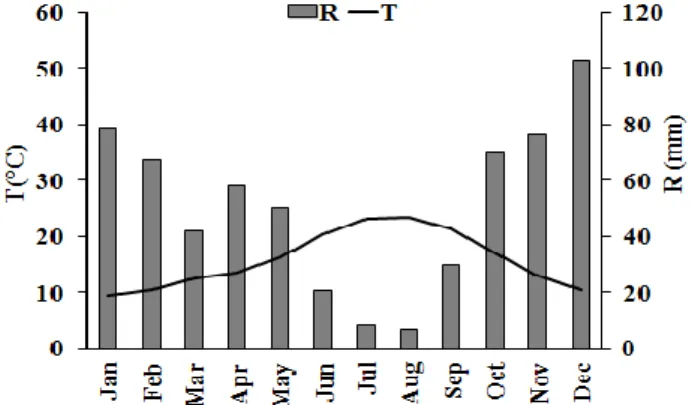
The study was carried out in southern Portugal, close to Évora, (38○ 32’ N; 8○ 01’ W; 240 m a.s.l.), in an environment of montado. The area has the typical winter-wet, summer dry pattern of the Mediterranean-type climate. Mean annual rainfall is 609.4 mm and mean annual temperature is 15.9 ○C (Climatological normals for 1971-2000, Figure 1), and the dry period lasts up to five months (Simões et al. 2008).
In terms of bioclimatic approach (Rivas-Martínez et al. 2004), it is located in the MesoMediterranean, lower dry to subhumid belt of the Mediterranean pluviseasonal-oceanic bioclimate and biogeographically stands as the Lusitan-Extremadurean Province (Marianic-Monchiquensean Sector) of the Mediterranean region. The landscape is gently undulating with slopes varying from 3 to 8 % and the geological substratum consists of granites and gneisses (Carvalhosa et al. 1969). The soils are developed from granites and correspond to dystric Leptosols and dystric Cambisols (WRB 2006), with loam sandy to sandy loam texture (Driessen et al. 2001).
Figure 1. Climatological normals (CN) for 1971–2000 (T: average air temperature and R: total
26
Study species
Cistus ladanifer L. (hereafter CLAD), C. monspeliensis L. (hereafter CMON), C. populifolius L. (hereafter CPOP), and C. psilosepalus Sweet (hereafter CPSI) are shrubs
that typically occur under Mediterranean conditions. CLAD occurs in the western Mediterranean region, from Portugal and Morocco to the Côte d'Azur and Algeria; CMON in the Mediterranean region (halfway S and around the Mediterranean coast and the Balearic Islands), Madeira and Tenerife; CPOP is restricted to the Iberian Peninsula, Narbonne (Aude, France) and N Morocco; and CPSI to N, NW and W of the Iberian Peninsula. Although the four species usually inhabit regions with Mediterranean climate, where they have to endure a hot and dry summer, in terms of insolation CLAD and CMON are subheliophyllous species, while CPOP is mostly found in fresh and shadowy places and CPSI in conditions of high relative humidity and oceanic influence, both species being submesophyllous. They all occur in siliceous soils, and CPOP and CPSI are even calcifugous species. CLAD grows at altitudes between 300–1000 m, CMON and CPSI between 0–800 m and CPOP between 200–1500 m. CLAD predominates in degraded Quercus woodlands and CMON and CPOP in degraded Pinus woodlands, while CPSI is mainly found in shrublands. The four species produce long shoots or dolichoblasts (DB), and shoots characterized by much reduced internode lengths, or brachyblasts (BB), developed at the axils of DB leaves. Previous-year BB can differentiate into DB. In the present study, we consider DB as those branches longer than 3 cm and BB as those shorter than 3 cm. CLAD and CMON have coriaceous linear-lanceolate leaves (length x width: 40–80 x 6–21 mm in CLAD and 15–45 x 2–7 mm in CMON), while those of CPOP are coriaceous ovate-lanceolate (50–95 x 25–55 mm) and those of CPSI are soft and lanceolate-elliptic (30–65 x 10–23 mm). Labdanum secretion in CLAD, CMON, CPOP and CPSI is 12.5 %, 10.7 %, 5.6 % e 2.0 %, respectively (Dansereau 1958; Castroviejo et al. 1993; Gülz et al 1996).
Meteorological data
A weather station was installed in the study area for measurements of solar radiation (Rs) with a albedometer, CM7B, Germany, dry and wet bulb temperatures with a hygro-Thermo Transmitter, Germany and rainfall (R) with a tipping Bucket Rain Gauge, 52203, USA). Data were recorded as 1 hour means with a CR10 data logger (Campbell
27 Scientific, Utah, USA). Air vapour pressure deficit (VPD) was calculated from dry and wet bulb temperatures.
Phenological measurements
Observations and measurements were carried out during March–October 2012, on nine randomly selected shrubs per species. For phenological measurements the distinction between dolichoblasts and temporary brachyblasts proposed by Orshan (1989) was used. On 28 February, one apparently healthy dolichoblast in each individual shrub was labeled, for repeated non-destructive measurements. Different positions and exposures were taken in consideration. Since the start of the study did not coincide with the beginning of the growing season, labeling was performed at the level of a node that appeared to have begun growth in the current growing season so that all newly formed organs could be included in monitoring. Leaf emergence and shedding, brachyblast formation and shedding, flower bud formation, flowering and fruiting setting were monitored. All newly formed and shed organs were counted separately for dolichoblasts and brachyblasts. Monthly observations are considered to give a fair indication of phenology but fortnightly observations are recommended when possible Fournier & Charpantier (1975). Since both growth and phenophase shift are reported to occur faster in spring for most Cistus species (Pereira et al. 1987; Correia et al. 1992; Gratani & Crescente 1997; Castro-Díez & Montserrat-Martí 1998; Simões et al. 2008), sampling was conducted fortnightly from March to May and monthly from June to October.
Soil water content
The soil water content (SWC) was determined by the gravimetric method (Rundel & Jarrell 1989), in April, June, September, and October 2012. In each sampling date, three soil samples were collected beneath three individuals of each study species, at 0–10 and 10–20 cm soil depth. Samples were weighed to obtain wet soil mass, dried (105 °C during 48 h), and weighed again to obtain dry soil mass.
28
Leaf water potential
Predawn and mid-day (just before sunrise and around midday solar time, respectively) leaf water potential (ΨlPD, ΨlMD) was measured on a monthly basis, from April to November 2012, with a Scholander pressure chamber (PMS 1000, PMS Instruments, Corvallis, USA). A total of twelve leaves were sampled for specie (3 leaves for each shrub in 4 shrubs). It was calculated delta leaf water potential (Ψ=ΨlPD -ΨlMDAt midday solar time, samples were taken in the south-facing side of the crown and at similar heights aboveground to avoid variability caused by hydrostatic water potential and immediately placed in a plastic bag to prevent further transpiration.
Leaf gas exchange measurements and micro-environmental conditions
Gas exchange measurements in environmental conditions were done with a portable steady-state photosynthetic system (Li-6400; Li-Cor, Lincoln, NE) in three seasons of 2012: spring (a pre-drought period, April-May), final summer (a drought period, August-September) and autumn (an after drought period, October-November) on fully expanded leaves from the current-year spring flushing. Photosynthetic rate (A), and stomatal conductance (gs), transpiration rate (Tr) and vapour pressure deficit based on leaf temp (VPDL) under natural environmental conditions were measured in the morning periods (9.00h-10.00h). Leaf temperature (Lt) and photosynthetic photon flux density (PPFD) incident on the leaf surface were, respectively, measured with a 6400-04 leaf temperature thermocouple and a 9901-013 external quantum sensor coupled to an infrared gas exchange analyser (IRGA) (Li-6400, Li-Cor Inc., Lincoln, Nebraska, USA). The accuracy and reliability of both sensors were tested previously.
Curves of photosynthetic response to photosynthetic photon flux density (A/PPFD) were realized in the same three seasons in eight leaves of each shrubs (three shrubs of each species). The A/PPFD curves were conducted under a CO2 concentration of 360 ppm, leaf temperature of around 25 ± 2 °C. The light intensity provided with a 6400-02B LED source with red and blue LEDs (665 and 470 nm, respectively), was decreasing from 2000, 1500, 1000, 500, 200, 100, 50 and 0 μmol photons m−2 s−1. The leaves were allowed to equilibrate for 10 min before logging data in A/PPFD curves. These measurements were completed during the morning to avoid the midday depression of photosynthesis and stomatal conductance.
29
Specific leaf area
To assess the specific leaf area (SLA) of leaves monitored for measurements, leaf area was measured using imaging software (Image J, 1.32 J, USA Institutes of National Health) and leaf weight was measured after drying at 70 ºC until stable weight.
Litterfall
Litterfall was assessed using litter traps (1.5 mm mesh screen with 80 x 80 cm2 collecting surface) placed under shrub canopies, elevated ca. 6 cm above the ground. Shrubs (nine per species) and litter collecting dates (fortnightly, from March to May 2012, and monthly during the remaining study period) were those used for phenological measurements. Litterfall collections were sorted into leaves and other components. After drying (80 ○C), leaf litterfall and other litterfall were weighed. Leaf litterfall samples were pooled resulting in one sample per species and month, and a subsample was taken for chemical analysis.
Nutrient concentrations
Samples of leaves used for gas exchange measurements and of leaf litter were dried and ground to pass through a 0.5 mm mesh screen. Nitrogen in both green leaves and leaf litter was determined using Kjeldhal digestion (Digestion System 40, Kjeltec Auto 1030 Analyzer). The C amount was calculated assuming an average 50 % C content of ash-free mass. The mineral elements (P, K, Ca, Mg and Mn) in leaf litter were determined after ashing (6 hr at 450 ○C) and taken up in HCl. K, Ca, Mg and Mn were determined by atomic absorption spectrophotometry. Concentration of P was measured colorimetrically following the method described by Watanabe & Olsen (1965).
Data analysis
Soil water content (SWC) was determined by the equation SWC (%) = [(mass of wet soil - mass of dry soil) / mass of dry soil] * 100. Delta leaf water potential (Ψ was calculated by Ψ = ΨlMD - ΨlPD and specific leaf area (SLA) was determined by the equation SLA = fresh leaf area/leaf dry weight.
30 For the analysis of photosynthetic responses to light, leaf photosynthesis (A) versus PPFD curves were fitted with Sigma Plot 11.0 for Windows by nonlinear regression as hyperbolic equations (Harley et al. 1986): A = ΦPPFD /
√
(1+Φ2 PPFD2/A2max) - Rd where A is the net photosynthetic rate, PPFD is the incident photon flux density, Amax is the light-saturated photosynthetic rate, Rd is the rate of respiration in the light, exclusive of photorespiration, and Φ is the initial slope (quantum yield). The parameters Φ andAmax were obtained from eight curves of three shrubs of each species. Apparent quantum yield (Ф) was estimated as the initial slopes of the A/PPFD.
All statistical analyses were performed using the SPSS software package (Statistical Package for the Social Sciences for Windows, Version 20.0, Chicago, IL, USA). One-way analysis of variance (ANOVA) was used to test the differences between means. Significant differences (P=0.05) between means of SWC, Ψ, Φ, Amax and Rd were evaluated with Fisher’s Least Significant Difference (LSD). Significant differences (P=0.05) between means of leaf gas exchange (gs, A and Tr), phenological measurements, litterfall production and nutrient concentrations in leaf litter were evaluated with Tukey test. Some data were transformed (natural log) for homogeneity of variances and, when it was not obtained, nonparametric Kruskal Wallis tests were used, as in vapour pressure deficit based on leaf temp (VPDL), maximum photosynthetic photon flux density (PPFDmax)and specific leaf area (SLA), and in a few data on soil water content and leaf water potential. All measurements are shown as means±SE. Correlations between leaf litterfall mass and nutrient concentrations were determined by the Pearson correlation coefficient.
Results
Meteorological data
Figure 2A shows the monthly values of average air temperatures (T) and rainfall (R) from March to November 2012, recorded for the study area. In spring, (March-May) rainfall values were around 40–60 mm per month and rainfall reached its minimum in summer (July) with 0.3 mm. In autumn, (October and November) rainfall were 87.9 mm and 149.5 mm respectively. Spring was dryer than CN (fig. 1) whereas autumn was wetter than CN. Monthly average air temperature ranged from 9.8 ºC in April and
31 November to 21.6 ºC in August. Solar radiation (Rs) (Figure 2B) reached its maximum in July (349.6 Wm-2) and the maximum vapour pressure deficit (VPD) occurred in August (1.3 kPa). The minimum value of solar radiation and vapour pressure deficit was 90.4 Wm-2 and 0.3 kPa, respectively, in November.
Phenological measurements
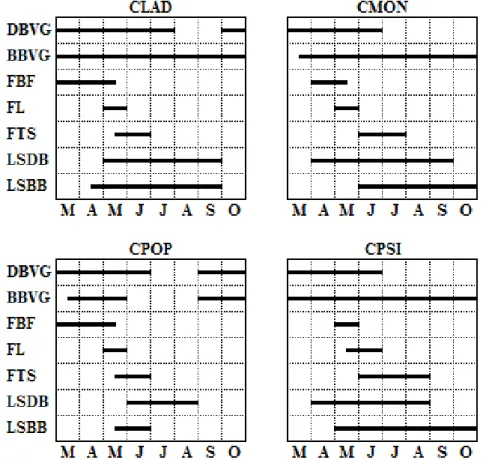
Some differences were observed between the phenological cycles of the four studied species (Figure 3). Leaf production in CLAD, CMON and CPSI was an almost continuous process, mainly in brachyblast that displayed leaves all year round. Dolichoblast vegetative growth occurred during a longer period in CLAD and CPOP (suspended during August and September, and July and August, respectively) than in CMON and CPSI (suspended from July to October). CPOP showed the shortest period for brachyblast growth. Flower buds developed in CLAD and CPOP from March to mid-May, in CMON from April to mid-May, and CPSI in May. Flowering of CLAD, CMON, and CPOP occurred in May and that of CPSI from mid-May to June. Fruit setting began immediately after anthesis. Leaf shedding from CMON and CLAD
Figure 2. (A) Average air temperature (T) and total rainfall (R); (B) Solar radiation (Rs) and vapour pressure deficit (VPD) in the study period (March–November 2012), by a meteorological station located in the study area.
32 dolichoblast started in April and May, respectively, and finished in September, in those of CPSI occurred from April to August, and in CPOP from June to August. Leaf shedding from brachyblasts occurred from mid-April to September in CLAD, and started in May for CPSI and in June for CMON, respectively, and continued until October, and in CPOP occurred only from mid-May to June.
Figure 3. Phenological diagram of Cistus ladanifer (CLAD), C. monspeliensis (CMON), C.
populifolius (CPOP) and C. psilosepalus (CPSI) for the study period (DBVG – dolichoblast vegetative growth; BBVG – brachyblast vegetative growth; FBF – flower bud formation; FL – flowering; FTS – fruit setting; LSDB – leaf shedding of dolichoblast; and LSBB – leaf shedding of brachyblast), from March to October 2012 (n=9 shoots).
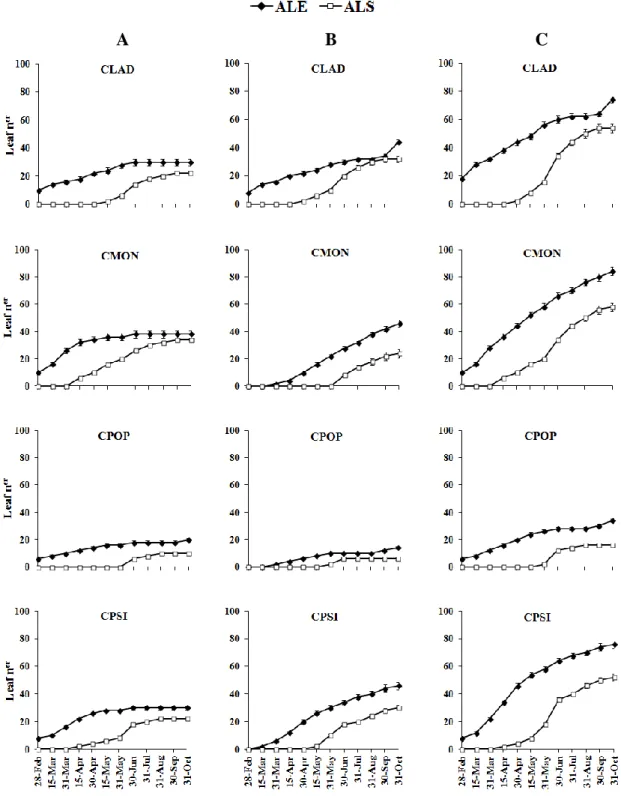
Accumulated leaf production throughout the study period (Figure 4) shows that the number of leaves emerged on CLAD, CMON, and CPSI dolichoblast stabilized from the end of June until the end of the study period and that of leaf shedding stabilized from August for CPSI and September for CLAD and CMON. Leaf production by CLAD brachyblast stabilized between July and September, with a further increase in October, after the first autumn rains. Leaf emergence from CMON and CPSI brachyblast was continuous. Leaf shedding from CLAD, CMON, and CPSI brachyblast increased in June, but while stabilization was observed in CLAD by September,
33 shedding was still taking place at the end of the study period for CMON and CPSI. Leaf emergence and shedding on both dolichoblast and brachyblast of CPOP was low, but slight increases were observed for leaf emergence in October, after the first autumn rains, and for leaf shedding in June.
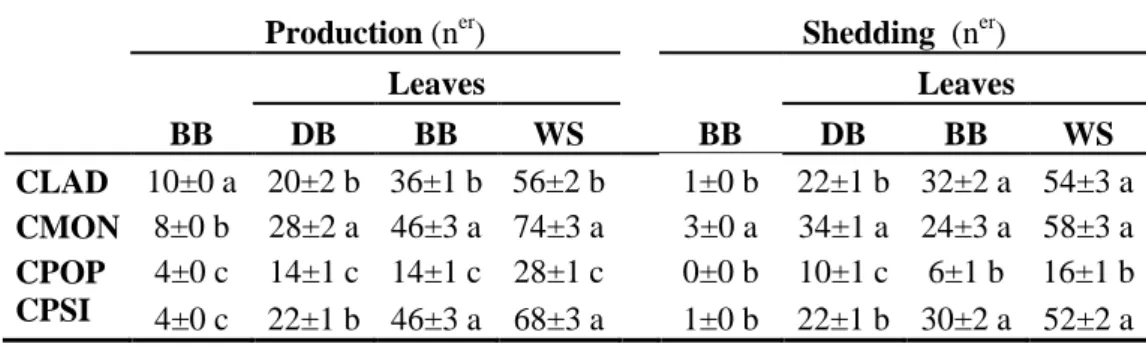
The number of both emerged and shed leaves on dolichoblast was significantly greater for CMON than for CLAD and CPSI (Figure 4 and Table 1). Leaf production by brachyblast and by the whole shoot was higher for CMON and CPSI than for CLAD, but the number of leaves shed by these species brachyblast did not differ significantly. The lowest leaf emergence and shedding values were observed in CPOP dolichoblasts and brachyblasts. CLAD showed the highest brachyblast production and CPOP and CPSI showed the lowest (Table 1). Brachyblast shedding was significantly higher in CMON than in the other three species, which did not differed significantly.
Production (ner) Shedding (ner) BB Leaves Leaves DB BB WS BB DB BB WS CLAD 10±0 a 20±2 b 36±1 b 56±2 b 1±0 b 22±1 b 32±2 a 54±3 a CMON 8±0 b 28±2 a 46±3 a 74±3 a 3±0 a 34±1 a 24±3 a 58±3 a CPOP 4±0 c 14±1 c 14±1 c 28±1 c 0±0 b 10±1 c 6±1 b 16±1 b CPSI 4±0 c 22±1 b 46±3 a 68±3 a 1±0 b 22±1 b 30±2 a 52±2 a
Values are mean±SE (n=9). Significant differences (P<0.05) between species are indicated by different letters.
Table 1. Accumulated number of brachyblasts (BB) and leaves produced and shed on
dolichoblast (DB), brachyblast, and whole shoot (WS), of Cistus ladanifer (CLAD), C. monspeliensis (CMON), C. populifolius (CPOP), and C. psilosepalus (CPSI), from March to October 2012.
34
Soil water content
In the overall, soil water content was higher in April and October and lower in June and September for both 0–10 cm (Figure 5A) and 10–20 cm (Figure 5B) soil depths. It
A B C
Figure 4. Accumulated leaf emergence (ALE) and accumulated leaf shedding (ALS) on
dolichoblast (A), brachyblast (B), and the whole shoot (C) of Cistus ladanifer (CLAD), C. monspeliensis (CMON), C. populifolius (CPOP), and C. psilosepalus (CPSI), from March to October 2012. Means±SE are represented (n=9).
35 should however be underlined that, excepting for values recorded for the 10–20 cm depth in October, soil water content was significantly higher (P<0.05) in both depths beneath CPOP than beneath the other three species, including in the drought period. In contrast, a trend to lower water content was observed in soil under CLAD canopies, in both soil depths, throughout the whole study period. Significant differences were not found beneath CMON and CPSI. It should also be emphasized that, unlike under CLAD, CMON, and CPSI, water content in the 10–20 cm soil depth under CPOP did not suffer a pronounced decrease during the dry season and, on the other hand, did not recover immediately after the first autumn rains.
Leaf water potential
Predawn leaf water potential (ΨlPD) (Figure 6A) in all Cistus species remained high and approximately constant during spring (April to middle of June), between -0.4 MPa and -0.7 MPa related with the rainy season (Figure 6C). As rain is scarce, ΨlPD started to decline and reached lower values in mid and late summer. ΨlPD in CPSI was lower in
Figure 5. Soil water content (%) at 0–10 cm (A) and 10–20 cm (B) soil depths beneath shrub
canopies of Cistus ladanifer (CLAD), C. monspeliensis (CMON), C. populifolius (CPOP), and C. psilosepalus (CPSI). Values are mean±SE (n=3). Means for the same date and depth followed by different letters are significantly different (P<0.05).
36 July (-2.3 MPa), for CLAD and CMON in August (-4.6 and -5.0 MPa, respectively) and for CPOP in September (-4.2 MPa). There was a statistically significant difference (P<0.05) in ΨlPD particularly marked in July, August and September, where ΨlPD was higher in CPSI than in CPOP, CLAD and CMON. After autumn rains, ΨlPD recoveredto spring values in all species. The mid-day leaf water potential (ΨlMD) followed the same patterns as ΨlPD. Thus, ΨlMD was lower during the drought period. For CPSI, ΨlMD was -2.7 MPa in July and in August for CPOP, CLAD and CMON were -4.4, -4.8 and -5.8 MPa, respectively (Figure 6B). CPSI had a mid-day leaf water potential (ΨlMD) statistically higher (P<0.05) than the other three species. Delta leaf water potential (Ψ) (Table 2) was generally higher in all species in rainy season and warm days and was reduced during drought period. At end of summer (September) Ψ was higher in CPSI than in other species (although not significant).
C
Figure 6. (A) Predawn leaf water potential (ΨlPD); (B) mid-day leaf water potential (ΨlMD) of Cistus ladanifer (CLAD), C. monspeliensis (CMON), C. populifolius (CPOP), and C. psilosepalus (CPSI), from April to November 2012; (C) daily air temperatures (T) and rainfall (R) for the same period. Values are mean±SE (n=12). Significant differences (P<0.05) between species are indicated by different letters.
37
Ψ (MPa)
April May June July August September November CLAD -0.9±0.1 b -1.8±0.0 c -2.8±0.2 b -0.9±0.1 b -0.3±0.2 -0.2±0.1 ab -1.0±0.1 b CMON -1.0±0.1 b -1.5±0.0 b -3.7±0.1 c -0.5±0.2 a -0.5±0.3 0.0±0.0 a -0.6±0.0 a
CPOP -0.7±0.1 a -1.2±0.0 a -2.6±0.1 b -0.3±0.2 a -0.4±0.1 0.0±0.0 a -0.6±0.1 a
CPSI -0.7±0.0 a -1.2±0.1 a -1.6±0.1 a -0.4±0.1 a -0.6±0.1 -0.6±0.2 b -0.5±0.0 a
Leaf gas exchange and micro-environmental conditions
Stomatal conductance in environmental conditions (gs) (Figure 7A) and carbon assimilation rate (A) (Figure 7B) in all Cistus species were higher in spring, in sunny days in which photosynthetic photon flux (PPFDmax) was around 1000 mol photons m-2 s-1 and vapour pressure deficit (VPD) around 2.5 kPa, and then, both gs and A decrease in summer drought. In autumn, a recovery in gs and A occurred but not for the spring values in all species as PPFD and VPD were lower in this season in relation to spring. However, some inter-specific variations in these physiological parameters were observed. Thus, gs in spring was significantly higher (P<0.001) in CLAD and CPSI (0.455 and 0.535 mol H2O m-2 s-1, respectively) and significantly lower in CMON (0,021 mol H2O m-2 s-1) and CPOP (0.088 mol H2O m-2 s-1). In summer, there was no significant difference between the four species and gs was around 0.0025 mol H2O m-2 s-1. In autumn, CPSI (0.272 mol H2O m-2 s-1) was significantly higher and CPOP (0.124 mol H2O m-2 s-1) was significantly lower than CMON and CLAD (0.166 and 0.203 mol H2O m-2 s-1, respectively). Photosynthetic rate (A, Figure 5B) in spring was significantly higher (P<0.001) in CPSI and CLAD (32.15 and 40.68 μmol CO2 m-2 s-1, respectively) and significantly lower in CMON (3.41 μmol CO2 m-2 s-1) and CPOP (12.68 μmol CO2 m-2 s-1). In summer, there were no significant differences between the four species. In autumn CPOP was significantly lower than CMON, CLAD and CPSI. In spring, transpiration rate (Tr) (Figure 7C) was significantly higher (P<0.001) in CLAD and CPSI (5.21 and 7.60 mmol H2O m-2 s-1, respectively) and significantly lower in CMON (0.49 mmol H2O m-2 s-1) and in CPOP (1.52 mmol H2O m-2 s-1). In summer there were no significant differences between the four species. Values in autumn were significantly higher in CLAD and CPSI (2.91 and 3.80 mmol H2O m-2 s-1, respectively) than CPOP Values are mean±SE (n=12). Significant differences (P<0.05) between species are indicated by different letters.
Table 2. Delta leaf water potential (Ψ, MPa) of Cistus ladanifer (CLAD), C. monspeliensis
38 (1.90 mmol H2O m-2 s-1). There were no significant differences between CMON and the other three species. Micro-environmental conditions at leaf level, namely PPFDmax, in spring and in summer were similar (P>0.001) for CLAD, CMON and CPSI (1200-1525 μmol m-2
s-1)but significantly higher than CPOP (694-875 μmol m-2 s-1). In autumn, values were significantly higher in CMON and in CPSI (1255 and 1367 μmol m-2 s-1, respectively) and significantly lower in CPOP (158 μmol m-2 s-1) and in CLAD (753 μmol m-2
s-1). Vapour pressure deficit (Figure 8) in spring and in autumn, had no significant differences between the four species. In summer values in CLAD (3.00 kPa) were significantly higher (P<0.001, Table 3) than in CPSI (2.89 kPa) and in CMON (2.69 kPa). CPOP had the lowest values (2.34 kPa). There were no significant differences between CPSI and CMON and the other two species.
Figure 7. (A) Stomatal conductance (gs), (B) photosynthetic rate (A), (C) transpiration rate
(Tr) at environment conditions in Cistus ladanifer (CLAD), C. monspeliensis (CMON), C. populifolius (CPOP), and C. psilosepalus (CPSI) in spring, summer and autumn 2012. Values are mean±SE (n=24). Significant differences (P<0.05) between species are indicated by different letters.
39
VPDL (kPa) PPFDmax (µmol photons m
-2 s-1)
Spring Summer Autumn Spring Summer Autumn
CLAD a a a a a b
CMON a ab a a a a
CPOP a b a b b c
CPSI a ab a a a a
Analysis of photosynthetic responses to light
The Amax (maximum assimilation rate, estimated from the A/PPFD curves in light-saturated and ambient CO2 concentrations) was lower (P<0.001) in summer than spring and autumn in all Cistus species (Figure 9, Table 4). Under optimal environmental conditions (spring and autumn) CLAD and CPSI had higher Amax than CMON and CPOP, but similar quantum yield (Φ) and respiration in dark (Rd). However, during summer, Amax was low in all species, and lightly lower in CLAD.
Significant differences (P<0.05) between species in each date are indicated by different letters (n=24).
Figure 8. Vapour pressure deficit based on leaf temp (VPDL) and maximum photosynthetic photon flux density (PPFDmax) at environment conditions (360 nm) in Cistus ladanifer (CLAD), C. monspeliensis (CMON), C. populifolius (CPOP), and C. psilosepalus (CPSI) in spring, summer and autumn 2012. Values are mean±SE (n=24).
Table 3. Results of one-way ANOVA analysis for vapour pressure deficit based on leaf temp
(VPDL, kPa) and maximum photosynthetic photon flux density (PPFDmax, µmol photons m-2 s-1) of Cistus ladanifer (CLAD), C. monspeliensis (CMON), C. populifolius (CPOP) and C. psilosepalus (CPSI), in spring, summer and autumn 2012.
40
Spring Summer Autumn Ф (mol CO2 m-2 s-1/mol photons m-2 s-1)
CLAD 0.09±0.01b 0.02±0.01c 0.10±0.03b
CMON 0.11±0.01 b 0.03±0.04c 0.08±0.02 b
CPOP 0.15±0.01a 0.06±0.01b 0.10±0.03b
CPSI 0.13±0.01a 0.18±0.02 a 0.14±0.02 a
Amax (mol CO2 m-2 s-1)
CLAD 36.55±0.76 b 1.49±0.40 b 27.85±2.17 a CMON 8.80±0.17c 3.10±0.89 a 20.59±0.99b CPOP 10.18±0.85 c 3.15±0.19a 15.39±1.13 c CPSI 42.34±4.50a 2.99±0.78a 21.33±1.64b Rd (mol CO2 m -2 s-1) CLAD 2.87±0.44 b 0.45±0.37 c 3.17±1.62 a CMON 2.44±0.16 b 2.30±0.80 a 3.14±0.77 a CPOP 1.56±0.77 c 1.09±0.17 b 1.52±0.98 b CPSI 3.15±0.34 a 2.33±0.76 a 1.58±1.44 b
Values are mean±SE (n=24). Significant differences (P<0.05) between species are indicate by different letters.
Figure 9. Assimilation rate (A) versus photosynthetic photon flux density (PPFD) curves in Cistus ladanifer (CLAD), C. monspeliensis (CMON), C. populifolius (CPOP), and C. psilosepalus (CPSI) in spring, summer and autumn 2012. Bars represent the standard error of the mean (n=24). R2 higher than 0.80.
Table 4. Quantum yield (Φ, mol CO2 m-2 s-1/mol photons m-2 s-1), light-saturated photosynthesis (Amax, mol CO2 m-2 s-1) and dark respiration (Rdmol CO2 m-2 s-1) in C. ladanifer (CLAD), C. populifolius (CPOP), C. monspeliensis (CMON) and C. psilosepalus (CPSI) in spring, summer and autumn 2012.