Design and Optimization of a Wing Structure for a
UAS Class I 145 kg
By: João Jorge Miguel da Silva
AlfAl / EngAer /137735-D
A thesis to obtain the Master Degree in
Military Science
Aeronautical Engeneering
Examination Committee:
Chairperson:
Cor/EngAer Fernando António Bento de Oliveira
Supervisor:
Prof. Dr. Virgínia Isabel Monteiro Nabais Infante
Co-Supervisor:
Maj/EngAer Diogo Xufre de Sousa Duarte
Members of the Committee:
Prof. Dr. Rui Miguel Barreiros Rúben
Sintra, July 2017
ACADEMIA DA FORÇA AÉREA
iii
“Necessity is the mother of invention”
- Proverb -
v
Dedicatória
Aos meus Pais por toda a educação que me deram, pelos sacrifícios que fizeram e pelo apoio e motivação constantes.
À minha Irmã por toda a amizade, apoio e companhia, e a quem desejo um grande futuro. À minha Tia Ilda porque sem ela não teria chegado onde cheguei.
À minha Avó Francisca que na sua sabedoria muito me ensinou. Ao meu Tio António pelo inabalável apoio moral.
Aos Quasares pelas alegrias e tribulações que me ajudaram a crescer.
Ao meu camarada Pedro Perestrelo pela amizade, companhia e grande apoio ao longo da Academia. À minha camarada Marta Santos pela amizade, paciência e imprescindível ajuda ao longo destes últimos 6 anos.
vii
Acknowledgements
The completion of this thesis would not have been possible without the help and the support of many people to whom I would like to show my gratitude:
I thank Major Diogo Duarte for allowing me to develop such a demanding topic / project and for his help and patience during the critical moments.
I thank Professora Virgínia Infante for always being available and especially for the precious help with the determination of the material’s properties.
I thank Capitão João Caetano for all the support and guidance and also for his promptness to take care of urgent matters.
I thank the Doctoring Student Mário Vieira for this invaluable help with the data acquisition during the testing of the material’s specimens.
I thank Sargento Ajudante Paulo Mendes for all his help concerning the use of equipment and materials at the CIDIFA and for this availability and willingness to discuss and exchange ideas regarding manufacturing processes.
I thank Major Aurélio Santos for all the help concerning the use of equipment at the CIDIFA. I thank the students from Fórmula Student, especially Bogdan for his availability and tutoring on how to use the FEA software HyperMesh.
I thank Major Carlos Silva for having clarified some doubts about wing structural design practices. I thank Capitão Bruno Serrano for his availability and willingness to teach how to work with the AFA’s destructive testing machine.
I thank Capitão Luís Félix for providing information concerning other thesis and data concerning composite materials.
Last but not least, I also thank CapitãoDinis Paiva, Tenente Sara Monte and Alferes Marta Santos for making their thesis available.
ix
Resumo
No contexto do poder aéreo à escala Gobal, sistemas aéreos não tripulados (UAS) apresentam-se como uma necessidade actual e futura, razão pela qual, fazem parte não só da visão estratégica da Força Aérea Portuguesa (FAP) mas também da Estratégia Nacional para o Mar 2013-2020.
Desde 2008 que a FAP tem vindo a desenvolver UAS cada vez mais capazes e, actualmente, algumas das suas plataformas experimentais encontram-se já em utilização em contextos operacionais tanto nacionais como internacionais.
Por forma a expandir essa utilização, de forma segura e responsável, para missões de busca e vigilânica sobre a vasta área sob a jurisdição de Portugal, existe a necessidade de contruir novas plataformas capazes de dar resposta a todos os requesitos operacionais e de aeronavegabilidade e de estabelecer procedimentos para a uma eventual produção em larga escala das mesmas.
Perante estas necessidades, a presente tese de mestrado consiste no design e otimização da estrutura da asa de uma nova plataforma operacional com um peso máximo à descolagem de 145 kg (UAS class I). Paralelamente ao emprego operacional, esta plataforma desempenhará também, o papel funamental de modelo de teste – à escala reduzida - de um UAS de grandes dimensões (class II), actualmente em devenvolvimento por um consórcio entre a FAP, empreas nacionais e o Ministério da Defesa Nacional (MDN).
O processo de design e otimização da asa involveu a determinação das forças a actuar sobre a estrutura (definição do envelope de voo da aeronave e identificação da situação correspondente ao carregamento crítico da asa), o planeamento da geometria geral e da disposição de compoentes, a escolha de materiais (compósitos - fabrico de provetes e determinação das suas propriedades experimentalmente) e, posteriormente, definição da geometria, dimensionamento e otimização dos vários componentes por forma a garantir a robustez estrutural da asa com o mínimo de massa e custos, possível.
Todas as desisões de design foram fundamentadas com base em regulamentos (entre eles, o NATO STANAG AEP-83), manuais de design estrutural, livros e artigos científicos, por foma a garantir a certificação da estrutura em termos de aeronavegabilidade.
O processo de otimização utilizado / criado - “chain top-down approach” - mostrou-se simples e eficaz e consistiu numa otimização individual mas interligada, de cada componente, seguindo uma sequência hierárquica, de acordo com a importância estrutural de cada um.
Todos os modelos geométricos produzidos (3D) e todas as análises estruturais efectuadas (análises numéricas através da discretização da estrutura em elementos finitos - FEA), foram realizados com recurso ao software SolidWorks 2016 x64 Edition.
O modelo final obtido, satisfas todos os requisitos estruturais (capaz de suportar entre -1.5 a 4 G’s com deslocamento da ponta da asa < 5% do comprimento de meia envergadura), requisitos operacionais (em cada meia-asa, capaz de suportar payload suspenso ≤ 10 kg) e de peso (massa < 26.2 kg), e apresenta um custo de produção, em termos de materiais, de cerca de 3000 €.
Palavras Chave: Poder aéreo, FAP, UAS class I, design estrutural de asa, otimização estrutural,
xi
Abstract
In the context of air power in a Global scale, unmanned aerial systems (UAS) are a present and future necessity, reason why, they are part of the Portuguese Air Force (FAP) strategic vision and part of the Portuguese National Strategy for the Sea 2013-2020.
Since 2008 the FAP has been developing UAS ever more capable and, nowadays, some of its experimental platforms are already being used operationally, both nationally and internationally.
In order to expand their use, in a safe and responsible manner, for search and surveillance missions over the vast area under Portugal’s jurisdiction, there is the necessity to manufacture new platforms capable of fulfilling all the operational and airworthiness requirements and to establish procedures for their eventual mass production.
In light of these necessities, the present master’s thesis consists of the design and optimization of the structure of the wing of a new operational platform with a maximum take-off weight of 145 kg (UAS class I). Parallelly to the operational use, this platform will also play the fundamental role of being the test model – at a reduced scale – for a large UAS (class II), currently in development by a consortium between the FAP, national companies and the Portuguese National Ministry of Defense (MDN).
The wing design and optimization process, involved determining the loads acting on the structure (definition of the aircraft’s flight envelope and identification of the wing’s critical loading condition), planning the general shape and components layout, choosing materials (composites – manufacturing of specimens and experimental testing to obtain their properties), and then, shaping, sizing and optimizing its many components to give every part just enough strength without excess weight and also to reduce costs.
All design decision were fundamented based on regulations (e.g. the NATO STANAG AEP-83), structural design manuals, books and scientific articles, in order to guarantee the certification of the structure in terms of airworthiness.
The optimization process used / created – “chain top-down approach” – proved to be simple and effective and consisted in an individual but interconnected optimization, of each component, following a hierarchical sequence, in accordance with the structural importance of each one.
All the geometric models produced (3D) and all the structural analysis performed (numerical analysis resorting to the discretization of the structure using finite elements – FEA), were achieved by using the software SolidWorks 2016 x64 Edition.
The final wing model obtained, fulfilled every structural requisite (capable of enduring between -1.5 and 4 G’s with a wing tip displacement < 5% of half-wing span), operational requisite (capable of carrying up to 10 kg of suspended payload from each half-wing), and weight requisite (mass < 26.2 kg), with a manufacturing cost, in terms of materials, close to 3000 €.
xiii
Table of Contents
Dedicatória... v Acknowledgements ... vii Resumo ... ix Abstract ... xiList of Figures ... xvii
List of Tables ... xxi
List of Acronyms ...xxiii
List of Symbols ... xxv 1 Introduction ... 1 1.1 Framework ...1 1.2 Objectives ...4 1.2.1 Primary ...4 1.2.2 Secondary ...4 1.3 Conditions / Restrictions ...4 1.4 Thesis Structure ...4
1.5 Design and Optimization of Aircraft Structures - State of the Art ...5
2 Wing External Geometry ... 7
2.1 Geometric Parameters Definition ...7
2.2 Wing External Geometry Modeling ...7
3 Forces Acting on the Wing ... 9
3.1 Aircraft Loads Overview ...9
3.1.1 Surface Forces - Aerodynamic Loads ...9
3.1.2 Body Forces – Weight and Inertial Loads ... 11
3.1.3 Wing Loads ... 12
3.2 Wing Critical Loading Condition ... 12
3.2.1 Aircraft Flight Envelope ... 12
3.2.1.1 Aerodynamic Load Factor ... 13
3.2.1.2 V-n Diagram ... 13
3.2.1.3 Gust Diagram ... 15
3.2.1.4 Combined Flight Envelope ... 16
3.2.2 Wing Loading Conditions ... 17
3.2.2.1 Wing Critical Loading Condition Identification ... 17
3.2.3 Wing Critical Loading Condition Characterization ... 18
3.2.3.1 Flight Condition ... 18
3.2.3.2 Loads Identification ... 18
3.2.3.3 Loads Characterization ... 21
4 Wing Structural Design ... 29
4.1 Materials ... 29
xiv
4.2 Solid Mechanics... 30
4.2.1 Stress, Strain and Poisson’s ratio ... 30
4.2.2 Stress-Strain Relation: Hook’s Law ... 30
4.2.3 Plastic Deformation ... 31
4.2.4 Failure ... 31
4.2.5 Fatigue ... 32
4.3 Wing Structural Components and Considerations ... 32
4.3.1 Spars ... 32
4.3.2 Ribs ... 33
4.3.3 Skin ... 33
4.3.4 Stringers ... 33
4.3.5 Other Skin Stiffening Methods ... 33
4.4 Ailerons and Flaps... 34
4.5 Wing Design Recommendations and Guidelines ... 35
4.5.1 Holes and Access Panels ... 35
4.5.1.1 Holes / Cut-outs Reinforcement Solutions ... 38
4.5.1.2 Delamination when Drilling / Cutting laminates ... 38
4.6 Wing Structure Initial Model ... 39
4.6.1 Materials Selection and Properties Definition ... 39
4.6.1.1 Experimental Procedures and Data Acquisition ... 44
4.6.1.2 Data analysis / Important Remarks ... 49
4.6.2 Design... 50
5 Wing Structure Analysis and Optimization ... 55
5.1 Finite Element Analysis (FEA) ... 55
5.2 Initial Model Structural Analysis... 55
5.2.1 Geometric Model Simplification ... 56
5.2.2 Material Attribution ... 57
5.2.3 Mesh Definition and Mapping ... 59
5.2.4 Boundary conditions ... 60
5.2.5 Forces and Moments ... 61
5.2.6 Structural Analysis ... 63
5.3 Wing Structure Optimization ... 65
5.3.1 Step 1 ... 67
5.3.2 Step 2 ... 71
5.3.3 Step 3 ... 72
5.3.4 Step 4 ... 73
6 Wing Final Design including Flaps and Ailerons ... 77
6.1 Wing Final Design and Weight and Cost Estimation ... 77
6.2 Wing Final Design, Characteristics Summary ... 78
xv
6.2.2 Other Loading Conditions that the Structure Can Endure ... 84
7 Conclusions and Future Work ... 85
7.1 Conclusions ... 85 7.2 Future work ... 85 References ... 87 Annexes ... 91 Annex 1 ... 91 Annex 2 ... 92 Annex 3 ... 92 Annex 4 ... 92 Annex 5 ... 93 Annex 6 ... 96 Annex 7 ... 99 Annex 8 ... 100 Annex 9 ... 100 Annex 10 ... 100
xvii
List of Figures
Figure 1 - Airspace, Water and Land areas under Portugal’s responsibility and/or jurisdiction: Green: Land area (mainland Portugal, Archipelago of Madeira and Archipelago of Azores); Yellow: Economic Exclusive Zone (EEZ) (1.66 million km2 [3]); White: Proposal to extend the limits of the continental shelf (3.6 million km2 [3]); Red: Airspace under Portugal responsibility which coincides with the Search and Rescue Region (SRR) of responsibility (5.8 million km2, divided into two Flight Information Regions (FIR) – Santa
Maria and Lisbon [1]). ...1
Figure 2 – a) The project’s Patch with its moto “ET OBSERVA VOLANT” [9]; b) ANTEX-X02 Alfa, UAS with maximum take of weight (MTOW) of 25 kg [11]; c) UAS30, with MTOW of 30 kg [12]; d) ANTEX-X03, with MTOW of 149 kg [13]. ...2
Figure 3 – Example of topological optimization process [20]. ...6
Figure 4 – Half-wing top view. ...8
Figure 5 – Half-wing side view (root). ...8
Figure 6 – a) Typical force and moment resultants for a flying aircraft; b) Typical non-uniform lift distribution [24]. ...9
Figure 7 – a) Airfoil Shape Parameters [18]; b) Aerodynamic Force Resultants on an Airfoil [25]. ... 10
Figure 8 - a) Pressure Distribution on airfoil; b) Transference of Lift and Drag loads to Aerodynamic Center [24]. ... 10
Figure 9 - Symmetrical and asymmetrical spanwise lift distributions [18]... 11
Figure 10 – a) Forces on an aircraft at three points in loop. Dynamic Conditions of Accelerated Motion [18]; b) Equivalent set of Static Conditions. ... 11
Figure 11 - Superposition of V-n and V-g diagrams. ... 16
Figure 12 - Typical combined flight envelope [25]. ... 16
Figure 13 - Limit wing loading conditions as defined by the aircraft flight envelope [31]... 17
Figure 14 - Stress response as a function of the angle of attack [31]. ... 17
Figure 15 - Average of two lift distributions using Schrenk's approximation [23]. ... 21
Figure 16 - Lift distribution on half-wing. ... 23
Figure 17 - Pitching moment at 0.28 chord, caused by Lift. ... 26
Figure 18 - Body Forces acting perpendicularly to the half-wing. ... 27
Figure 19 – Stress – Strain curve for a ductile material [40]. ... 31
Figure 20 – a) Comparison between the Stress-Strain curves of different materials [41]; b) Stress-Strain curves for different fibers and for epoxy resin, allowing to compare typical stress and strain failure values [42]. ... 31
Figure 21 – a) Foam core; b) Corrugated core; c) Honeycomb core [44]. ... 34
Figure 22 - Sandwich laminate material advantages [45]. ... 34
Figure 23 – Detail: corrugated fuselage and wing skins of a Junkers J-52 3M (WWII aircraft) [46]. ... 34
Figure 24 - Axial compression of carbon fiber reinforced polymer (CFRP) with embedded hole [48]... 36 Figure 25 – a) and b): Finite element analyses (FEA) model for two finite solid plates of equal dimensions and properties. Cut-outs with the same projected cross-sectional area (height of the square is equal to the circle diameter). Boundary conditions: roller/slider constraint for the top, bottom and left outer-surfaces and for the frontal surface; forced horizontal displacement for the right outer-surface. Red indicates highest
xviii
stress values and blue the lowest. Models show only stress distribution. Strain is not represented (un-deformed models). From the values obtained: 𝜎𝑚𝑎𝑥𝑠𝑞𝑢𝑎𝑟𝑒 ≈ 1.11 ∙ 𝜎𝑚𝑎𝑥𝑐𝑖𝑟𝑐𝑙𝑒. (Study details in Annex 3); c) Stress lines of tension/compression in the horizontal direction. Highest stress concentration where
lines are closest. ... 36
Figure 26 - Geometry and notation of a rectangular opening under loading [49]... 37
Figure 27 – a) Most favorable radius ratio for various openings in contours of load factor; b) Most favorable radius ratio in contours of aspect ratio [49]. ... 37
Figure 28 – Tension of a broken fiber transmitted to adjacent fibers through the matrix [51]. ... 37
Figure 29 – Types of reinforcements [52]. ... 38
Figure 30 – Delamination mechanisms: a) Peel-up delamination at entrance; b) Push-down delamination at exist [54]. ... 38
Figure 31 – Delamination of unidirectional fiber reinforced laminate: a) Original image; b) Image segmented by using neuronal network; c) Identification of the delamination region [54]. ... 39
Figure 32 - Effect of feed on delamination in drilling glass fiber reinforced composites: a) peel-up delamination; b) push-down delamination [65]. ... 39
Figure 33 – a) Bi Carbon Fiber; b) Uni Carbon Fiber; c) Airex C70.75; d) Kevlar 49 (aramid fiber). ... 40
Figure 34- Materials cut to length, ready for hand-lay-up lamination process: a) Bidirectional Carbon Fiber, 3K, HS, 160 [𝑔𝑟/𝑚2], plain weave cloth; b) Unidirectional Carbon Fiber, 3K, HS, 215 [𝑔𝑟/𝑚2], 15 [cm] wide tape. ... 44
Figure 35 – Curing process of the laminate: vacuum bag at -0.5 [bar] during 24H, at a room temperature of 20ºC, with the air-condition system set to dry heat (low humidity environment). Plies were laid-up over a polished glass and covered with Compoflex® 150 SBRF [250 𝑔/𝑚2] which acts as a peel-ply and breeder allowing for the excess resin to be removed. All materials were then covered with a plastic sheet and sealant tape was used to allow for the vacuum to be created. Note: the polished glass was treated with a de-molding substance (wax) to keep the composite from sticking to it. ... 44
Figure 36 – Composite flat plate mounted on the CIDIFA CNC machine, ready to be cut. The plate was fixed to the table using wood screws. ... 45
Figure 37 – Milling tool used to cut the composite: 4 IZAR 4600 N HSS E/Co8 Stg.21.8 (diameter: 4 [mm]). ... 45
Figure 38 – Detail: Flat plates after cutting – a) Bidirectional carbon fiber; b) unidirectional carbon fiber. As expected, greater delamination damage on the unidirectional material. ... 45
Figure 39 – Obtained specimens: Intermediate stage - types: 1,2 and 5 complete (see Table 5). ... 45
Figure 40 – Tabs being glued to the compression specimens of each of the two materials. ... 45
Figure 41 - Obtained specimens: Final stage - types: 1,2,3,4 and 5 complete (see Table 5). ... 45
Figure 42 – Detail: a) Type 3 specimen: Compression, 0º Bi; b) Type 4 specimen: Compression, 90º Bi. .... 45
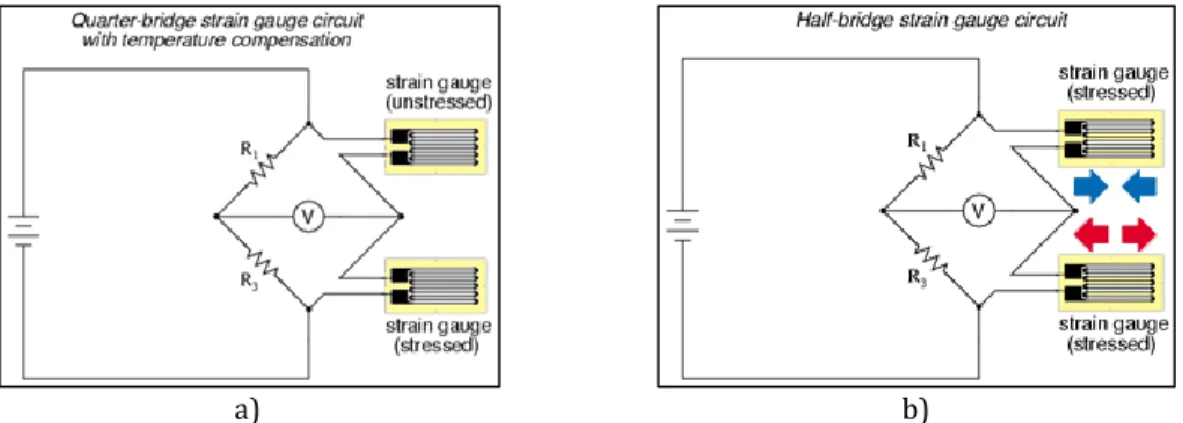
Figure 43 – a) Gauge Name: INSTRON 2630-106. Specs: Type: STATIC; Resistance: 350 Ω; Travel: +12.5 mm/-2.5 mm; Gauge length: 25 mm; Gauge length accuracy: ±0.5 % of the gage length. Attachment method: Surface attachment by a combination of pressure and friction; b) Gauge Name: HBM 1-LY16-3/120. Specs: Resistance: 120 Ω ±0.35 %; K-Factor: 1.98 ±1.0 %; Max. rms bridge excitation voltage: 0.5 V; Temperature coefficient 93 ±10 [10 − 6/𝐾]; Attachment method: glued with Loctite Super COLA 3. ... 46
Figure 44 - Wheatstone Bridge configurations: a) Quarter-bridge with temperature compensation; b) Half-bridge. ... 46
xix
Figure 45 – Comparison between specimens’ failure modes and the correspondent final shapes of the strain gages attached: a) 0º or 90º Bi CF specimen. Transversely oriented strain gage is shown. Gage remained glued and does not show any visible plastic deformation (although not shown, the same was observed for the longitudinal gage); b) 45º Bi CF specimen. Longitudinally oriented strain gage. Gage with substantial plastic deformation and detached from the specimen’s surface. ... 47 Figure 46 – Wing structure initial model: a) Bottom view of the external surface (skin) with holes and cut-outs for the payload and servo motors; b) Detail: holes and surrounding contact area for payload bolted attachment; c) Detail: holes and surrounding area for servo motor 1 bolted attachment; d) Wing internal structure: two Spars and nine Ribs; e) Detail: root extension of the spars; f) and g) Detail: hole diameter of the rib at the root and tip, respectively. ... 54 Figure 47 – Simplified Initial Model. ... 57 Figure 48 – Material 0º Direction: a) Simplified model Skin and Caps; b) Simplified model Ribs and Webs. ... 58 Figure 49 - Various components’ meshes and respective nodes coincidence: a) Detail: coincidence between Skin and Rib nodes; b) Detail: coincidence of multiple nodes belonging to: Skin, Spars, Ribs, payload attachment area; c) Detail: payload attachment area; d) Detail: Servo motor attachment area. ... 59 Figure 50 – Thicknesses attributed to the components (Rib at the root has been hidden). Grey color represents the Top Surface of the shell; Orange color represents the Bottom Surface of the shell. Detail: a) Leading edge and 1st Spar Caps and Webs; b) 2nd Spar Caps and Webs; c) Trailing edge overlap. ... 60
Figure 51 – Cantilever boundary condition. ... 60 Figure 52 – Forces and Moments applied on the structure: a) Lift; b) Pitching Moment; c) Payload Body Forces; d) Motor 1 or 2 Body Forces; e) Structure’s Acceleration. ... 62 Figure 53 – Small holes meshed with different FE sizes: a) FE size of 70 [mm], tolerance of 3.5 [mm]; b) FE size of 30 [mm], tolerance of 1.5 [mm]; c) FE size of 20 [mm], tolerance of 1.0 [mm]. ... 63 Figure 54 –Von Mises Stresses across all plies. Maximum Stress localized at the wing root... 64 Figure 55 – Wing Displacement. Maximum Displacement localized at the wing tip. ... 64 Figure 56 - Wing skin with core – Airex C70.75 foam core (3 [mm]) for all the skin: a) Von Mises maximum stress across all plies; b) Von Mises maximum stress for the 2nd Ply. Note: skin laminate configuration: 1 ply
CF (0.95 [mm]) / 1 Ply Foam (3 [mm]) / 1 ply CF (0.95 [mm]). ... 67 Figure 57 - Wing skin with core “corrected” – no foam core on the sections of the skin above the Caps: a) Von Mises maximum stress across all plies; b) Von Mises maximum stress and other probed stresses for the 2nd Ply. Note: skin laminate configuration: Over the Caps: 2 plies CF (0.95 [mm]); other areas: 1 ply CF (0.95
[mm]) / 1 Ply Foam (3 [mm]) / 1 ply CF (0.95 [mm])... 68 Figure 58 - 1st Spar Cross-Section Geometric Configurations: a) IIIII; b) IIII; c) III config. 1; d) III config. 2; e)
II config. 1 (pi); f) II config. 2 (box); g) II config. 3 (cc-inverted); h) II config. 4 (cc); i) I config. 1 (I); j) I config. 2 (c-inverted); k) I config. 3 (c); l) III config. 1 Feasible Configuration. ... 69 Figure 59 - 2nd Spar Cross-Section Geometric Configurations: a) II (box); b) I (c). ... 70
Figure 60 - Ribs Cross-Section Geometric Configurations: a) Necessary holes; b) Necessary holes and simplified geometry. ... 71 Figure 61 – Skin failure due to its reduced thickness (only 0.226 [mm]). ... 72 Figure 62 – a) Graph: Maximum Stress [MPa] Vs Mass [kg]; b) Graph: Maximum Displacement [MPa] Vs Mass [kg];... 72
xx
Figure 63 – “Corrected” Cantilever boundary condition. ... 74
Figure 64 – a), b), c), d) Von Mises Stresses across all plies; e) Von Mises stresses and other probed stresses for the 2nd Ply (foam ply); f) Wing Displacement. Maximum Displacement localized at the wing tip. ... 76
Figure 65 - Complete Wing Geometry: a) Bottom view; b) Top view. ... 80
Figure 66 – Wing Skin: a) Detail: root; b) Detail: leading edge; c) Detail: transition from skin without foam to skin with foam; d) Detail: trailing edge. ... 81
Figure 67 – Top Skin, Bottom view. ... 81
Figure 68 – Bottom Skin, Top view. ... 81
Figure 69 – Kevlar Hinged Connection: a) Detail: close-up of the top skin, top view. 3 [mm] gap between the main structure and the Flap; b) Detail: close-up of the top skin, section view. ... 81
Figure 70 – Bottom skin: a) and b) Detail: close-up on the attachment area of the payload’s “skin reinforcement”; c) and d) Detail: close-up on the attachment area of the servo motors’ skin reinforcement; ... 82
Figure 71 – 1st Spar: a) Detail: root; b) Detail: close-up on the plies that constitute the 1st Spar; c) Detail: close-up on some of the plies that constitute the 1st Spar and on the attachment to the bottom skin inner surface. ... 82
Figure 72 – 2nd Spar: a) Detail: root; b) and c) Detail: close-up on the plies that constitute the 1st Spar and on the attachment to the bottom skin inner surface. ... 83
Figure 73 – Bottom Skin of the main structure + 1st Spar + 2nd Spar + Flap Spar + Aileron Spar + Ribs: a) Top view; b) Detail: Ribs mid-section geometry. ... 83
Figure 74 – Ribs geometry: Root Rib + 2nd Rib + 3rd Rib... 83
Figure 75 – Flap or Aileron: a) Components exploded view; b) Detail: close-up on the plies that constitute each component. ... 83
Figure 76 – Airfoil S4110 characteristics: a) Cl vs Alpha; b) Cm vs Alpha... 92
Figure 77 – Finite Element Analysis Stress Results for Square hole. Max stress: 1.308 [GPa]. ... 92
Figure 78 - Finite Element Analysis Stress Results for Circular hole. Max stress: 1.178 [GPa]. ... 92
Figure 79 – a) 0º Uni CF (no break); b) 0º Bi CF (no break); c) 90º Uni CF (break); d) 90º Bi CF (break); e) 45º Uni CF (break); f) 45º Bi CF (break). ... 94
Figure 80 – a) Stress: 0º Uni CF (no break); b) Longitudinal Strain: 0º Uni CF (no break); c) Transverse Strain: 0º Uni CF (no break); d) Stress: 0º Bi CF (break); e) Longitudinal Strain: 0º Bi CF (break); f) Transverse Strain: 0º Bi CF (break); g) Stress: 90º Uni CF (break); h) Longitudinal Strain: 90º Uni CF (break); i) Stress: 90º Bi CF (break); j) Longitudinal Strain: 90º Bi CF (break); k) Stress: 45º Uni CF (break); l) Longitudinal Strain: 45º Uni CF (break); m) Stress: 45º Bi CF (break) (also large yield); n) Longitudinal Strain: 45º Bi CF (break) (also large yield). ... 96
Figure 81 – a) 2D Stress. Max Stress: 91.12 [MPa]; b) 2D Displacement. Max Displacement 47.02 [mm]; c) 3D Stress. Max Stress: 60.11 [MPa]; d) 3D Displacement. Max Displacement: 79.96 [mm]. ... 99
Figure 82 – Material properties menu. ... 100
xxi
List of Tables
Table 1 –Wing External Geometry Specifications. ...7
Table 2 – Properties of the Available Materials. ... 41
Table 3 – Properties of the Manufactured Materials. ... 42
Table 4 – Material’s physical characteristics Vs number of Plies. ... 43
Table 5 – Manufactured Specimens ... 45
Table 6 – Convergence analysis of the Mesh Parameters of the Simplified Initial Model. ... 63
Table 7 – Skin Cross-Section Geometry Evaluation... 67
Table 8 – 1st Spar Cross-Section Geometry Evaluation. ... 68
Table 9 – 2nd Spar Cross-Section Geometry Evaluation. ... 70
Table 10 – Ribs Cross-Section Geometry Evaluation. ... 70
Table 11 – Components Importance Definition... 71
Table 12 – Properties of Epoxy + Uni Carbon Fiber (215 [𝑔𝑟/𝑚2]) ... 96
Table 13 – Properties of Epoxy + Bi Carbon Fiber (160[𝑔𝑟/𝑚2]) ... 97
Table 14 – Airex C70.75. ... 98
Table 15 – Epoxy + Kevlar 49. ... 99
xxiii
List of Acronyms
AAN Autoridade Aeronáutica Nacional
AC Aerodynamic Center
AFA Academia da Força Aérea – Portuguese Air Force Academy AI Artificial Intelligence
ANTEX-M Experimental Unmanned Aircraft - Military
ASTM American Society for Testing Materials
BF Body Force
Bi CF Bidirectional Carbon Fiber BLOS Beyond the Line-of-Sight
CAD Computer-Aided Design
CEiiA Centro de Excelência e Inovação da Indústria Automóvel
CFRP Carbon Reinforced Polymer
CIDIFA Centro de Investigação, Desenvolvimento e Inovação da Forca Aérea – Portuguese Airforce Investigation, Development and Innovation Center
CNC Computer Numerical Control
CP or C Center of Pressure
CSW Critical Software
DGPM Direção Geral de Política do Mar DGPS Differential Global Positioning System
EAS Equivalent Airspeed
EDA European Defense Agency
EDP Energias de Portugal
EEZ Economic Exclusive Zone
EMSA European Maritime Safety Agency
EU European Union
FAP Força Aérea Portuguesa - Portuguese Air Force FCUL Faculdade de Ciênicas da Universidade de Lisboa
FE Finite Element
FEA Finite Element Analysis
FEUP Faculdade de Engenharia da Universidade do Porto FIR Flight Information Region
GNR Guarda Nacional Republicana
HS High Strength
IT Instituto de Telecomunicações IST Instituto Superior Técnico
LNEC Laboratório Nacional de Engenharia Civil
MAC Mean Aerodynamic Chord
MDN Ministério da Defesa Nacional MDO Multidisciplinary Optimization
xxiv
MFA Manual da Força Aérea
MTOW Maximum Take-Off Weight
NASA National Aeronautics and Space Administration NATO North Atlantic Treaty Organization
NHAA Negative High Angle of Attack NLAA Negative Low Angle of Attack
PC Personal Computer
PHAA Positive High Angle of Attack
PITVANT Projeto de Investigação e Tecnológia em Veículos Aéreos Não-Tripulados - Project of Technological Investigation in Unmanned Aerial Vehicles
PLAA Positive Low Angle of Attack
PTInS Portugal Telecom Innovation and Systems RD&I Research, Development and Innovation
REP Rapid Environmental Picture
SAR Search and Rescue
SF Safety Factor
SRR Search and Rescue Region
SSL Standard Sea Level
STANAG Standardization Agreement
SW SolidWorks 2016 x64 Edition
TO Topology Optimization
UAS Unmanned Aircraft System
UBI Universidade da Beira Interior UCB University of California and Berkley
UM University of Munich
Uni CF Unidirectional Carbon Fiber
UW University of Warsaw
WWII World War II
2D Two Dimensions
xxv
List of Symbols
𝛼 Angle of attack
𝛼𝑟𝑜𝑜𝑡 Wing twist at the root
𝛼𝑡𝑖𝑝 Wing twist at the tip
𝛾 Shear strain
Γ Wing dihedral angle
𝜀 Strain
𝜆 = 𝑐𝑡𝑖𝑝
𝑐𝑟𝑜𝑜𝑡 Wing taper ration
Λ𝐿𝐸 Wing sweep angle (leading edge)
𝜇 Mass ratio
𝑣 Viscosity / Poisson’s ratio
𝜌 Density
𝜎 Stress
𝜎𝑢 Ultimate stress or Ultimate Strength
𝜎𝑦 Yield stress or Yield Strength
𝜏 Shear stress
# Number
𝑎 Acceleration
A Area
𝐴𝑅 =𝑏𝑆2 Wing aspect ratio
𝑏 Wing Span
𝑐 Local wing chord
𝑐̅ Wing standard mean chord
𝐶𝑙 Airfoil lift coefficient
𝐶𝐿 Lift coefficient
𝐶𝐿𝛼 Lift coefficient slope
𝐶𝑚 Airfoil pitching moment coefficient
cm Centimeter
𝐶𝑀 Pitching moment coefficient
𝑐𝑟𝑜𝑜𝑡 Wing chord at the root
𝑐𝑡𝑖𝑝 Wing chord at the tip
𝑑 Distance between the CP and the AC along the airfoil’s chord (c)
𝐷 Drag / Diameter
𝐸 Modulus of elasticity or Young’s modulus
𝐹 Force
𝐹𝑖 Inertial forces
ft Foot
xxvi
𝐺 Modulus of rigidity or Young’s modulus for shear G’s Earth’s gravity acceleration
GPa Giga Pascal
gr Grams
H Horizontal (x direction) component of the force resultant (R)
𝐼 Area moment or inertia
𝐾 Gust alleviation factor
kg Kilogram
𝑙 Solid’s dimension
𝑙0 Solid’s initial dimension
𝐿 Lift
𝑚 Mass / meter
𝑀 Moment
mm Millimeter
𝑀0 Constant pitching moment
MPa Mega Pascal
𝑚/𝑠 Meters per second
𝑛 Wing load factor
𝑁 Normal component of the force resultant (R) / Newton
𝑞 Dynamic pressure
𝑟 Radius
𝑅 Force resultant
𝑅𝑒 Reynold’s number
rpm Rotations per minute
S Area of the wing platform (projected area on the horizontal plane)
𝑠𝑙 Sea level
𝑇 Temperature
𝑢 Equivalent gust velocity
𝑢̂ Standard gust velocity
V Velocity
𝑉𝑐 Aircraft cruise velocity
𝑉𝐷 Aircraft dive velocity
𝑉𝑒 Equivalent airspeed
1
1 Introduction
1.1 Framework
The work herein presented regards the development of a cost-effective unmanned aerial system (UAS) to be used for search and surveillance purposes over the vast area under the Portuguese jurisdiction. Portugal has search and rescue (SAR) responsibilities over almost 6 million km2 (square
kilometers) of airspace from which 98% are over water (including interior waters, territorial sea and the Economic Exclusive Zone (EEZ)) [1] [2] [3] [4] [5], which makes Portugal the country holding the vastest water jurisdiction area in the European Union (EU), and the second vastest in the world [1] [2] [3] [6] [7] [8]. See Figure 1.
Figure 1 - Airspace, Water and Land areas under Portugal’s responsibility and/or jurisdiction: Green: Land area (mainland Portugal, Archipelago of Madeira and Archipelago of Azores); Yellow: Economic Exclusive Zone (EEZ) (1.66 million km2 [3]); White: Proposal to extend the limits of the continental shelf (3.6 million km2 [3]); Red: Airspace under Portugal responsibility which coincides with the Search and Rescue Region (SRR) of responsibility (5.8 million km2,
divided into two Flight Information Regions (FIR) – Santa Maria and Lisbon [1]).
All of this areas require aerial presence either in the form of surveillance or patrol to ensure that the country’s rights and duties are enforced and no illegal activities are performed. Also, monitoring is crucial to ensure border control and, therefore, the security and sovereignty of the Nation [4].
Missions of surveillance, patrol and SAR in the Portuguese EEZ and/or the SRR are the daily responsibility of entities such as the Portuguese Air Force (FAP), Portuguese Navy, Maritime Police, National Civil Protection Authority (ANPC), Port Authorities and others [3] [8].
The size, importance and mandatory nature of these missions, requires the existence of means/equipment/platforms (aerial, maritime and ground), that can act in an integrated manner.
In order to better assist and alleviate the operational load of these missions, the Portuguese Air Force (FAP) began, in 2008, a project of Research, Development and Innovation (RD&I) called PITVANT
2
(Project of Technological Investigation in Unmanned Aerial Vehicles), Figure 2. Its main objective was to develop technology in various study areas regarding small and medium-sized unmanned aerial systems (UAS). This was achieved by creating and testing new systems and technologies and also new concepts of operation, for both military and civilian applications. In addition, the personal gained Know-how and the ability to define operational and maintenance requisites for this type of systems [9] [10].
a) b) c) d)
Figure 2 – a) The project’s Patch with its moto “ET OBSERVA VOLANT” [9]; b) ANTEX-X02 Alfa, UAS with maximum take of weight (MTOW) of 25 kg [11]; c) UAS30, with MTOW of 30 kg [12]; d) ANTEX-X03, with MTOW of 149 kg [13].
During the PITVANT project, which was developed in accordance with the Air Force Manual (MFA) 500-121, various UAS of class I2 (Figure 2) were designed, manufactured and flown, totalizing more than
800 flight hours [14] [15] [16].
Innumerous systems were developed, tested and integrated in the platforms, which included: algorithms for identification and tracking of land features (such as coast-lines, roads, railways, etc.) and also stationary or moving targets either at sea or land; systems that allowed nocturnal flights, multiplatform coordinated flights and beyond the line-of-sight (BLOS) flights; multispectral cameras (including thermal); real time video feed; integration of the Differential Global Positioning System (DGPS) to allow for precise automatic landings; the development of an onboard Computer Architecture for an easy integration of new sensors; etc. [14] [15].
The platforms developed during this project were also put to test in various Operational Exercises such as: the maritime surveillance exercise Rapid Environmental Picture (REP) that took place in 2012 (REP-12) and 2013 (REP-13); the SharpEye exercise in 2014; the ZARCO exercise in 2015, which involved the three branches of the Portuguese armed forces; among others [15].
The project allowed for the acquisition and development of competences by the personal involved leading to the qualification of the first UAS operators belonging to the FAP and the training of various class I UAS operating teams [15].
1Portuguese Air Force Manual 500-12 entitled Strategic Foresight for Unmanned Aerial Systems [16].
2According to the North Atlantic Treaty Organization (NATO) on the classification of UAS [73], they can be divided into 3
Categories: i) CLASS I: Less than 150 kg. Divided into the Categories: MICRO (< 2 kg), MINI (2-10kg) and SMALL (>20kg); ii) CLASS II: 150 kg to 600 kg. Category: TACTICAL; iii) CLASS III: More than 600 kg. Categories based on altitude and mission: Strike/Combat (≤65,000 ft), HALE (High Altitude Long Endurance) (≤65,000 ft) and MALE (Medium Altitude Long Endurance) (≤45,000 ft). Operates at the higher altitudes and with the higher speeds, range, endurance and size.
3
Furthermore, during the various phases of the project, collaboration was established between the FAP and various governmental and non-governmental, military and civilian entities/companies namely: the Portuguese Navy; the Portuguese Army; the National Republican Guard (GNR); the Direção Geral de Política do Mar (DGPM); the Instituto Superior Técnico (IST); the Faculdade de Ciênicas da Universidade de Lisboa (FCUL); the Faculdade de Engenharia da Universidade do Porto (FEUP); the Universidade da Beira Interior (UBI); the Civil Engineering National Laboratory (LNEC); the Telecommunications Institute (IT); the center of excellency and innovation of the automobile industry (CEiiA); Critical Software (CSW); the UAVision; the Deimos – Engineering; the OPTIMAL; the INOVAWORKS; the INESC-Inov, the Portugal Telecom Innovation and Systems (PTInS); the Energies of Portugal – Innovation (EDP-innovation); the University of California and Berkley (UCB), the University of Saltzburg, the University of Munich (UM), the University of Delft, the University of Warsaw (UW) and the European Maritime Safety Agency (EMSA) [15].
The developed UASs achieved with success the objectives that had been set nevertheless, with the arrival of the year 2015, the project came to its end.
In order to follow in the footsteps of this project and to answer to the new operational objectives that required a certifiable platform capable of performing maritime surveillance and SAR missions (in light of the Nacional Strategy for the Sea 2013-2020), a new project was started in 2016 entitled “Industrialização e Comercialização de um Sistema Aéreo Autónomo Não Tripulado classe II”. This new project had the goal to design, qualify, certify and possibly commercialize unmanned aircrafts for operational use (either military or civilian), integrating the systems that were developed and tested in the project PITVANT [14] [15] [17].
In light of this new project started in 2016, the present thesis applies to the class II UAS (Unmanned Aerial System) platform that is currently under development by a Consortium between the FAP and National companies, financed by the Portuguese Ministry of National Defense (MDN) [17].
This class II project requires the development of a scale down class I model “UAS145” (Maximum Take-Off Weight (MTOW) of 145Kg) to validate concepts and systems and optimize aerodynamics and structures.
The developed UAS145 should result in a product suitable for operational missions, and should be developed with the aim of being certifiable by the AAN (National Aeronautical Authority) in accordance with NATO regulations, replacing the ANTEX-M (Experimental Unmanned Aircraft - Military) platforms, which service life is ending due to limitations of its operational use and also due to the lack of a solid structural design which makes those platforms unsuitable for certification.
The use of the class I platform for search and surveillance purposes, in the vast area under Portugal’s responsibility, demands for the optimization of its range and endurance capabilities.
The present thesis aims to answer that need by designing and optimizing the UAS145 wing structure, making it a better and more cost-effective platform.
The external geometry of the wing was previously established by the Portuguese company UAVision which was responsible for creating the class I preliminary designs.
4
1.2 Objectives
1.2.1 Primary
o Design a wing structure that fulfills all structural, mass and operational requirements:
Symmetric positive limit maneuvering load factor ≥ 3.8 and symmetric negative limit maneuvering load factor ≤ -1.5;
High wing stiffness - wing tip displacement ≤ 5% of the wing’s half span; Wing mass ≤ 26.2 [kg];
Each half-wing capable of carrying an external suspended payload up to 10 [kg]; Wing structure capable of being certifiable in terms of airworthiness.
o Optimize the structure – simplify the structure’s geometry and reduce its mass while fulfilling the previous requirements:
Minimize weight;
Reduce manufacturing costs.
1.2.2 Secondary
o Create a structure capable of being used in multiple operational scenarios and environments, within and beyond the requirements:
Choose the most suitable materials; Create multipurpose attachment areas.
o Establish a straight-forward functional methodology that allows for quick design and optimization of simple wing structures.
1.3 Conditions / Restrictions
o Use the materials available at the Centro de Investigação, Desenvolvimento e Inovação da Força
Aérea (CIDIFA);
o Wing’s external geometry established by the UAVision;
o Wing has to allow for the internal routing of electric cables for the various electronic equipment and for the wing-tip lights;
o Wing has to allow for the installation of “servo-motors” to control the ailerons and flaps; o Wing has to allow for the installation of wing-tips / winglets.
1.4 Thesis Structure
The present thesis is comprised of 7 sections:
Section 1 - Introduction:
Framework – explanation of the purpose and importance of the thesis; Definition of the objectives and restrictions;
Insight into the “State of the Art”.
5
Definition of the wing’s external geometric parameters and creation of an initial 3D model.
Section 3 - Forces Acting on the Wing:
Definition of the aircraft’s flight envelope;
Identification of the critical forces and moments acting on the wing and how.
Section 4 - Wing Initial Structural Design:
Materials selection and properties definitions via experimental procedures;
Design of an initial structure that satisfies the structural requirements and that could be certifiable.
Section 5 - Wing Structure Analysis and Optimization:
Structural Finite Element Analysis (FEA) and a 4 step “chain top-down” optimization process.
Section 6 - Wing Final Design including Flaps and Ailerons:
Wing final design and respective 3D model;
Summary of the wing’s: structural characteristics; materials used; final mass; and manufacturing costs.
Section 7 - Conclusions and Future Work:
Conclusions and Recommendations for future works that may give continuity to the present thesis.
1.5 Design and Optimization of Aircraft Structures - State of the Art
Designing aircraft structures is particularly challenging because their weight must be kept to a minimum while all of the needed strength and rigidity are provided, in order for the aircraft to meet all of its design requirements. Any excess structural weight often makes an aircraft cost more to build and to operate.
“Designing aircraft structures involves determining the loads on the structure, planning the general shape and layout, choosing materials, and then shaping, sizing and optimizing its many components to give every part just enough strength without excess weight. (…) Choice of materials for the structure can profoundly influence weight, cost, and manufacturing difficulty. The extreme complexity of modern aircraft structures makes optimal sizing of individual components particularly challenging” [18].
The design of an aircraft structure has inherently become an optimization process which requires a proactive approach from the designer in being able to simultaneously balance three fundamental criteria: design, materials selection and manufacturing processes.
In the last decades, major advances in composite materials and sandwich structures have revolutionized the way structures are designed as well as the tools and processes used for their manufacturing and testing.
The 3D printing technology is perhaps the most promising of those tools since, although still in its infancy, there are already 3D printers capable of not only printing polymers, ceramics and metals but also full composite structures using continuous carbon, aramid (Kevlar) or glass fibers. This will undoubtedly allow for the reduction of the complexity and the manufacturing costs of composite structures as well as increase the uniformity of the final products.
6
The 3D printing technology will also offer designers greater freedom to pursue more “exotic” structures that could never before be manufactured with conventional methods.
Due to the increasing complexity of the structures and the materials used, finite element analysis (FEA) has become indispensable for structural evaluation and optimization purposes.
Since tools influence the design, designers had to adapt their design practices by assuming approximations (e.g. surface approximations [19]) and decomposition strategies to cope with very high computational demands and complexities arising from the organization of optimization tasks.
Nevertheless, the exponential increase in computational power observed in the last 50 years has allowed designers to create ever more complex structures and to simulate them without the need for over-simplification.
Computer technology has evolved so much that, nowadays, almost any regular personal computer (PC) is able to run multidisciplinary optimization (MDO) processes, although time consumed might be an issue.
A “new” significant advance in design optimization is the “topology optimization” (TO) which is making full use of new advances in computer science including the development of artificial intelligence (AI). Although this technology might undermine the creative thinking of structural designers, human intervention is still expected to be part of the process by introducing boundary conditions and other necessary parameters. Figure 3 show an example of a “topological optimization process”.
Figure 3 – Example of topological optimization process [20].
Yet, for assemblies, the mathematical fundaments and logical processes used for optimization purposes remain based on the same proven “hierarchical” and “non-hierarchical” decomposition techniques as explained by [19]. Therefore, for an assembly, although powerful software exist, a good degree of overall structural optimization can, nowadays, alternatively be accomplished by using the readily available computational power of a PC to run a “simple” software capable of performing FEA analysis and by introducing each optimization step (new geometric configuration) by hand. This may increase the overall optimization time but allows the user to avoid using complex, “heavy” and expensive software and to have full control over the optimization process.
7
2 Wing External Geometry
2.1 Geometric Parameters Definition
From the UAVision’s document [21] containing the aircraft’s preliminary specifications, the information regarding the wing geometry was selected. That information is presented in Table 1.
Table 1 –Wing External Geometry Specifications. General Span (𝑏) 6.500 [m] Root chord (𝑐𝑟𝑜𝑜𝑡) 0.722 [m] Tip chord (𝑐𝑡𝑖𝑝) 0.578 [m] Taper ratio (𝜆 = 𝑐𝑡𝑖𝑝 𝑐𝑟𝑜𝑜𝑡) 0.8
Twist at the root (𝛼𝑟𝑜𝑜𝑡) 4.4º
Twist at the tip (𝛼𝑡𝑖𝑝) 0º
Sweep angle (leading edge) (Λ𝐿𝐸) 0º
Dihedral Angle (Γ) +2º
Area of the wing platform (projected area on the
horizontal plane) (S) 4.225 [m2]
Aspect ratio (𝐴𝑅 =𝑏𝑆2) 10
Airfoil
Section (profile) SELIG S4110
Maximum relative thickness location (relative to the
leading edge, and measured at the local wing chord (𝑐)) 28.0% Ailerons
Span (each) 1.300 [m]
Relative chord (relative to the local wing chord) 30.0%
Location along the wing span 55.0%
Maximum up deflection −25º
Maximum down deflection 25º
Flaps
Type Plain
Span (each) 1.300 [m]
Relative chord (relative to the local wing chord) 30.0%
Maximum down deflection 30º
2.2 Wing External Geometry Modeling
In order to better understand the wing’s geometry and to establish the structure’s outer limits, a 3D model was obtained using the modeling capabilities of the software SolidWorks 2016 x64 Edition (SW), the information presented in Table 1 and additional airfoil geometric data from [22]. That information and data allowed to define the root and tip airfoils’ shape and location (see Annex 1), which were then imported into the SW allowing for the modeling of the wing’s surface geometry (2D shells), shown in Figures 4 and 5 (dimensions are in [mm]).
8
Figure 4 – Half-wing top view.
Figure 5 – Half-wing side view (root).
For modeling simplification purposes, only half wing was modeled, since the wing is symmetric in relation to the fuselage.
Also, the dihedral angle was not introduced into de model since it would only change the direction of the z and y axis. The dihedral angle can be introduced to the each half-wing when attaching them to the fuselage.
Moreover, as it can be observed in Table 1, the Flap location was not fully defined. In order to maximize the wing’s structural strength – by leaving the largest possible continuous skin area near the wing root - it was decided to place the Flap next to the Aileron with a 3 mm gap separation between them, allowing for their free relative movement. For the same purpose, another two 3 mm gaps were also left between the main wing surface and the tips of both the Flap and Aileron.
Finally, a specifically dimensioned gap was left between the main wing bottom surface and bottom leading edge surfaces of both the Flap and Aileron, to allow for their maximum deflections (considering their articulation axis to be located at their top leading edge surfaces).
All gaps were created by suppressing area from the main wing surface in order to maintain the Flap and Aileron specified dimensions, thus maintaining the wing’s aerodynamic characteristics.
9
3 Forces Acting on the Wing
3.1 Aircraft Loads Overview
The loads on an aircraft are due to a combination of static and dynamic weights, and aerodynamic forces [23].
An aircraft structure is required to support two distinct classes of load: ground loads, which include all loads encountered by the aircraft during movement or transportation on the ground (e.g. landing, taxiing, towing, hoisting, etc.); and air loads, which comprise loads that are imposed on the structure during flight by maneuvers and gusts (sudden, brief change in the velocity of an air mass). “The two classes of loads can be further divided into: surface forces which act upon the surface of the structure, e.g. aerodynamic and hydrostatic pressure; and body forces which act over the volume of the structure and are produced by gravitational and inertial effects” [24]. These two subclasses can be divided even further into: point loads /
concentrated loads, e.g. catapult launching, towing, arresting external stores, and landing gear loads; and distributed loads, e.g. aerodynamic loads such as lift and drag, which are a result of pressures and shear
stresses distributed over the aircraft surface [18].
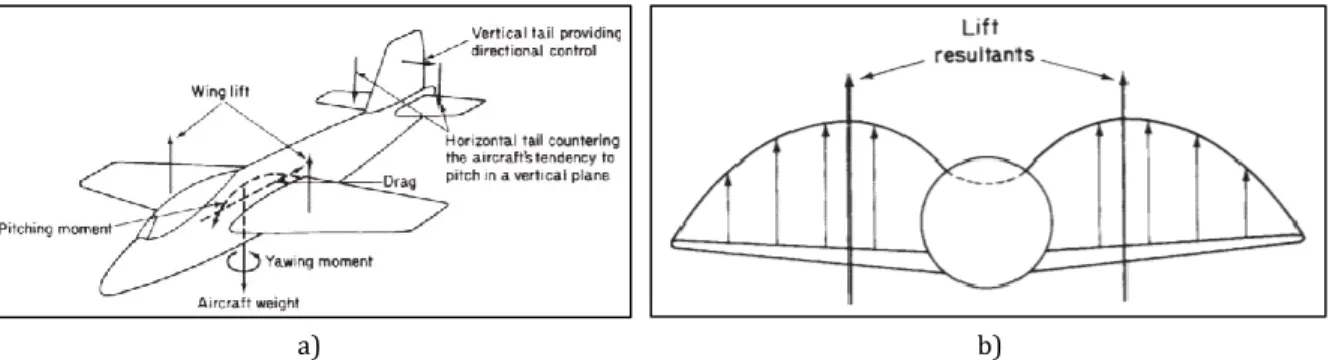
Figure 6 shows typical force and moment resultants experienced by an aircraft in steady flight (air loads: surface forces + body forces).
a) b)
Figure 6 – a) Typical force and moment resultants for a flying aircraft; b) Typical non-uniform lift distribution [24].
It should be noted that “maneuvers and gust do not introduce different loads but result only in changes of magnitude and position of the type of existing loads” [24].
3.1.1 Surface Forces - Aerodynamic Loads
“There are only two ways in which a fluid can impact forces to a body immersed in it. The first way, (…) is by exerting pressure perpendicular to the body’s surface. If the pressures on opposite sides of a body are not equal, then a net force such as lift is exerted on the body. A portion of the drag on a moving body likewise results from pressure imbalances, but a significant portion also results from shear stresses exerted parallel to the body surface caused by the viscosity (resistance to flowing) of the fluid. In reality, lift and drag are components of a total aerodynamic force on the body, which is a sum of the net force caused by pressure imbalances and the net force caused by shear stresses” [18].
“Pressure loads are generally of a much greater magnitude than aerodynamic loads which are caused by shear.” In other words, generally Lift >> Drag [18].
10
“The force on an aerodynamic surface (wing, vertical or horizontal tail) results from a differential
pressure distribution caused by incidence, camber and a combination of both” [24]. See Figure 7 a). “Such a pressure distribution, (…) has vertical (lift) and horizontal (drag) resultants acting at a centre of pressure (CP). (In practise, lift and drag are measured perpendicular and parallel to the flight path respectively)” [23] [24], see Figure 7 b). Also, at the CP the moment due to the lift and drag forces is zero, see and Figure 8 a).
a) b)
Figure 7 – a) Airfoil Shape Parameters [18]; b) Aerodynamic Force Resultants on an Airfoil [25].
Figure 8 - a) Pressure Distribution on airfoil; b) Transference of Lift and Drag loads to Aerodynamic Center [24].
“(…) the position of the CP changes as the pressure distribution varies with speed or wing incidence. However, there is, conveniently, a point in the aerofoil section about which the moment due to the lift and drag forces remains constant. Thus we replace the lift and drag forces acting at the CP by lift and drag forces acting at the aerodynamic centre (AC) plus a constant moment 𝑀0” [24] as shown in the Figure
8 b). This constant moment is also referred to as pitching moment.
“While the chordwise pressure distribution fixes the position of the resultant aerodynamic load in the wing cross-section, the spanwise distribution locates its position in relation, say, to the wing root” [24]. A typical distribution for a wing/fuselage combination is shown in Figure 6 b).
“Even when the pressure and shear loads on an airfoil are represented as lift-and-drag point loads at the airfoil’s center of pressure, they must be considered as a distributed load across the span of the wing” [18]. “Drag and pitching moment also have spanwise distributions. These distributions typically have their maximum magnitudes when the aircraft is maneuvering at its maximum design load factor at low altitude and high speed.If the aircraft is banking or rolling, the lift distribution is no longer symmetrical and the wing generation the most lift often has a peak in lift distribution near the deflected aileron. (...) For asymmetrical maneuvers (…), the maximum load factor limit is set by the maximum structural load that can be sustained by the most heavily loaded wing” [18], see Figure 9. The load factor is a relation between Lift and Weight of an aircraft and is represented by n.
11
Figure 9 - Symmetrical and asymmetrical spanwise lift distributions [18].
3.1.2 Body Forces – Weight and Inertial Loads
According the Newton’s second law of motion (𝐹𝑛𝑒𝑡= 𝑚 ∙ 𝑎), if a body has mass and it experiences
an acceleration (∆𝑉𝑒𝑙𝑜𝑐𝑖𝑡𝑦∆𝑇𝑖𝑚𝑒 ) then, there will be an associated Force that caused it.
The Weight of a body is the Force applied by the Earth on the body. That force is calculated by multiplying the body mass (𝑚) by the Earth’s gravity acceleration (𝑔). At sea level, the Earth’s gravity acceleration is 9.81 [𝑚/𝑠2].
When performing a flight maneuver, the Forces acting on the aircraft are not in equilibrium (𝑁𝑒𝑡 𝐹𝑜𝑟𝑐𝑒 ≠ 0) therefore, the body will experience an additional acceleration. That maneuver
acceleration can be determined from the Net Force if the body mass is known or from the aircraft speed and
maneuver radius.
For the same type of maneuver, the acceleration value depends on the aircraft’s attitude. Figure 10 a)displays the acceleration equations for the same “pull” type maneuver but for three different aircraft attitudes.
In a maneuver, the body is said to be under dynamic conditions of the accelerated motion. The accelerated motion condition can be replaced by an equivalent set of static conditions in which the applied loads (aerodynamic loads and weight) are in equilibrium with inertial forces (∑F = 0) [24]. Figure 10 b).
a) b)
Figure 10 – a) Forces acting on an aircraft’s center of gravity, at three points in a loop. Dynamic Conditions of Accelerated Motion [18]; b) Equivalent set of Static Conditions.
The inertial forces (𝐹𝑖) are oriented in the opposite direction to the body acceleration. Their value
is determined by multiplying the body mass (𝑚) by the maneuver acceleration. Inertial forces caused by “pull” maneuvers are also usually called centrifugal forces.
12
It should be noted that in a “loop” the maximum aircraft speed will occur for the lowest position and minimum speed for the highest position as kinetic energy is exchanged by potential energy thus, the maximum and minimum load factors will also occur for the lowest and heights positions, respectively [18].
3.1.3 Wing Loads
In addition to the aerodynamic loads and inertial loads applied on the wings due its shape and structural mass, respectively, there are other loads that should also be taken into consideration.
In the specific case of payload carried on the wings, which can consist of: weapons, extra fuel tanks, electronic devices, etc., there will be additional aerodynamic and body forces contributing to the existing bending, shear and torsion of the wing [24].
Also, many aircraft have their main undercarriage located in the wings. “(...) the position of the main undercarriage should be such as to produce minimum loads on the wing structure compatible with the stability of the aircraft during ground maneuvers. This may be achieved by locating the undercarriage just forward of the flexural axis of the wing and as close to the wing root as possible. In this case the shock landing load produces a given shear, minimum bending plus torsion, with the latter being reduced as far as practicable by offsetting the torque caused by the vertical load in the undercarriage leg by a torque in an opposite sense due to braking” [24].
For the case of engines mounted on the wings, the loads caused by their thrust usually act in a plane of symmetry but may, in the case of engine failure, cause severe wing and fuselage bending moments. Also, engines will cause concentrated shock loads during hard landings and catapult launches [24].
“Before detail design of an aircraft structure can occur, the maximum magnitudes and frequencies of application, of these many loads that the aircraft must sustain in order to meet the design requirements, must be determined” [18].
The maximum loads will, therefore, establish the critical loading condition for which the structure must be designed to withstand.
For a wing, the maximum loads occur during flight. An aircraft’s flight envelope provides the necessary information to determine the maximum loads the wing will be subjected to, within the aircraft’s predicted operating parameters of the flight velocity (speed), load factor and altitude.
3.2 Wing Critical Loading Condition
3.2.1 Aircraft Flight Envelope
An aircraft Flight Envelope is a graph (diagram) that maps the possible combinations of maximum and minimum values of speed vs load factor that an aircraft can experience during flight. Within this “envelope” the aircraft can operate without suffering any structural damage.
This envelope results from the superposition of the maneuvering envelope (V-n diagram) and the
13
3.2.1.1 Aerodynamic Load Factor
“The design of the structure is based on a load limit, which is the largest expected load. (…) this is related to the aerodynamic load factor, n” [23] also known as maneuver load factor [24] or simply by load
factor. The load factor, n, is also commonly referred to as the number of G the aircraft is pulling, where G or g is the Earth’s gravitational acceleration [18]. The load factor, n is given by:
𝑛 = 𝐿
𝑊 (1)
Where L is the lift and W the weight of the aircraft.
When n = 1, L=W, the aircraft is in equilibrium (level flight) and so the aircraft is subjected to 1 G. 0
G situation would correspond to when Lift = 0 (free fall).
When designing a structure the load factor that should be used is the design load factor, 𝑛𝑑𝑒𝑠𝑖𝑔𝑛,
which represents the ultimate load that the structure is designed to withstand without suffering permanent deformation or failure. It is given by:
𝑛𝑑𝑒𝑠𝑖𝑔𝑛= 𝐿𝑜𝑎𝑑 𝑆𝐹 · 𝑛𝑙𝑖𝑚𝑖𝑡= 𝐿𝑜𝑎𝑑 𝑆𝐹 · (𝑛𝑚𝑎𝑥+ ∆𝑛) (2)
Where:
- Load SF is the load safety factor (≥1.5 being the standard for the aircraft industry for structures whose
failure would lead to a Hazardous or more serious failure condition [26]). Also, according to [26]regulations an additional factor ≥1.5 should be applied for composite structure where specimen were tested with no specific allowance for moisture and temperature;
- 𝑛𝑙𝑖𝑚𝑖𝑡 is the limit load factor, being the sum of the highest of all load factors (𝑛𝑚𝑎𝑥) from the maneuvering
envelope (V-n) of an aircraft, with the incremental load due to turbulent gusts (∆𝑛) [23].
- 𝑛𝑙𝑖𝑚𝑖𝑡 is usually obtained directly from the aircraft’s flight envelope which is the result of combining the
maneuvering envelope (V-n) with the gusts envelope (V-g) [25].
3.2.1.2 V-n Diagram
The maneuvering envelope is a graph of the Aircraft’s Equivalent Velocity vs Load Factor (V-n diagram). For the maneuvering envelope, the aircraft is considered to be in “symmetric” flight, which means, no side-slipping, rolling or yawing.
For non-acrobatic aircrafts such as the one being considered, the flight envelope is designed for the maximum take-off weight (MTOW) also called all-up weight [25]. This corresponds to the total weight of the aircraft with passengers (non-existent in this case), cargo and fuel. Also, it is designed for a “clean configuration” (no high lift devices deployed (e.g. flaps)). It should be noted that a “dirty configuration” only extends the flight envelope towards lower velocities but also decreases the maximum load factor that can be reached. This can be observed in the Figure 12.
The aerodynamic forces typically have their maximum magnitudes when the aircraft is maneuvering at low altitude, at high speed and at its maximum load factor [18] therefore, the V-n will be obtained for sea level conditions (sl) [27].
The overall aerodynamic parameters of the aircraft were obtained from the UAVision document [21] and, the airfoil parameters, from [22].
14
The steps taken in order to obtain the V-n Diagram were as follows: - 𝐶𝐿𝑚𝑎𝑥
(𝑐𝑙𝑒𝑎𝑛)𝑎𝑖𝑟𝑐𝑟𝑎𝑓𝑡= 1.35 [21]
“The Equivalent Airspeed (EAS) (𝑉𝑒 ) is an airspeed at sea level (𝜌𝑠𝑙 𝑜𝑟 𝜌0 ) that would result in
the same dynamic pressure experienced by the aeroplane flying at altitude at its true airspeed. (…) A constant equivalent airspeed will give the same lift at all altitudes for the same gross weight and load factor” [25]. 𝑞 =12∙ 𝜌 ∙ 𝑉2 (Dynamic pressure) (3) 𝑞𝑐𝑟𝑢𝑖𝑠𝑒= 1 2∙ 𝜌1500𝑚∙ 𝑉𝑐𝑟𝑢𝑖𝑠𝑒2 1500𝑚 = 2530.84 [ 𝑘𝑔 𝑚 ∙ 𝑠2]
𝜌1500𝑚= 1.084[𝑘𝑔/𝑚3] 𝑓𝑜𝑟, 𝑇 = 5º𝐶 ≡ 278.3º𝐾 (According to the International Standard Atmosphere
(ISA) [27])
𝑉𝑐𝑟𝑢𝑖𝑠𝑒1500𝑚= 68.33 [𝑚/𝑠]; 𝜌𝑠𝑙= 1.225 [𝑚𝑘𝑔3] 𝑓𝑜𝑟 𝑇 = 15º 𝐶 ≡ 288º 𝐾
- Cruise velocity at sea level: 𝑽𝒄𝒓𝒖𝒊𝒔𝒆𝒔𝒍= 𝑽𝒆= 𝟔𝟒. 𝟐𝟖 [𝒎/𝒔]
According to [26] a positive margin between the maximum design speed (𝑉𝑑𝑖𝑣𝑒) and the maximum
operating speed (𝑉𝑐𝑟𝑢𝑖𝑠𝑒𝑚𝑎𝑥) should exist and the maximum operating speed should be no more than 0.9 the
maximum design speed:
𝑉𝑐𝑟𝑢𝑖𝑠𝑒𝑚𝑎𝑥
𝑉𝑑𝑖𝑣𝑒 ≤ 0.9 → 𝑉𝑑𝑖𝑣𝑒 ≥ 1.11 𝑉𝑐𝑟𝑢𝑖𝑠𝑒𝑚𝑎𝑥
It was decided to use a factor of 1.5 according to [23].
- Design / Dive velocity: 𝑽𝒅𝒊𝒗𝒆𝒔𝒍= 𝟏. 𝟓 ∙ 𝑽𝒄𝒓𝒖𝒊𝒔𝒆𝒔𝒍= 𝟗𝟔. 𝟒𝟐 [𝒎/𝒔]
- Curve from 𝒏 = 𝟎 to PHAA (Positive High Angle of Attack) (Positive Stall Limit):
𝒏𝒎𝒂𝒙(𝑉∞) = 𝟎. 𝟎𝟎𝟐𝟑𝟓𝟖 ∙ 𝑽∞𝟐 𝑛𝑚𝑎𝑥(𝑉∞) = 𝐶𝐿𝑚𝑎𝑥· 𝜌 · 𝑆 2 ∙ 𝑊 ∙ 𝑉∞2 = 𝐶𝐿𝑚𝑎𝑥(𝑐𝑙𝑒𝑎𝑛)𝑎𝑖𝑟𝑐𝑟𝑎𝑓𝑡· 𝜌𝑠𝑙· 𝑆(𝑐𝑙𝑒𝑎𝑛)𝑎𝑖𝑟𝑐𝑟𝑎𝑓𝑡 2 ∙ 𝑀𝑇𝑂𝑊𝑠𝑙 ∙ 𝑉∞ 2 (4) 𝑀𝑇𝑂𝑊𝑠𝑙= 145 [𝑘𝑔] ∙ 𝑔𝑠𝑙= 145 ∙ 9.81 = 1422.45 [𝑁]
𝑆(𝑐𝑙𝑒𝑎𝑛)𝑎𝑖𝑟𝑐𝑟𝑎𝑓𝑡= 4.057 [𝑚2] Obtained from the 𝑉
𝑠𝑡𝑎𝑙𝑙 equation: 𝑉𝑠𝑡𝑎𝑙𝑙(𝑛) = √ 2 · 𝑛 · 𝑊 𝜌 ∙ 𝑆 ∙ 𝐶𝐿𝑚𝑎𝑥 [𝑚/𝑠] (5) 𝑉𝑠𝑡𝑎𝑙𝑙 2500𝑚= 22.78 [𝑚/𝑠] [21] For 𝑛 = 1, 𝑊 = 𝑀𝑇𝑂𝑊2500𝑚, 𝑆 = 𝑆𝑎𝑖𝑟𝑐𝑟𝑎𝑓𝑡 𝜌2500𝑚= 1[𝑘𝑔/𝑚3] 𝑓𝑜𝑟 𝑇 = −1.24º𝐶 ≡ 271.8º𝐾 𝑀𝑇𝑂𝑊2500𝑚= 145 [𝑘𝑔] ∙ 𝑔2500𝑚= 145 ∙ 9.8 = 1421 [𝑁] 𝐶𝐿𝑚𝑎𝑥= 𝐶𝐿𝑚𝑎𝑥(𝑐𝑙𝑒𝑎𝑛)𝑎𝑖𝑟𝑐𝑟𝑎𝑓𝑡 = 1.35
- Curve from 𝒏 = 𝟎 to NHAA (Negative High Angle of Attack) (Negative Stall Limit):

![Figure 2 – a) The project’s Patch with its moto “ET OBSERVA VOLANT” [9]; b) ANTEX-X02 Alfa, UAS with maximum take of weight (MTOW) of 25 kg [11]; c) UAS30, with MTOW of 30 kg [12]; d) ANTEX-X03, with MTOW of 149 kg [13]](https://thumb-eu.123doks.com/thumbv2/123dok_br/15462948.1031586/28.893.115.781.242.385/figure-project-patch-observa-volant-antex-maximum-weight.webp)
![Figure 11 - Superposition of V-n and V-g diagrams. Figure 12 - Typical combined flight envelope [25]](https://thumb-eu.123doks.com/thumbv2/123dok_br/15462948.1031586/42.893.113.793.519.731/figure-superposition-diagrams-figure-typical-combined-flight-envelope.webp)
![Figure 13 - Limit wing loading conditions as defined by the aircraft flight envelope [31]](https://thumb-eu.123doks.com/thumbv2/123dok_br/15462948.1031586/43.893.122.778.475.684/figure-limit-loading-conditions-defined-aircraft-flight-envelope.webp)
![Figure 20 – a) Comparison between the Stress-Strain curves of different materials [41]; b) Stress-Strain curves for different fibers and for epoxy resin, allowing to compare typical stress and strain failure values [42]](https://thumb-eu.123doks.com/thumbv2/123dok_br/15462948.1031586/57.893.147.739.762.950/figure-comparison-stress-strain-different-materials-different-allowing.webp)

![Figure 31 – Delamination of unidirectional fiber reinforced laminate: a) Original image; b) Image segmented by using neuronal network; c) Identification of the delamination region [54]](https://thumb-eu.123doks.com/thumbv2/123dok_br/15462948.1031586/65.893.122.785.175.326/delamination-unidirectional-reinforced-laminate-original-segmented-identification-delamination.webp)