Regionalization of droughts in Portugal
J. F. Santos
1, M. M. Portela
2, I. Pulido-Calvo
31
ESTIG, Portugal, joaof.santos@estig.ipbeja.pt;
2IST, Portugal,
mps@civil.ist.utl.pt;
3UHU, Spain, ipulido@uhu.es
Abstract
Droughts are complex natural hazards that distress large worldwide areas every year with serious impacts on society, environment and economy. Despite their importance they are still among the least understood extreme weather events. This paper is focused on the identification of regional patterns of droughts in Mainland Portugal based on monthly precipitation data, from September 1910 to October 2004, in 144 rain gages distributed uniformly over the country. The drought events were described by means of the Standardized Precipitation Index (SPI) applied to different time scales. To assess the spatial and temporal patterns of droughts, a principal component analysis (PCA) and K-means clustering method (KMC) were applied to the SPI series. The study showed that, for the different times scales, both methods resulted in an equivalent areal zoning, with three regions with different behaviours: the north, the centre and the south of Portugal. These three regions are consistent with the precipitation spatial distribution in Portugal Mainland, which in general terms decrease from North to South, with the central mountainous region representing the transition between the wet north and the progressively dry south. As the mean annual precipitation decreases southwards the hydrological regime becomes more irregular and consequently more prone to droughts.
Keywords: Standardized Precipitation Index (SPI), principal component analysis
(PCA), clusters analysis.
1
Scope. Data base
and a non-hierarchical clustering method (KMC), to a drought index, the Standardized Precipitation Index (SPI), Santos et al. [15].
Droughts are still among the least understood extreme weather natural events affecting large worldwide areas and having serious impacts on society, economy and environment. The costs estimated for Portugal from the 2005 drought – which was considered the worst drought in the last 60 years and affected 80% of the country – were 285 million Euros, being half of this amount related with losses from the hydroelectric power production sector.
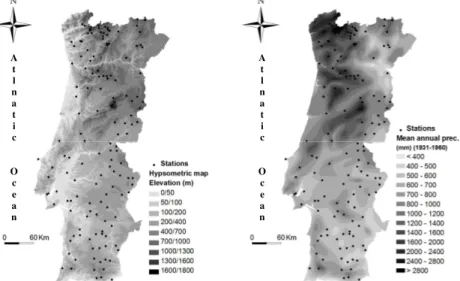
Mainland Portugal is located on the western part of the Iberian Peninsula (approx. area of 89 000 km2) being influenced by the Atlantic and Mediterranean climatic zones. It is characterized by strong precipitation variability, both in time and in space, the driest regions having the highest relative temporal variability. In average, 75% of the precipitation occurs during the wet semester, from October to March. The mean annual precipitation varies from more than 2800 mm, in the north-western region, to less than 400 mm, in the southern region, following a complex spatial pattern (N–S/E–W) (Figure 1), in close connection with the relief, far beyond the most determinant factor of the precipitation pattern (see Figure 1). The precipitation variability results in frequent shortages of water that, in turn, pose a great threat to nature, quality of life and economy and originate increasing conflicts among competing water users.
Figure 1: Relief and mean annual precipitation in Mainland Portugal (the dots represent the location of the 144 rain gages that supported the study).
The characterization of the drought occurrences in Mainland Portugal and the understanding of the historical and recent climatic variability, can utilize long-term time series of precipitation regarding their non homogeneous climatic
A t l n a t i c
O c e a n
A t l n a t i c
and hydrological conditions. This was the perspective adopted in this paper which utilized 94-years of precipitation data, from 1910/11 to 2003/04 (hydrologic years starting October 1st), in 144 rain gages uniformly distributed over the country, as schematized in Figure 1, Santos; Portela [13].
2
The Standardized Precipitation Index, SPI
To assess the multi-scale drought occurrences in Portugal the Standardized Precipitation Index (SPI), originally developed by McKee et al. [9], was applied to the precipitation time series. The SPI has become the most popular drought index during the last two decades, Vicente-Serrano [20], due to its several advantages, such as: (a) great flexibility, as it can be applied at different time scales, Edwards; McKee [3]; (b) less complexity, comparatively to other indexes, as it requires relatively simple and well set calculations, Guttman [4], [5]; (c) adaptability to hydro-climatologic variables besides precipitation, López-Moreno et al. [8], Santos; Portela [14]; and (d) suitability to spatial representation, allowing comparison between areas within the same region, as it is a normalized index, Hayes et al., [6], Vicente-Serrano [20], Bordi et al. [2]. The SPI calculated at 1 month is mainly a meteorological drought index, at time scales between 3 and 6 months it can be considered an agricultural drought index and at time scales between 6 and 12 months it is considered a hydrological drought index, Hayes et al. [6], becoming useful for monitoring the surface water resources.
To ascertain the variability of both spatial and temporal patterns for different types of droughts, different time scales of SPI were used in the analysis carried out for Mainland Portugal, namely 1 (SPI1), 6 (SPI6) and 12 (SPI12) consecutive months; at 6 months of the dry season (April to September, SPI6Apr-Sep); and at 12 months of the hydrologic year (October to September,
SPI12Oct-Sep). SPI1, SPI6 and SPI12 account for the subannual variability of
droughts and SPI6Apr-Sep and SPI12Oct-Sep for the interannual variability.
Originally, McKee et al. [9], adjusted a Gamma distribution function to the precipitation series to compute the SPI index. Afterwards, other authors tested several distributions based on different time scales and concluded that the Pearson type III distribution ensured the best fit. This circumstance can be explained by the higher flexibility of the Pearson type III distribution given by its three parameters in comparison with the Gamma distribution with only two parameters, Guttman [5], Vicente-Serrano [20]. In the study carried out the Pearson type III distribution was also adopted.
Table 1: Drought categories according to the SPI values, Agnew [1].
Non-exceedance probability SPI Drought category
0.05 >1.65 Extremely wet
0.10 >1.28 Severely wet
0.20 >0.84 Moderately wet
0.60 >-0.84 and <0.84 Normal
0.20 <-0.84 Moderate drought
0.10 <-1.28 Severe drought
0.05 <-1.65 Extreme drought
3
Principal components and non-hierarchical cluster analysis
To identify the drought patterns in Mainland Portugal the principal component analysis (PCA) and non-hierarchical cluster analysis were applied to the SPI series by means of the Statistica 7.0 software.
The principal component analysis (PCA) is a common way of identifying patterns in climatic data, and expressing the data in such a way as to highlight their similarities and differences, Smith [18]. The PCA method can also be defined, Lins [7], Singh et al. [17], as a technique applied to multivariate analysis for dimensionality reduction, emphasizing patterns on data and relations between variables and between variables and observations. The original intercorrelated variables are reduced to a small number of new linearly uncorrelated ones that explain most of the total variance, Rencher [10].
To achieve more stable spatial patterns, a rotation of the principal components with the Varimax procedure was applied. This procedure provides a clearer division between components, preserves their orthogonality and produces more physically explainable patterns, Richman [12]. The patterns defined in this way are referred as rotated principal components (RPCs).
The cluster analysis technique, similarly to the PCA method, was chosen for its ability to divide the data set into homogeneous and distinct groups having members with similar characteristics, Shukla et al. [16]. Cluster analysis is a generic term for a variety of statistical methods that can be used to evaluate the similarity of individual objects in a set. A simple example would be gathering a set of pebbles of different size, shape, and colour from a stream shore and sorting similar pebbles into the same pile. This is an example of physical cluster analysis. Statistical methods of cluster analysis achieve this mathematically. Based on the SPI values, the rain gages are grouped homogeneously so that similar SPI variations at different time scales are assigned to the same group, while different variations are grouped separately.
The mathematical criterion applied to calculate the classification and to judge the quality of the classification was the K-means clustering method (KMC) which reassigns each observation to a different cluster with the nearest centroid, Rhee
et al. [11]. In general, the K-means method produces exactly K different clusters
results. As result of a K-means clustering analysis, the means for each cluster on each time scale are examined to assess how distinct the K clusters are.
The cluster analysis requires that the number of groups or clusters be established beforehand which is considered one of the major unresolved issues in the cluster analysis since the ideal number of groups is not known a priori. For this reason this study considered different groups, based on the spatial classification obtained with the PCA, which were tested to identify which classification best suited the regional patterns. To evaluate the appropriateness of the classification, the Euclidean distances between clusters was examined.
4
Results: spatial variability of droughts
Based on 94 years of monthly precipitation in the 144 rain gages schematically located in Figure 1, 144 series of Standard Precipitation Indexes were obtained for each time scale. The length of each SPI series is equal to 94x12=1128, 94x12-5=1123, 94x12-11=1117, for the time scales of 1, 6 and 12 continuous months (SPI1, SPI6 and SPI12, respectively) and equal to 94 when referred to the 6 months of the dry semester (SPI6Apr-Sep from April to September) or to the
12 months of the hydrologic year (SPI12Oct-Sep from October to September). For
each time scale, the 144 series of the SPI are comparable as they represent normalized values, according to the SPI underlying concept.
Regarding the PCA and taking into account the variance explained by each rotated component, three main patterns or RPCs, F1, F2 and F3 were identified. These three patterns explain about 75% of the total variance in the original SPI series, for the SPI at 1, 6 and 12 months, and about 70% for the SPI at 6 months from April to September and for the SPI at 12 months from October to September, as shown in Figure 2.
0 5 10 15 20 25 30 35 40 F1 F2 F3 E x p la in e d v a ri a n c e ( % )
Time scale (month) 76.25 75.35 74.73 67.63 70.73
Accumulated explained variance for each time scale (% )
SPI1 SPI6 SPI12 SPI6Apr-Sep SPI12Oct-Sep
Figure 2: Percentage of variance explained by first three components of PCA, F1, F2 and F3.
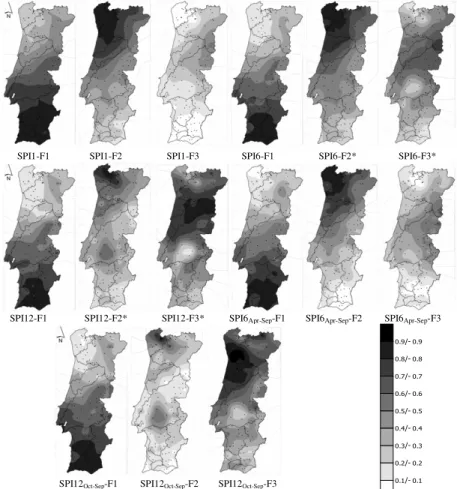
interpolation method. For a given time scale this matrix contains the correlations between each component (F1, F2 or F3) and the SPI series at the 144 rain gages. The results achieved are represented in Figure 3 along with the limits of the main Portuguese watersheds. This figure shows that between the first two components, F1 and F2, the regions with significant correlation (higher than 0.7) do not overlap, being clearly spatially disjunctive. For all the SPI time scales, the first component highlights an area located in the south of Portugal and it explains between 30 and 37% of total variance (Figure 2). This is the component that explains the largest area within Mainland Portugal when comparing with the others components. In some rain gages, the correlations among the values of this component and of the SPI series were higher than 0.8 which means a clear individualized pattern.
SPI1-F1 SPI1-F2 SPI1-F3 SPI6-F1 SPI6-F2* SPI6-F3*
SPI12-F1 SPI12-F2* SPI12-F3* SPI6Apr-Sep-F1 SPI6Apr-Sep-F2 SPI6Apr-Sep-F3
SPI12Oct-Sep-F1 SPI12Oct-Sep-F2 SPI12Oct-Sep-F3
The second component, F2, explains around 30% of the total variance for SPI1, SPI6 and SPI6Apr-Oct, being less important for SPI12 and SPI12Oct-Sep, with less
variance explained than the component three (F3 of Figure 2). Nevertheless, it is overwhelming that F2 is mainly representative of the north-western part of Portugal. For SPI6 and SPI12 this second component relates negatively with the SPI series.
In general terms, the third component F3 highlights a central region which confines with the regions identified by F1 e F2, and it relates negatively with the original series in the case of SPI6, SPI12 and SPI12Oct-Sep.
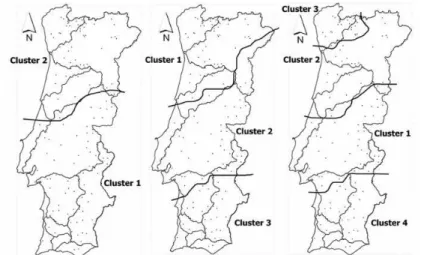
The previous results indicated that with the three main components F1, F2 and F3 a spatial classification is achieved, with two well-defined regions, one located in the north and the other in the south of Portugal and with an intermediate region that promotes the transition from the wet north to the arid and semi arid-south. The spatial classification was similar for all the time scales of SPI. The spatial classification resulting from the cluster analysis is exemplified in Figure 4 for SPI6Apr-Sep, considering two, three and four classification groups.
Figure 4: SPI6Apr-Sep series. Comparison of clusters analysis with: (a, left side)
two; (b, centre) three; and (c, right side) four classification groups.
To evaluate the appropriateness of the classifications, the Euclidean distances between clusters were examined. The results show that the best grouping is with three clusters. Accordingly the three different regions represented in Figure 4b were adopted. Despite the fact that, comparatively to the PCA, there is a central region clearly delimited (cluster 2), the spatial classification that resulted from the cluster analysis is similar to the one obtained with the PCA method for all the SPI time scales (SPI1, SPI6, SPI12, SPI6Apr-Sep and SPI12Oct-Sep), which suggests
5
Application example: temporal evolution of droughts
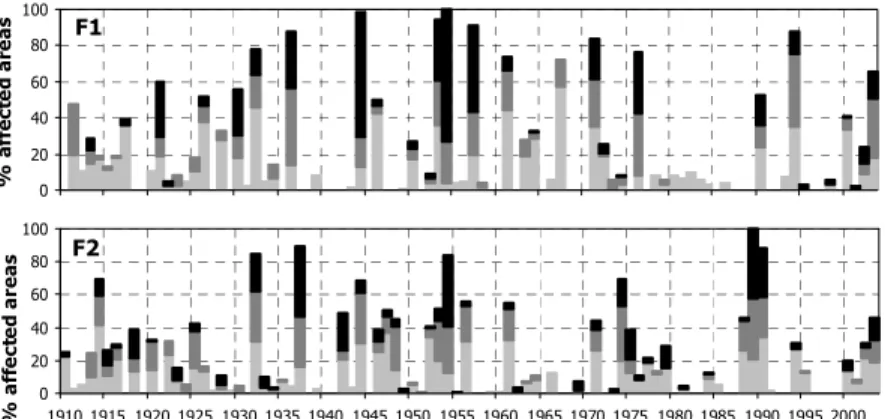
To exemplify how the SPI and the PCA analysis can be combined to characterize the droughts, the seasonal SPI6Apr-Sep series were chosen as they reflect the driest
period in Portugal, from middle spring to end summer. Also, the spatial classification showed that both subannual (SPI1, SPI6 and SPI12) or interannual (SPI6Apr-Sep, SPI12Oct-Sep) time scales of SPI led to similar patterns which makes
valid to exemplify the analysis based on one of those scales.
By delimiting the areas with correlations, according to the PCA analysis, higher than 0.7, the percentages of area affected by moderate, severe and extreme drought (for the SPI categories of Table 1) were computed. For that purpose an influence area was assign to each rain gage by applying the Thiessen polygon method. The area attributed to a specified drought category was given by the cumulative areas of the rain gages with values of SPI6Apr-Sep within the limits that
define such drought category.
The results achieved – which are presented in Figure 5 – show that the southern part of Portugal (F1) is more affected by drought events than the north-western part (F2). From 1910 to 2004 the number of events affecting more than 50% of the area was 17 in south and 12 in the north. From 1910 to 1930, 20% of the southern region was frequently affected by droughts of moderate category, whereas the rest of the period experienced less drought events but with episodes with very high intensity, especially in mid 1950s where the drought affected the entire southern region (100%) and even had reflexes in the northern region. In this last region a three year isolated episode took place from 1988 to 1990, being that the 1989 drought affected the all area (100%). The most widespread extreme droughts occurred in the southern region with 69% and 73% of area affected in 1944 and 1954, respectively, and in the northern region with 43% in 1954 and 1989.
6
Conclusions
One of the first steps for managing drought risk assessment comprehends the identification of regions with similar pattern regarding the shortage of water. To achieve this purpose for Mainland Portugal the principal component analysis (PCA) and non-hierarchical cluster analysis (KMC) were applied to the series of the Standardized Precipitation Index (SPI) at different time scales computed from 94-years (from October 1910 to September 2004) of monthly precipitation in 144 Portuguese rain gages.
The study showed that, for the different times scales, both methods resulted in an equivalent areal zoning, with three regions with different behaviours: the north, the centre and the south of Portugal. Such three regions are consistent with the precipitation spatial distribution in Portugal Mainland, which in general terms decrease from North to South, with the central mountainous region representing the transition between the wet north and the progressively dry south. As the precipitation decreases the hydrological regime becomes more irregular and consequently more prone to droughts.
The similarity of the results achieved by PCA and the KMC analysis were an indicative that both methods can be used for drought classification purposes, regarding spatial and temporal pattern analysis. However, the not so clear procedure of evaluating the optimum number of clusters based on the Euclidean distances, reinforces the idea that the loadings produced by PCAs provide a more clear and simple method to recognize distinct temporal patterns.
References
[1] Agnew, C. T. (2000), “Using the SPI to identify drought”, Drought
Network News, 12, 6-12.
[2] Bordi, I.; F. W. Fraedrich; F. W. Gerstengarbe; C. Werner; A. Sutera (2004), “Spatio-temporal variability of dry and wet periods in eastern China”, Theoretical and Applied Climatology, 77, 125-138.
[3] Edwards, D. C.; T. B. McKee (1997), “Characteristics of 20th century drought in the United States at multiple time scales”, Atmospheric Science Paper no. 634, Colorado State Univ., Fort Collins, USA.
[4] Guttman, N. B. (1998), “Comparing the Palmer drought index and the Standardized Precipitation Index”, Journal of the American Water
Resources Association, 34, 113-121.
[5] Guttman, N.B. (1999), “Accepting the standardized precipitation index: a calculation algorithm”, Journal of the American Water Resources
Association, 35, 311-322.
[6] Hayes, M.; D. A. Wilhite; M. Svodoba; O. Vanyarkho (1999), “Monitoring the 1996 drought using the standardized precipitation index”, Bulletin of
the American Meteorological Society, 80, 429-438.
[8] López-Moreno, J. I.; S. M. Vicente-Serrano; S. Beguería; J. M. García-Ruiz; M. M. Portela; A. B. Almeida (2009), “Dam effects on droughts magnitude and duration in a transboundary basin: the lower River Tagus, Spain and Portugal”, Water Resources Research, 45, W02405, doi:10.1029/2008WR007198.
[9] McKee, T. B.; N. J. Doesken; J. Kleist (1993), “The relationship of drought frequency and duration to time scales”, in Proceedings of the 8th
Conference on Applied Climatology, American Meteorology Society,
179-184.
[10] Rencher, A. C. (Eds.) (1998), Multivariate statistical inference and
applications, John Wiley and Sons, INC, New York, USA.
[11] Rhee, J.; J. Im; G. J. Carbone; J. R. Jensen (2008), “Delineation of climate regions using in-situ and remotely-sensed data for the Carolinas”, Remote
Sensing of Environment, 112, 3099-3111.
[12] Richman, M. B. (1986), “Rotation of principal components”, Journal of
Climatology, 6, 29-35.
[13] Santos, J. F.; M. M. Portela (2008), “Quantificação de tendências em séries de precipitação mensal e anual em Portugal Continental”, Seminário
Ibero-Americano sobre Sistemas de Abastecimento Urbano SEREA,
Lisbon, Portugal.
[14] Santos, J.F.; M.M. Portela (2010), “Caracterização de secas em bacias hidrográficas de Portugal Continental: aplicação do índice de precipitação padronizada, SPI, a séries de precipitação e de escoamento”, 10º
Congresso da Água, APRH, Alvor, Portugal.
[15] Santos, J.F.; I. Pulido-Calvo; M.M. Portela (2010), “Spatial and Temporal Variability of Droughts in Portugal”, Water Resources Research, 46, W03503, doi:10.1029/2009WR008071.
[16] Shukla, S.; S. Mostaghimi; M. Al-Smadi (2000), “Multivariate technique for baseflow separation using water quality data”, Journal of Hydrology
Engineering, 5(2), 172-179.
[17] Singh, P. K.; V. Kumar; R. C. Purohit; M. Kothari; P. K. Dashora (2008), “Application of principal component analysis in grouping geomorphic parameters for hydrologic modeling”, Water Resources Management, 23, 325-339.
[18] Smith, L. I. (Eds.) (2002), A tutorial on Principal Components Analysis, Computer sciences, 26, University of Otago, New Zealand.
[19] Vicente-Serrano, S. M. (2005), “Las sequías climáticas en el valle medio del Ebro: Factores atmosféricos, evolución temporal y variabilidad espacial”, in Serie investigación 49, edited by Publicaciones de Consejo de Protección de la Naturaleza de Aragón, Zaragoza, Spain.
![Table 1: Drought categories according to the SPI values, Agnew [1].](https://thumb-eu.123doks.com/thumbv2/123dok_br/18759559.404662/4.918.294.621.229.342/table-drought-categories-according-spi-values-agnew.webp)