National Survey on Access, Use and
Promotion of Rational Use of Medicines
(PNAUM): household survey component
methods
Sotero Serrate MengueI, Andréa Dâmaso BertoldiII, Alexandra Crispim BoingIII, Noemia Urruth Leão TavaresIV, Tatiane da Silva Dal PizzolV, Maria Auxiliadora OliveiraIV, Paulo Sérgio Dourado ArraisVII, Luiz Roberto RamosVIII, Mareni Rocha FariasIX, Vera Lucia LuizaVI, Regina Tomie Ivata BernalX, Aluísio Jardim Dornellas de BarrosII
I Programa de Pós-Graduação em Epidemiologia. Faculdade de Medicina. Universidade Federal do Rio Grande
do Sul. Porto Alegre, RS, Brasil
II Departamento de Medicina Social. Faculdade de Medicina. Universidade Federal de Pelotas. Pelotas, RS, Brasil III Departamento de Saúde Pública. Centro de Ciências da Saúde. Universidade Federal de Santa Catarina.
Florianópolis, SC, Brasil
IV Departamento de Farmácia. Faculdade de Ciências da Saúde. Universidade de Brasília. Brasília, DF, Brasil V Departamento de Produção e Controle de Medicamentos. Faculdade de Farmácia. Universidade Federal do Rio
Grande do Sul. Porto Alegre, RS, Brasil
VI Departamento de Política de Medicamentos e Assistência Farmacêutica. Escola Nacional de Saúde Pública
Sérgio Arouca. Fundação Oswaldo Cruz. Rio de Janeiro, RJ, Brasil
VII Departamento de Farmácia. Faculdade de Farmácia, Odontologia e Enfermagem. Universidade Federal do
Ceará. Fortaleza, CE, Brasil
VIII Departamento de Medicina Preventiva. Escola Paulista de Medicina. Universidade Federal de São Paulo. São
Paulo, SP, Brasil
IX Departamento de Ciências Farmacêuticas. Centro de Ciências da Saúde. Universidade Federal de Santa
Catarina. Florianópolis, SC, Brasil
X Núcleo de Pesquisas Epidemiológicas em Nutrição e Saúde. Departamento de Nutrição. Faculdade de Saúde
Pública. Universidade de São Paulo. São Paulo, SP, Brasil
ABSTRACT
OBJECTIVE: To describe methodological aspects of the household survey National Survey on Access, Use and Promotion of Rational Use of Medicines(PNAUM) related to sampling design
and implementation, the actual obtained sample, instruments and ieldwork.
METHODS: A cross-sectional, population-based study with probability sampling in three stages of the population living in households located in Brazilian urban areas. Fieldwork was carried out between September 2013 and February 2014. he data collection instrument included
questions related to: information about households, residents and respondents; chronic diseases
and medicines used; use of health services; acute diseases and events treated with drugs; use of contraceptives; use of pharmacy services; behaviors that may afect drug use; package inserts and packaging; lifestyle and health insurance.
RESULTS: In total, 41,433 interviews were carried out in 20,404 households and 576 urban clusters corresponding to 586 census tracts distributed in the ive Brazilian regions, according to eight domains deined by age and gender.
CONCLUSIONS: he results of the survey may be used as a baseline for future studies aiming to assess the impact of government action on drug access and use. For local studies using a
compatible method, PNAUM may serve as a reference point to evaluate variations in space and
population. With a comprehensive evaluation of drug-related aspects, PNAUM is a major source of data for a variety of analyses to be carried out both at academic and government level.
DESCRIPTORS: Drug Utilization, statistics & numerical data. Pharmaceutical Services, supply & distribution. Sampling Studies. Health Surveys, methods.
Correspondence:
Sotero Serrate Mengue Rua Ramiro Barcelos, 2600/418 90035-003 Porto Alegre, RS, Brasil E-mail: [email protected]
Received: 30 Jan 2015
Approved: 16 Aug 2016
How to cite: Mengue SS, Bertoldi AD, Boing AC, NUL Tavares, da Silva Dal Pizzol T, Oliveira MA, et al. National Survey on Access, Use and Promotion of Rational Use of Medicines (PNAUM): household survey component methods. Rev Saude Publica. 2016;50(suppl 2):4s.
Copyright: This is an open-access article distributed under the terms of the Creative Commons Attribution License, which permits unrestricted use, distribution, and reproduction in any medium, provided that the original author and source are credited.
INTRODUCTION
Government investment in health has increased in recent years. Brazilian Ministry of Health (MH) expenditure with medicines has accompanied this growth, ranging from R$1.8 billion to R$12.4 billion between 2003 and 2014, while maintaining the average budget ratio of about 14.0%4. Adjusting for inlation over the period, there was a 3.6 times increase in real value.
Despite increased spending on medicines, no assessment of its impact on drug access and
use by the Brazilian population was heretofore available.
Strategies to evaluate drug access policies involve various aspects, ranging from
macroeconomic issues to the obtainment and use of these drugs by the population.
Evaluation of drug use and access in several countries has been based on models of drug
supply, which can be via free provision, health insurance coverage, refund or direct paymenta.
National health studies in Brazil date back to 1981, with the irst health supplement of the
Pesquisa Nacional de Amostra por Domicílio (PNAD – National Household Sample Survey), repeated in 1986, 1998, 2003 and 2008b,c. he various PNAD editions were limited to surveying
medicines of long-term use and their forms of access. In the 2013 Pesquisa Nacional de Saúde
(PNS – National Survey on Health)d, information on obtaining medicines is equivalent to
that of PNAD, but with separate information for diabetes and high blood pressure14. he biggest limitation to evaluating drug use in health surveys has been the level of detail.
Besides the fact that the surveys must address a broad number of topics, measuring drug use
is complex and involves many diiculties, from recording drug names correctly to questions on the various reasons for using medicines and how they are obtained.
Given this situation, the Brazilian Ministry of Health proposed in 2009 the development of the irst national survey on drug access and use: Pesquisa Nacional Sobre Acesso, Utilização e Promoção do Uso Racional de Medicamentos (PNAUM – National Survey on Access, Use
and Promotion of Rational Use of Medicines). his survey was established by ordinance GM/MS 2077 from September 17, 2012 to address the need of information related to drug access, use and rational use in Brazil, in accordance with MH strategic objectives, which
include ensuring pharmaceutical services and reducing inadequate access to health and
pharmaceutical services provided by the Brazilian Uniied Health System (SUS)e.
PNAUM was organized into two components: 1) household survey on drug access, use and rational use, the focus of this article, and 2) evaluation of public policies for pharmaceutical services and their implementation in SUS Primary Care Health. he PNAUM household
survey aimed to evaluate the use of medicines by the Brazilian population, characterizing
the morbidities for which they are used, access indicators and rational use of drugs according to demographic, socioeconomic, lifestyle and morbidity variables.
This article aims to describe methodological aspects of the household survey related
to sampling design and implementation, instruments and fieldwork, as well as the sample obtained.
METHODS
PNAUM is a cross-sectional, population-based study with probability sampling, carried out between September 2013 and February 2014 in urban households at national level. he survey was restricted to the urban population due to logistics diiculties and the additional cost involved in studying rural areas.
Sample Design
he medicine use varies according to age and gender regarding the amount and type of medication, and it is essential to ensure accurate estimates of both groups. hus, the sample a Brasil, Conselho Nacional de
Secretários de Saúde. O desafio do acesso aos medicamentos nos sistemas públicos de saúde: relatório do Seminário Internacional de Assistência Farmacêutica do CONASS. 2010 [cited 2015 Jan]. Available from: http://www.conass.org.br/ conassdocumenta/cd_20.pdf
b Instituto Brasileiro de Geografia
e Estatística. Pesquisa nacional por amostra de domicílios. Rio de Janeiro (RJ): IBGE; 2003.
c Instituto Brasileiro de Geografia
e Estatística. Pesquisa nacional por amostra de domicílios. Rio de Janeiro (RJ): IBGE; 2008.
d Instituto Brasileiro de Geografia
e Estatística. Pesquisa Nacional de Saúde 2013: percepção do estado de saúde, estilos de vida e doenças crônicas - Brasil, Grandes Regiões e Unidades da Federação. Rio de Janeiro (RJ): IBGE; 2014.
e Ministério da Saúde. Secretaria
included eight demographic domains: (1) ages 0-4, both genders; (2) ages 5-19, both genders; (3) ages 20-39, female; (4) ages 20-39, male; (5) ages 40-59, female; (6) ages 40-59, male; (7) ages 60 or over, female; (8) ages 60 or over, male.
The demographic domains were replicated for each of the major Brazilian geographical regions, resulting in 40 sampling domains, ensuring the accuracy of indicators of interest for the subgroups selected within each region. Sample size was defined based on estimates obtained from the 2008 PNAD. These estimates were: 34.0% of totally free access to medications, 44.0% of paid access and the remainder of mixed access. Also used was a 12.0% estimate of lack of access to needed medicines. The precision criterion was set at 0.05, the maximum value for variation coefficients from the estimates of interest. This resulted in a minimum sample size of 960 interviews per sampling domain, totaling 38,400 interviews.
he sample was drawn from clusters in three stages: municipality (primary sampling unit), census tract and household. he municipalities were selected by systematic sampling with probability proportional to size within each region, totaling 60 clusters for each one of them. Two tracts within each selected municipality were also selected with probability proportional to size. In the third stage, 86, 72, 70, 54 and 61 households were drawn in the North, Northeast, Midwest, Southeast and South regions, respectively. his total is the number of households increased by 10.0% due to refusal. he household draw used the 2010 Cadastro Nacional de Endereços do Censo (National Census Address Register) of the Brazilian Institute
of Geography and Statistics (IBGE). Before the ieldwork, the tracts were visited for a quick household count to detect changes. Tracts with less than 90.0% of update for valid addresses were updated immediately prior to the interview and selection process. he household draw in each domain was based on the expected percentage for each age and gender group. he number of individuals in each group was previously deined in order to compose the sample with the desired numbers. In the sample selection process, 2010 Census data were used as
a source of the number of households and individualsf.
Sampling weights were calculated for individuals, and post-stratiication weights were used to reduce the bias resulting from low response rate. hese weights were calculated by the raking method, using the population distribution estimated by the PNS according to age
and gender per regiong.
he following categories were used to calculate response rates:
1D - actual sample (household with eligible resident);
2D - incompatible proiles (household without eligible resident);
3D - inexistent, not located or inaccessible household;
4D - closed or abandoned household;
5D - refusal (to report about eligible population in household);
6D - non-residential;
7D - not visited (diference between number of addresses predicted and visited).
he response rate for households (TRD) was calculated by:
TRD = 1- 3D + 4D + 5D + 7D 1D + 2D + 3D + 4D + 5D + 7D
Non-residential households were excluded from the calculation, as vacant households should also have been. he latter were not excluded for lack of information about them. Closed households (considered non-responsive) and abandoned households were included in a single category.
f Instituto Brasileiro de Geografia
e Estatística. Censo demográfico 2010: características da população e dos domicílios: resultado do universo. Rio de Janeiro (RJ): IBGE; 2011.
g Flores-Cervantes I, Brick
For residents, the response rate (TRM) was calculated by:
TRM = 1M
2M
1M - Interviewed resident
2M - Eligible resident
Based on the DHS (Demographic and Health Surveys - Phase IIIh) sampling manual, the
following was used as overall response rate:
TR = TRD * TRM
In some demographic domains by region, the originally planned sample size was not obtained. hus, a post-stratiication process was carried out by applying to the sample observations the weights related to the new sampling fractions adjusted by region, gender and age, following the Brazilian population distribution from the 2013 PNS. his procedure ensured a sample distribution consistent with the distribution of the Brazilian population.
Survey Instruments
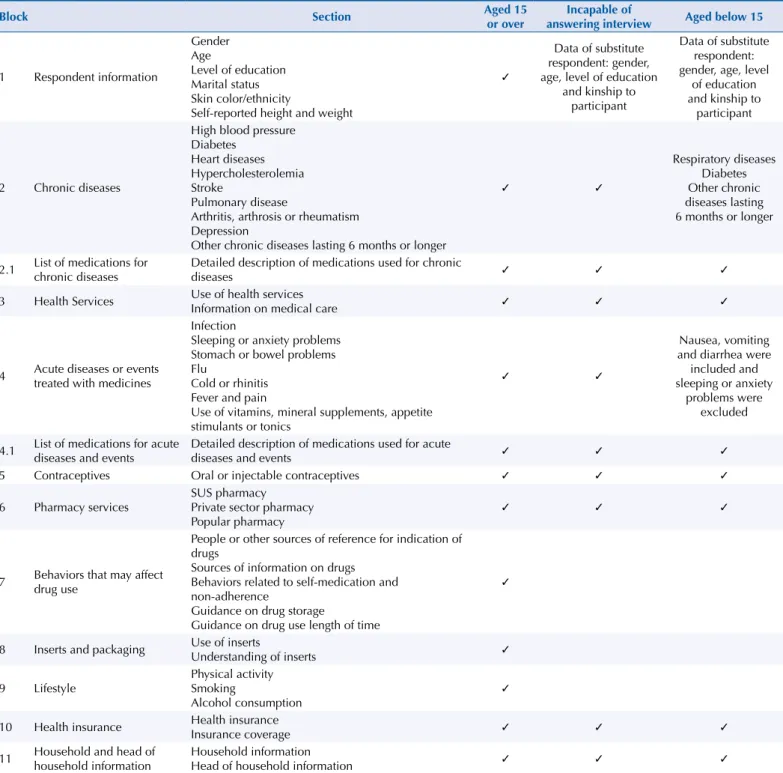
A questionnaire for adults was developed with 11 blocks. his questionnaire was adapted to be answered by the person responsible for the care of children and incapable people (Table 1). Full versions of the questionnaires used are available on the PNAUM website (http://www. ufrgs.br/pnaum).
Before the actual interview, the name, gender and age of all household residents were recorded. This information was used to identify the domains to be interviewed at that household.
For “children” (persons below 15 years of age), blocks 2 and 4 were adapted and blocks 5, 7, 8 and 9 were not used. Blocks 5, 7, 8 and 9 were not used for incapable people either, deined
here as those unable to communicate or self-report information due to physical or mental
illness, speech impediment or lack of discernment to answer questions.
he irst block features respondent data related to the three groups of people. he second investigates chronic diseases and the current use of drugs in each disease. he selection of the reasons for drug use was based on the most prevalent health problems in the population and the 2008 PNAD Health assessment (IBGE)i. Respondents were asked about the existence of medical diagnosis: high blood pressure, diabetes, heart diseases, hypercholesterolemia,
stroke, lung disease, arthritis, arthrosis or rheumatism, depression and other chronic diseases lasting six months or longer. For each medication, detailed information was collected about the product (generic, expiry date, dosage form, concentration) and its use (length of time, dosage, source, among other information). To identify adherence barriers related to therapy,
beliefs and memories regarding the long-term use of medications, the Brief Medication Questionnaire (BMQ)1 was used.
he third block investigates the types of health services used. Block 4 contains questions about the use of drugs in the previous 15 days for acute events or diseases. For each medicine, a set of questions was asked to obtain detailed information.
To record data on drugs reported in blocks 2 and 4, respondents were asked to show all “medicines” being use. Any product used to cure or alleviate diseases, symptoms, discomfort or mild illness was considered medicine. hus, a medicine could be a compounded or processed drug or herbal tea, homeopathic product or medicinal plant, for example.
Block 5 investigates the current use and access to oral and injectable contraceptives, including means of obtainment and name of product, as well as data on side efects and treatment adherence among women aged 15 to 49. he questions were adapted from the 2006 Pesquisa
Nacional de Demograia e Saúde (National Demographics and Health Survey)j.
h Macro International Inc.
Demographic and health survey, phase III: sampling manual. Maryland: Macro International Inc; 1996 [cited 2016 Aug 9]. (DHS-III basic documentation, n6). Available from: http:// dhsprogram.com/pubs/pdf/ AISM5/DHS_III_Sampling_ Manual.pdf
i Instituto Brasileiro de Geografia
e Estatística. Pesquisa nacional por amostra de domicílios. Rio de Janeiro (RJ): IBGE; 2008.
j Ministério da Saúde. Centro
Brasileiro de Análise e
Block 6 was designed to identify in detail the sources for obtaining diferent drugs, given that individuals may use various services to obtain all medications needed. Block 7 features questions to evaluate behaviors that may afect drug use. Block 8 investigates respondents’ habits regarding the reading of the package inserts and drug storage, containing questions adapted from Didonet and Mengue (2008) and Silva et al. (2000)12.
Block 9 contains questions related to the use of tobacco and alcohol, based on the 2011
Vigitelk, and to physical activity based on the Global Physical Activity Questionnaire – GPACl.
Block 10 asks whether the respondent has health insurance or not and the items covered, especially medications.
he last block, consisting of two sections, was used to collect household information. he irst section gathered information such as household goods, furniture, household
income and number of rooms in order to apply the Critério de Classiicação Econômica Brazil
k Ministério da Saúde. Secretaria
de Vigilância em Saúde. Secretaria de Gestão Estratégica e Participativa. Vigitel Brasil 2010: vigilância de fatores de risco e proteção para doenças crônicas por inquérito telefônico. Brasília (DF): Ministério da Saúde; 2011. p. 152.
l World Health Organization
(WHO). Chronic diseases and health promotion: global physical activity surveillance. Geneva: World Health Organization; 2007 [cited 2016 Aug 9]. Available from: http://www.who.int/chp/ steps/GPAQ/en/
Table 1. Breakdown of questionnaires administered to individuals aged > 15, incapable or aged < 14, by blocks. PNAUM, Brazil, 2104.
Block Section Aged 15
or over
Incapable of
answering interview Aged below 15
1 Respondent information
Gender Age
Level of education Marital status Skin color/ethnicity
Self-reported height and weight
✓
Data of substitute respondent: gender, age, level of education
and kinship to participant
Data of substitute respondent: gender, age, level
of education and kinship to
participant
2 Chronic diseases
High blood pressure Diabetes
Heart diseases Hypercholesterolemia Stroke
Pulmonary disease
Arthritis, arthrosis or rheumatism Depression
Other chronic diseases lasting 6 months or longer
✓ ✓
Respiratory diseases Diabetes Other chronic diseases lasting 6 months or longer
2.1 List of medications for chronic diseases
Detailed description of medications used for chronic
diseases ✓ ✓ ✓
3 Health Services Use of health services
Information on medical care ✓ ✓ ✓
4 Acute diseases or events treated with medicines
Infection
Sleeping or anxiety problems Stomach or bowel problems Flu
Cold or rhinitis Fever and pain
Use of vitamins, mineral supplements, appetite stimulants or tonics
✓ ✓
Nausea, vomiting and diarrhea were included and sleeping or anxiety
problems were excluded
4.1 List of medications for acute diseases and events
Detailed description of medications used for acute
diseases and events ✓ ✓ ✓
5 Contraceptives Oral or injectable contraceptives ✓ ✓ ✓
6 Pharmacy services
SUS pharmacy
Private sector pharmacy Popular pharmacy
✓ ✓ ✓
7 Behaviors that may affect drug use
People or other sources of reference for indication of drugs
Sources of information on drugs Behaviors related to self-medication and non-adherence
Guidance on drug storage
Guidance on drug use length of time
✓
8 Inserts and packaging Use of inserts
Understanding of inserts ✓
9 Lifestyle
Physical activity Smoking
Alcohol consumption
✓
10 Health insurance Health insurance
Insurance coverage ✓ ✓ ✓
11 Household and head of household information
Household information
(CCEB – Brazilian Economic Classiication Criterion) of Associação Brasileira das Empresas de
Pesquisa (ABEP – Brazilian Association of Survey Companies). he second section gathered sociodemographic information of the head of household.
he interview lowchart according to the order of blocks is described in the Figure.
Fieldwork
Team and Structure
he ield team was formed by coordination core, operational support team, and interviewers. he coordination core was responsible for overseeing all collection processes and stages. he operational support team carried out ield supervision and provided logistics and administrative support to the teams gathering data. A support center was also set up to clarify doubts and solve operational problems, working full time throughout the research.
Two-hundred and seventeen potential interviewers were trained, 165 of whom took part in the actual data collection. A three-day training was given by the operational support team and PNAUM researchers. he training was organized into six diferent groups according to the Brazilian region where the interviews were done.
Pilot
To test ield logistics, six pilot studies were carried out, one in each state capital where the training took place, totaling 251 interviews. Items tested at this point included the data collection instrument, support manual, data recording software, tablet operation and data transmission used in the ieldwork stage.
Survey Disclosure Strategies
Knowledge of the study by the population and institutional support of health and social assistance departments could facilitate interviewers’ contact with respondents and increase
TCLE
Respondent information Chronic diseases
List of medications for chronic diseases
Pharmacy services Behaviors that may
affect drug use Inserts and packaging
Lifestyle Health insurance Information on household
and head of household Health services
Acute diseases and events treated
with drugs
List of medications for acute diseases
and events
Is the respondent female, aged 15 to 49?
Contraceptives
End of visit Does the
respondent have any chronic diseases?
Did he/she report the use of any medicine to treat this(these) chronic
event(s)? Did he/she report
the use of any medicine to treat this(these) chronic disease(es)? Yes
Yes
Yes No
No
Yes
No No
TCLE: Informed consent
participation. hus, brochures, posters and letters explaining the survey were distributed at the locations drawn for data collection, and the Health Hotline (136) was used for the population to conirm the veracity of the survey.
Data Collection
Having the required number of households per census tract was essential for the household draw. hus, 124 census tracts required previous inventory due to the lack of updated information on the total number of households.
In households with eligible age groups, the interviewer would identify all residents through the person available at the irst contact and carry out the interview with individuals from the selected age group. he household questions were answered by the head of household, while those related to the other blocks were answered individually by the respondents. In the case of children under 15 and incapable persons, the interview was conducted with the person named as responsible for their medication.
Quality Control
he quality control of the interviews was carried out through re-interviews with part of the
sample, regular analysis during the survey of the frequency of investigated variables, and
analysis of database consistency.
he re-interviews were conducted through telephone calls, using a standardized questionnaire with drawn respondents. his stage involved 5.123 re-interviews, corresponding to 12.0% of the sample. he reproducibility of variables was tested from the answers, and Kappa values were obtained showing a high level of agreement, ranging from 0.723 to 0.879.
Moreover, variable frequencies were monitored throughout the whole ieldwork, related to
sociodemographic data, self-reported diseases, health service use, drug use, lifestyle, health
insurance and assets. he values obtained were routinely compared with the most recent results of national surveys.
Ethical Aspects
PNAUM was approved by Comissão Nacional de Ética em Pesquisa (National Research
Ethics Commission – Protocol 18947013.6.0000.0008) and Comitê de Ética em Pesquisa da Universidade Federal do Rio Grande do Sul (Research Ethics Committee of the Federal University of Rio Grande do Sul – Protocol 19997). All interviews were conducted after the
respondents or their legal representatives (in the case of incapable persons) had read and
signed the informed consent, with assurance of conidentiality and anonymity.
RESULTS
Response Rates
Response rates for households were between 42.0% and 60.0%, including as losses those households that, despite featuring in the draw list, were not visited because their residents could not be contacted. Among those are temporarily or permanently vacant households, since the survey kept no speciic record for non-visited households. Response rates for individuals were between 82.0% and 97.0%. Overall response rates ranged from 46.6% to 56.1%. Due to the inclusion of vacant homes among losses, response rate values are somewhat underestimated. Table 2 features response rates by demographic domains and region.
Sample Description
he survey interviewed 41,433 people who, following adjustments by region, gender and age, represent approximately 171 million Brazilians living in urban areas of the country. he interviews were conducted in 20,404 households and 576 clusters corresponding to 586 census tracts (10 census tracts were joined to others due to their small size). he numbers of interviews by region and demographic domain are featured in Table 4.
Table 5 features the general characteristics of the sampled population, according to age group, gender, self-reported skin color, level of education, marital status, economic class and geographical region. he Southeast region represented 45.9% of the sample; Northeast, 24.3%; South, 14.3%; Midwest, 7.9%; and North, 7.5%. here was a slight predominance of females (52.8%); 31.9% were aged 20-39; and 46.0% self-reported as white. Blacks and mulattoes combined are the majority among the population (52.5%). Economic bracket C was predominant, accounting for 55.3% of respondents. Of individuals aged 20 or older, 36.1% reported zero to three years of study.
Table 2. Households not visited and response rates, by region and age and gender domain. PNAUM, Brazil, 2014.
Region/Age and gender domain % households
not visited
Response rate/household
Response rate/ individual
Overall response rate
Region
North 12.4 58.8 95.3 56.1
Northeast 17.5 53.6 95.3 50.1
Southeast 10.1 58.1 91.2 53.0
South 17.6 53.5 93.1 49.8
Midwest 34.4 42.4 91.5 38.8
Domain: (age group, gender)
0 to 4 18.1 52.8 95.2 50.2
5 to 19 16.6 60.5 82.8 50.1
20 to 39, male 16.7 58.8 84.0 49.3
20 to 39,
female 19.6 55.1 96.9 53.4
40 to 59, male 19.1 55.1 93.6 51.6
40 to 59,
female 18.9 54.1 96.7 52.3
≥ 60, male 18.1 51.7 90.1 46.6
≥ 60, female 18.1 51.5 93.7 48.3
Table 3. Correlation between average income of tract and overall response rate per domain according to region. PNAUM, Brazil, 2014.
Domain
(age group, gender) Measurements
Region
North Northeast Southeast South Midwest
0 to 4 Correlation -0.14 -0.21 -0.17 -0.23 -0.29
p 0.13 0.03 0.09 0.02 < 0.01
5 to 19 Correlation -0.02 -0.10 -0.06 −0.24 -0.33
p 0.86 0.31 0.58 0.02 < 0.01
20 to 39, male Correlation -0.10 -0.09 -0.23 -0.28 -0.16
p 0.31 0.40 0.02 0.01 0.17
20 to 39, female Correlation -0.21 -0.28 -0.20 -0.36 -0.29
p 0.02 < 0.01 0.04 < 0.01 < 0.01
40 to 59, male Correlation -0.14 -0.28 -0.18 -0.31 -0.26
p 0.13 < 0.01 0.05 < 0.01 0.01
40 to 59, female Correlation -0.21 -0.32 -0.30 -0.24 -0.22
p 0.02 < 0.01 < 0.01 0.01 0.03
60 or over, male Correlation -0.19 -0.32 -0.19 -0.22 -0.35
p 0.04 < 0.01 0.05 0.02 < 0.01
60 or over, female Correlation -0.18 -0.32 -0.25 -0.39 -0.34
DISCUSSION
PNAUM is the irst population-based survey on drug access and use carried out in Brazil with national representation. Previous studies in the area were conducted using diferent methods, diverse target populations and local scope, which hindered comparison of results and limited the generalization of indings to the Brazilian population. he information obtained in this study enables the assessment of drug use proiles and the impact of Brazilian drug policies on access to medicines.
Table 4. Number of interviews made by region and demographic domain. PNAUM, Brazil, 2014.
Region
Domain*
Total Age (years) and gender
0-4 5-19 20-39 20-39 40-59 40-59 ≥ 60 ≥ 60
MF MF M F M F M F
North 1.835 667 552 2.538 1.539 1.778 899 1.115 10.923
Northeast 1.267 618 454 1.881 991 1.521 794 1.268 8.794
Southeast 817 606 533 1.363 1.059 1.267 728 1.125 7.498
South 872 877 562 1.365 1.078 1.299 784 1.009 7.846
Midwest 989 537 336 1.281 839 1.093 554 743 6.372
Total 5.780 3.305 2.437 8.428 5.506 6.958 3.759 5.260
* The domains refer to the age and gender groups (M = male; F = female; MF = male and female).
Table 5. Sample breakdown by demographic and socioeconomic characteristics. PNAUM, Brazil, 2014. (N = 41,433)
Variable Category %a 95%CI
Age group (years)
0-4 6.2 5.9–6.5
5-10 9.1 8.3–9.8
11-19 14.4 13.3–15.5
20-39 31.9 30.4–33.3
40-59 25.3 24.3–26.4
≥ 60 13.2 12.4–14.0
Gender Male 47.2 46.3–48.1
Female 52.8 51.9–53.7
Skin color or ethnicity (self-reported)
White 46.0 43.5–48.6
Black 8.7 7.9–9.7
Mulatto 43.8 41.5–46.1
Yellow 1.1 0.9–1.3
Indigenous 0.4 0.3–0.5
Level of educationb
0-3 years 36.1 34.5–37.7
4-11 years 31.9 30.8–33.0
≥ 12 years 32.0 30.6–33.5
Marital statusb Partner 60.7 59.4–62.1
No partner 39.3 37.9–40.6
CCEBc
A 0.5 0.3–0.9
B 21.9 20.0–23.9
C 55.3 53.7–57.0
D 17.7 16.1–19.5
E 4.6 4.0–5.3
Region
North 7.5 5.9–9.5
Northeast 24.3 20.1–29.1
Southeast 45.9 40.0–52.0
South 14.3 11.5–17.8
Midwest 7.9 6.2–10.0
a Percentage adjusted for sampling weights and post-stratification according to age and gender. b Only adults aged 20 or over.
c Classified according to Critério de Classificação Econômica Brasil 2013 (CCEB 2013 – Brazilian Economic
Studies on drug use can be divided into two groups. he irst performs secondary analyses of databases of direct or refunded payments for medicines. In such cases, the analyses do not address the actual use of drugs nor those acquired outside the health system. hese are the most used studies in developed countries with integrated information systems. he second group performs household surveys, face-to-face or by phone. hese are primarily used in countries that do not have such information systems – generally poorer countries.
In general, the surveys have a restricted approach to individual drug use, either limited to a
group of diseases, with questions such as “use or not,” or providing a list of medicines from which the user is asked to give information11. Others, such as the Australian Health Study, ask for a list of medicines and investigate use for speciic diseasesm.
More detailed, nationwide studies have been conducted in the United States and include the Slone Survey (2004 to 2006) and the Medical Expenditure Panel Survey (MEPS) that, since 1996, collects data on prescription and over-the-counter drugsn.
In countries of Africa, Asia, Latin America and the Caribbean, studies on drug access and use
have been performed using the methodology proposed by the World Health Organization
and also adopted by the Medicines Transparency Alliance (MeTA)8. he model addresses a
comprehensive assessment of drug policy in countries, ranging from government aspects through public and private services to household surveys3.
Some of the methodological challenges and constraints identified in this study are
discussed below.
Comparisons with other national household studies show that response rates are lower than those obtained by the IBGE in the 2013 PNS, in which the response rate was 91.9% for households and 86.0% for individuals, resulting in an overall response rate of 79.0%. However, such comparisons are compromised, since the PNS estimate excluded vacant households. PNAUM, on the contrary, preserved vacant households in the calculation due to the lack of ield records. he Pesquisa Nacional de Saúde Bucalo (National Oral Health Survey) obtained
general response rates ranging from 27.6% in Cuiabá (MT) to 134.3% in Porto Alegre (RS). he study did not describe the overall response rate, but a rough estimate shows that, for people aged 35 to 44, the average overall response rate is 50.0%. For older adults and children, this value was above 80.0%, ranging from 55.0% to 100%.
Response rates in household surveys have shown a steady decline in the last 40 years almost all over the world. In the United States, the National Health Survey Interview showed a decrease in response rate from 92.0% in 1997 to 89.0% in 2004; the National Expenditure Panel Survey, from 78.0% in 1996 to 53.0% in 2014; and the Behavioral Risk Factor Surveillance System, from 71.4% in 1993 to 48.9% in 2000 and 51.1% in 20057. Tolonen et al. observed a reduction in response rate in the Finnish Adult Health Behaviour Survey response rate from 80.0% in 1978 to 60.0% in 2002. In an evaluation of the results of surveys conducted in Europe between 2007 and 2012, Mindell et al.10 considered as good the response rates of 66.0% in England, 54.0% in Germany and 45.0% in the Netherlands.
In previous studies that discuss the reduction of response rates, a few reasons are most frequently suggested. he irst is people’s reaction to a great number of surveys carried out in the most diverse areas, such as market, politics and health. Telephone surveys have particularly bothered people, since they are linked to marketing activities in general. A growing concern with privacy has inluenced the decline in response rates. In PNAUM, part of the population worried greatly about safety, which signiicantly prevented access to residents of larger buildings. his kind of worry seems to be an additional component diminishing the receptivity of people to household surveys.
he quality of information obtained through interviews is a problem to be considered. Of used medicines, 39.0% had no packaging available. In such cases, drug identiication is based solely on report, which requires comprehensive reviews and subsequent correction to m National Health Survey: Users’
Guide – Eletronic. Canberra: Australian Bureau of Statistics; 2009 [cited 2016 Aug 9]. Available from: http://www. ausstats.abs.gov.au/ausstats/ subscriber.nsf/0/CC0FB5A0857 0984ECA25762E0017CF2B/$Fi le/4363055001_2007-08.pdf
n Slone. Epidemiology Center.
Slone SurveyTM. Boston:
Boston University; 2006 [cited 2016 Aug 9]. Available from: http://www.bu.edu/slone/ research/studies/slone-survey/
o Ministério da Saúde. Secretaria
data collection. Approximately 4.0% of all medicines used could not be identiied. In addition
to those, food supplements, or food reported as medicine, medicinal plants and cosmetics
amounted to 4.1%. In some cases, even with the packaging in hand, respondents were not able to link the drugs to each one of the treated diseases. his generated inconsistent information between the declared disease and the therapeutic indication of the drug.
he correct identiication of medicines is a common diiculty in household studies. Contraceptives or vitamins, e.g., are frequently omitted in spontaneous reports on medicines when they are not being used to treat any disease. On the other hand, food supplements and other products are often reported as drugs to treat diseases. It should be noted that some medications have what might be called a “compound name,” with the irst word identifying the product and the second referring to a diferent composition, which results in another pharmaceutical product. At the same time, medicines may come in diferent concentrations, which may relate to diferent uses (such as case of acetylsalicylic acid 345 mg and 500 mg). Additionally, some ixed–dose combinations have diferent proportions in each dosage form. his demands hard work to identify and classify products following data collection to generate the necessary knowledge on the use of those therapeutic resources.
Moreover, respondents’ perception of the deinition of chronic disease demands analysis to produce a classiication that enables the best possible expression of the health conditions
described by people9.
Correct identiication of where the respondents obtained their medicines was a limitation in data collection. here are several ways of obtaining discount drugs, such as customer loyalty programs, which coexist, for example, with the program Aqui tem Farmácia Popular
(Popular Pharmacy Here). At the same time, supply of medicines inanced by SUS can occur in health facilities or public health pharmacies with mixed systems, in which part of the drugs is available in health facilities and part in centralized pharmacies.
he assessment of acute events examined the use of drugs to treat such diseases or their symptoms. Prevalence of these events, treated with non-pharmacological approaches or untreated, was not estimated.
he PNAUM instruments were developed in paper form. he blocks were irst tested separately, with the complete tool assembled for inal testing in a second stage. he electronic device version was developed later and reviewed during the pilot study. Transference of questionnaires to the small-screen tablet system revealed diiculties not observed in the hard copy versions and facilities available only to electronic equipment. his showed that,
at least for this type of survey, electronic versions for testing should be used as soon as
possible in the development of data collection instruments.
he use of these portable electronic devices in data collection also adds more stages to interviewer training. he irst stage deals with the use of the actual equipment. he second covers the speciics of the software used in developing the application. he third stage is when the actual content training begins.
PNAUM fieldwork was carried out by a survey company hired specifically for this investigation. Working with contractors requires special care, especially regarding the schedule of each stage, proper sizing of ield teams, monitoring progress and interviewing goals in each sample domain.
PNAUM may be used as a baseline for future studies aiming to assess the impact of
government action on drug access and use. For local studies using a compatible method, PNAUM may serve as a reference point to evaluate variations in space and population. With a comprehensive evaluation of drug-related aspects, PNAUM is a major source of data for a variety of analyses to be carried out at both academic and government level.
REFERENCES
1. Ben AJ, Neumann CR, Mengue SS. The Brief Medication Questionnaire and Morisky-Green test to evaluate medication adherence. Rev Saude Publica. 2012;46(2):279-89.
DOI:10.1590/S0034-89102012005000013
2. Bertoldi AD, Barros AJ, Wagner A, Ross-Degnan D, Hallal PC. A descriptive review of the methodologies used in household surveys on medicine utilization. BMC Health Serv Res. 2008;8(1):222. DOI:10.1186/1472-6963-8-222
3. Blum B, Luiza VL, Bermudez JAZ. Acesso a medicamentos medido no nível domiciliar: a proposta da OMS e outras iniciativas brasileiras. Rev Bras Farm. 2011;92(3):223-31.
4. Costa KS, Nascimento Júnior JM, Soeiro OM, Paganelli MO, Araújo SQ. Assistência farmacêutica nas redes de atenção ao SUS. In: Cuidado Farmacêutico na Atenção Básica. 1o ed. Brasília (DF): Editora
MS; 2014. p.108.
5. Didonet J, Mengue SW. Drug labels: are they a readable material? Patient Educ Couns. 2008;73(1):141-5. DOI:10.1016/j.pec.2008.05.004
6. Freitas MC, Mendes MMR. Condição crônica: análise do conceito no contexto da saúde do adulto. Rev Latino-Am Enferm. 2007;15(4):590-7. DOI:10.1590/S0104-11692007000400011
7. Galea S, Tracy M. Participation rates in epidemiologic studies. Ann Epidemiol. 2007;17(9):643-53. DOI:10.1016/j.annepidem.2007.03.013
8. Kaplan W, Marhtrs C. The world medicines situation report, 2011: global health trends: global burden of disease and pharmaceutical needs. 3rd ed. Geneva: World Health Organization; 2011.
9. Minaire P. Disease, illness and health: theoretical models of the disablement process. Bull World Health Organ. 1992;70(3):373-9.
10. Mindell JS, Giampaoli S, Goesswald A, Kamtsiuris P, Mann C, Männistö S et al. Sample selection, recruitment and participation rates in health examination surveys in Europe: experience from seven national surveys. BMC Med Res Methodol. 2015;15(1):78. DOI:10.1186/s12874-015-0072-4
11. Paniz VM, Fassa AG, Maia MF, Domingues MR, Bertoldi AD. Measuring access to medicines: a review of quantitative methods used in household surveys. BMC Health Serv Res.
2010;10(1):146. DOI:10.1186/1472-6963-10-146
12. Silva T, Dal-Pizzol F, Bello CM, Mengue SS, Schenkel EP. Bulas de medicamentos e a informação adequada ao paciente. Rev Saude Publica. 2000;34(2):184-9. DOI:10.1590/S0034-89102000000200013
13. Souza-Júnior PRB, Freitas MPS, Antonaci GA, Szwarcwald CL. Desenho da amostra da Pesquisa Nacional de Saúde 2013. Epidemiologia Serv Saude. 2015;24(2):207-16. DOI:10.5123/S1679-49742015000200003
14. Szwarcwald CL, Malta DC, Pereira CA, Vieira ML, Conde WL, Souza Júnior PR et al. Pesquisa Nacional de Saúde no Brasil: concepção e metodologia de aplicação. Cien Saude Coletiva. 2014;19(2):333-42. DOI:10.1590/1413-81232014192.14072012
15. Tolonen H, Helakorpi S, Talala K, Helasoja V, Martelin T, Prättälä R. 25-year trends and socio-demographic differences in response rates: finnish adult health behaviour survey. Eur J Epidemiol. 2006;21(6):409-15. DOI:10.1007/s10654-006-9019-8
Funding: Brazilian Ministry of Health through the Secretariat of Science, Technology and Strategic Inputs – SCTIE (Process 25000.111834/2).
Authors’ Contributions: design and critical review of intellectual content: SSM, ADB, ACB, NULT, TSDP E AJDB. All authors participated in drafting the study, approved the inal version of the manuscript and declare they are responsible for all aspects of the work, ensuring its accuracy and integrity.
Acknowledgements: to the Brazilian Ministry of Health for the commission, funding and technical support of the Pesquisa Nacional sobre Acesso, Utilização e Promoção do Uso Racional de Medicamentos, and especially to the project’s support team, represented by Amanda Ramalho da Silva, Andréia Turmina Fontanella and Luciano Santos Pinto Guimarães.