Lilia Blima SchraiberI
Ana Flávia P L D’OliveiraI
Márcia Thereza CoutoI
Heloisa HanadaII
Ligia B KissII
Julia G DurandII
Maria Inês PucciaIII
Marta Campagnoni AndradeII
I Departamento de Medicina Preventiva. Faculdade de Medicina (FM). Universidade de São Paulo (USP). São Paulo, SP, Brasil II Programa de Pós Graduação em Medicina
Preventiva. FM-USP. São Paulo, SP, Brasil III Programa de Pós-Graduação em Saúde
Pública. Faculdade de Saúde Pública. USP. São Paulo, SP, Brasil
Correspondence: Lilia Blima Schraiber
Departamento de Medicina Preventiva Faculdade de Medicina - USP
Av. Dr. Arnaldo 455 2ºandar- Cerqueira César 01246-903 São Paulo, SP, Brasil
E-mail: liliabli@usp.br Received: 5/24/2006 Reviewed: 10/5/2006 Approved: 12/14/2006
Violence against women
attending public health services
in the metropolitan area of São
Paulo, Brazil
ABSTRACT
OBJECTIVE: To estimate the prevalence of (physical, psychological, and sexual) violence against women by an intimate partner and non-partner perpetrators among users of public health services and to compare these women’s perception of having ever experienced violence with reports of violence in their medical records in the different services studied.
METHODS: The study was conducted in 19 health services, selected as a convenience sample and grouped into nine research sites, in metropolitan area of São Paulo from 2001 to 2002. Questionnaires on having ever experienced violence in their lifetime and in the last 12 months and perpetrators were applied to a sample of 3,193 users aged 15 to 49. A total of 3,051 medical records were reviewed to verify the notifi cation of violence. Comparative analyses were performed by Anova with multiple comparisons and Chi-square test followed by its partition.
RESULTS: The following prevalences were found: any type of violence 76% (95% CI: 74.2;77.8); psychological 68.9% (95% CI: 66.4;71.4); physical 49.6% (95% CI: 47.7;51.4); physical and/or sexual 54.8% (95% CI: 53.1;56.6), and sexual 26% (95% CI: 24.4;28.0). The prevalence of physical and/or sexual violence by an intimate partner in their lifetime was 45.3% (95% CI: 43.5;47.1), and by non-partners was 25.7% (95% CI: 25.0;26.5). Only 39.1% of women reporting any episode of violence perceived they had ever experienced violence in their lifetime and 3.8% of them had any reports of violence in their medical records. The prevalences were signifi cantly different between sites as well as the proportion of perception and reports of violence in medical records.
CONCLUSIONS: The expected high magnitude of the event and its invisibility was confi rmed by low rate of reports in the medical records. Few perceived abuses as violence. Further studies are recommended taking into account the diversity of service users.
KEYWORDS: Battered women. Violence against women. Spouse abuse. Mandatory reporting. Underregistration. Women’s health services. Questionnaires.
INTRODUCTION
Violence against women has been recognized as a public health problem within the last decade.11,16 International population-based studies show its high
violence from an intimate partner, occurring at least once in a lifetime, ranging from 21% in Holland and Switzerland, or 29% in Canada, to 69% in Nicaragua (Managua).8,23 This range can be related to the
method-ological diversity of the studies. A comparative study6
on 15 regions of ten countries, including Brazil, reaf-fi rmed the high variation of frequency and high rates of violence and that the intimate partner was the main aggressor. The instruments and methodology were the same for all countries participating in the study. The rates of physical violence ranged from 13% (Okahama, Japan) to 61% (Cuzco, Peru). Brazil showed rates of 27% and 34% (respectively, the city of São Paulo and 15 municipalities in the rural zone of the State of Per-nambuco, Northeastern Brazil).
Studies carried out in health services5,13-15 have
pre-sented even higher rates, ranging from 20% to 50% for lifetime physical and/or sexual violence by an intimate partner. They have also indicated that 12% to 25% of primary care users report violence by their partner in the previous year, as 4% to 17% of prenatal service users and 12% to 22% of emergency service users.12
In Brazil, a study in a primary healthcare unit17 in São
Paulo showed that over 40% of the users reported life-time physical violence by any aggressor. The prevalence of violence by a partner or a member of the family was 34.1%. Another similar study in Porto Alegre (Southern Brazil) found rates of 38% for physical violence and 9% for sexual violence by a partner.10 In emergency services
in Bahia,19 46% of the users reported some episode of
violence in their lifetimes, of which 36.5% was physical and 18.6% was sexual. Partners and former partners were responsible for 65.7% of physical aggression and 68.7% of sexual aggression.
There are studies that highlight the overlapping of physical, sexual and psychological violence, and in-dicate a cumulative and progressive effect from more moderate to severe forms and from an initial episode to its recurrence.6,8,10,17
It must also be considered that violence is associated with large numbers of health problems,3,5-7,13 including
deaths due to homicide or suicide, or major presence of suicidal ideation, as well as sexually transmittable diseases, cardiovascular diseases and chronic pain. In preventive care, violence is a factor that hinders family planning, HIV/Aids protection and the prevention of obstetric risks, fetal loss and low birth weight.
The importance of recognizing violence among health service users, particularly primary care users, can
there-fore be seen. Nevertheless, violence is not identifi ed in diagnoses.21,22,* In addition, women have diffi culty
in revealing what happened, and this is reinforced by the disbelief and moral judgment of the professionals listening to them.18
In this light, the objective of this study was to investi-gate the occurrence of different types of violence among public health service users, with the aim of estimating the prevalence, time of occurrence, severity, recording of episodes in medical fi les and women’s perceptions regarding experiences of violence in their lifetimes.
METHODS
Data from a survey carried out in 2001–2002** was examined. Nineteen health services in the municipali-ties of São Paulo, Santo André, Diadema and Mogi das Cruzes (all in the State of São Paulo) participated in the survey. These health services were gateways to the public service network. Most of them offered primary healthcare, either as single primary units or in combination with more specialized care. The units were selected by convenience, taking into account their locations in several regions of São Paulo as well as their respective health departments’ intention to introduce violence-related care policies. With this aim, attendance guidelines for violence against women were developed in the fi nal stage of the study. According to the respective health departments, the participating services had volumes of 800 to 1,000 consultations/ month, multiprofessional teams, regular opening hours and the capacity to become reference units for attend-ing to cases in their regions. Among the 19 services chosen, 14 were in São Paulo, three in Santo André, one in Diadema and one in Mogi das Cruzes. The way in which the services worked was examined, in order to classify them as independent research sites. According to the way the clientele was drawn and care activities were undertaken, nine sites were identifi ed. Six of them (SP–North, SP–Center/West, SP–South, Santo André, Diadema and Mogi das Cruzes) were operating only on spontaneous demand and with the usual set of women’s health actions envisaged by the Compre-hensive Women’s Healthcare Program.4 Another site
(SP–East) was formed by four units within the system of the Family Health Program (at that time the Qualis Project) that were operating mainly on spontaneous demand and secondarily by actively searching for the clientele. Nevertheless, their internal organization was similar to the other sites. Thus, there were seven sites providing conventional health care.
* Kiss LB. Temas médico-sociais e a intervenção em saúde: a violência contra mulheres no discurso dos profi ssionais [Dissertação de Mestrado]. Faculdade de Medicina: USP; 2004.
The other two sites had special attendance situations. The Barra Funda School Health Center (SHC) not only provided for the spontaneous demand, but also actively sought to include socially excluded subgroups of the population: sex workers, people living on the streets and people living in shantytowns (favelas). At the Reference and Training Center for Sexually Transmitted Diseases and HIV/Aids (RTC/Aids), along with providing for the local spontaneous demand, care was provided for a clientele sent there by other services, since it is a referral center for users living with HIV.
The sample of users was of consecutive type, taking in women in the order of their arrival at the service. It was ensured that the investigation would cover at least a whole week of regular unit operation, both in the morning and in the afternoon. To achieve this, the sample was divided in proportion to attendance volumes (by day and time of the day). The sample was calculated per site and an expected prevalence of lifetime domestic violence of 32%13 was used as the
basis for detecting a variation of 5%, with a test power of 80% and a confi dence level of 95%. This resulted in a minimum of 335 users for each site, except for the two aforementioned special situations. At the RTC/Aids and Barra Funda SHC sites, because of the subgroups they attended, women were considered to be at a greater risk of violence. The expected prevalence was estimated without any literature references, to be between 38.4% and 62% for these last two sites, depending on the subgroup, thus resulting in minimum samples of 363 and 384 users, respectively.
The eligible women were between 15 and 49 years old and had gone to the services looking for clinical or gynecologist/obstetric care. They had to be in a physical and mental condition in which they could be interviewed.
Questionnaires were applied by face-to-face interviews, so as to estimate the prevalence of violence. The medi-cal fi les of the interviewed women were read in order to
estimate the frequency of recorded cases at the services. The contrast between the prevalence and the frequency of recorded cases was considered suggestive of the visibility (or invisibility) of violence as a demand or diagnosis at these services.
The interviews took place while women were waiting for their consultations and were always carried out with the women unaccompanied, only allowing the pres-ence of children under two years old. The fi eld team consisted only of women and was trained following the recommendations for better revelation of violence.24
The analysis of the medical records was done by trained researchers, using a specifi c and standardized instru-ment. Among these researchers were professionals from the participating health services, as a mean of transfer-ring technology to the partner teams. Physicians were always present as local supervisors.
The survey covered violence against women by any aggressor and, particularly, by intimate or former partners (in affective-sexual relationships). Other ag-gressors considered were: strangers; family members other than the partner; and people known to the victim, a category that included friends, neighbors and work or study colleagues.
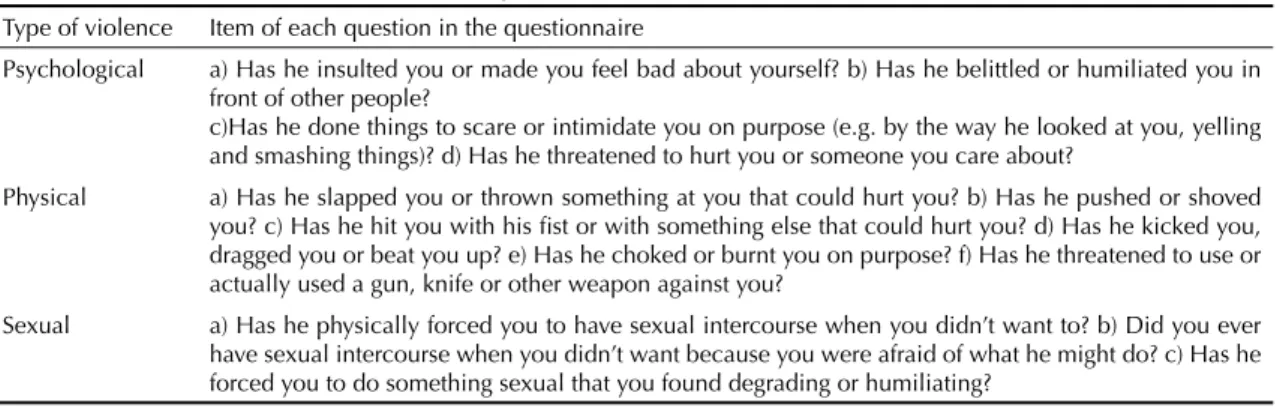
The questionnaire consisted of four parts: sociodemo-graphic data; family and reproductive health situation; episodes of violence; and the perception of experienc-ing violence. A questionnaire drawn up by the World Health Organization and by the Brazilian team for a multi-country study6,25 (Table 1) provided the questions
about violence.
Violence was investigated according to type: psycho-logical, physical and sexual. Cases were considered to involve violence if there was at least one positive response to any of the items, for each of the types. The combination of physical and/or sexual violence was taken to be at least one positive answer for any of
Table 1. Questions regarding psychological, physical and sexual violence against women by the intimate partner, occurring
in a lifetime and within the last 12 months. Metropolitan area of São Paulo, 2001-2002.
Type of violence Item of each question in the questionnaire
Psychological a) Has he insulted you or made you feel bad about yourself? b) Has he belittled or humiliated you in front of other people?
c)Has he done things to scare or intimidate you on purpose (e.g. by the way he looked at you, yelling and smashing things)? d) Has he threatened to hurt you or someone you care about?
Physical a) Has he slapped you or thrown something at you that could hurt you? b) Has he pushed or shoved you? c) Has he hit you with his fi st or with something else that could hurt you? d) Has he kicked you, dragged you or beat you up? e) Has he choked or burnt you on purpose? f) Has he threatened to use or actually used a gun, knife or other weapon against you?
Sexual a) Has he physically forced you to have sexual intercourse when you didn’t want to? b) Did you ever have sexual intercourse when you didn’t want because you were afraid of what he might do? c) Has he forced you to do something sexual that you found degrading or humiliating?
for the statistical processing. To compare the frequency distributions of the continuous variables, analysis of variance (Anova) was used, complemented by the Scheffé test for multiple comparisons between the differences found. In the case of categorical variables, Pearson’s Chi-square test was used, complemented by Chi-square partition1 for analysis of differences. A
signifi cance level of 5% was accepted.
With regard to ethical questions in this study, in addition to obtaining approval for the study from the Research Ethics Committees of the Faculdade de Medicina and Hospital da Clínicas of Universidade de São Paulo on May 12, 2000, the following were also provided: informed consent phrased in language appropriate to women’s safety and to dealing with sensitive subjects; support for the interviewees, for which the interviewers were specially trained; support of a psychological and ethical nature for the interviewers; privacy for conduct-ing the interviews; and workshops to present the results to the participating services. These measurements fol-lowed the recommendations of the World Health Orga-nization for research on violence against women.24
RESULTS
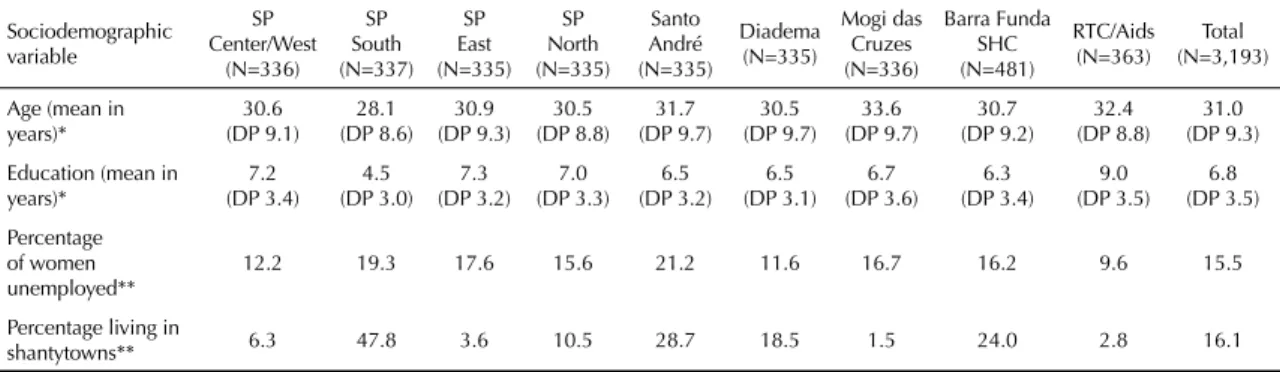
The final sample comprised 3,193 women, whose sociodemographic characteristics according to survey site are shown in Table 2. Some differences in mean age were found between the sites: the Mogi site presented a higher mean age than did the other fi ve (SP–South, SP–Center/West, SP–North, Diadema and Barra Funda SHC); the SP–South had the lowest mean and only differed from the RTC/Aids and Santo André sites. Regarding educational level, the RTC/Aids site had the highest level, and SP-South had the lowest level. These two services differed from all others while the others did not differ between each other.
these types. The same was deemed for combinations of all three types (psychological and/or physical and/or sexual violence).
The following were also investigated in relation to violence by partners: recurrence (once, a few or many times); severity (moderate or severe); and the time of occurrence (during the woman’s lifetime or during the past 12 months; the latter was considered to be re-cent6,8). The recurrence of episodes was analyzed only
for the combination of physical and/or sexual violence, which are the types that have been studied most. The severity of the episodes was investigated only in rela-tion to physical violence. The moderate classifi cation was constituted by positive answers to the items a or b in Table 1, while severe violence was constituted by any positive answer to the rest of the items (c to f). Sexual violence was always considered severe.
The question “do you consider that you have suffered violence at some time in your life?”, which was placed at the end of the questionnaire, was put to all the women interviewed. This was a way of estimating the perception of having suffered any episode of violence during their lives, thereby enabling comparison with affi rmative responses to the specifi c questions about the different types of violence.
The records of episodes in the interviewees’ medical fi les were also examined. The type of violence, activi-ties for which a record was made and the professional who attended the case were investigated. Annotations in the fi les throughout the service user’s lifetime were sought. The individual’s use of the services was exam-ined, with emphasis on the year prior to the survey.
The Foxpro 2.6 program was used to build and review the database. Double data entry was used and validation was performed using EpiInfo 6.0. Stata 8.0 was used
Table 2. Sociodemographic characteristics of interviewed women, according to site. Metropolitan area of São Paulo,
2001-2002. Sociodemographic variable SP Center/West (N=336) SP South (N=337) SP East (N=335) SP North (N=335) Santo André (N=335) Diadema (N=335) Mogi das Cruzes (N=336) Barra Funda SHC (N=481) RTC/Aids (N=363) Total (N=3,193) Age (mean in
years)* 30.6 (DP 9.1) 28.1 (DP 8.6) 30.9 (DP 9.3) 30.5 (DP 8.8) 31.7 (DP 9.7) 30.5 (DP 9.7) 33.6 (DP 9.7) 30.7 (DP 9.2) 32.4 (DP 8.8) 31.0 (DP 9.3) Education (mean in
years)* 7.2 (DP 3.4) 4.5 (DP 3.0) 7.3 (DP 3.2) 7.0 (DP 3.3) 6.5 (DP 3.2) 6.5 (DP 3.1) 6.7 (DP 3.6) 6.3 (DP 3.4) 9.0 (DP 3.5) 6.8 (DP 3.5) Percentage of women unemployed**
12.2 19.3 17.6 15.6 21.2 11.6 16.7 16.2 9.6 15.5
Percentage living in
shantytowns** 6.3 47.8 3.6 10.5 28.7 18.5 1.5 24.0 2.8 16.1
P<0.0001
* One-way analysis of variance (F test) and multiple comparison (Scheffé test); ** Chi-square and Chi-square partition
Diadema, RTC/Aids and SP-Center/West sites pre-sented the lowest unemployment rates and were ho-mogeneous between each other, but they differed from all other sites, which had higher rates and were also homogeneous between each other. Therefore, higher rates predominated.
With regard to shantytown homes, there was great varia-tion among the sites. The highest percentage found, in SP-South, was signifi cantly different from the others. The sites with lowest percentages (Mogi, RTC/Aids and SP-East) did not differ between each other, but did differ from all the rest.
The prevalence, aggressors, perceptions of having suffered violence and records in medical fi les regard-ing episodes that occurred at least once in a lifetime are presented by type of violence and combinations of types in Table 3. Intimate partners stood out as the main aggressors. However, only 39.1% of the women
who had already reported some type of aggression by any perpetrator gave a positive answer to the question “do you consider that you have suffered violence at some time in your life?” at the end of the questionnaire. Thus, there was a low general perception of having suffered violence among the interviewees. This rate increased when sexual violence was part of the abuses experienced. There was a gradual but signifi cantly growing difference between the psychological type (lowest perception), physical type and sexual type (highest perception).
In examining the medical fi les to search for records of violence, there was a 4.5% loss (medical fi les that were not found). The rates of recorded cases were low for all types of violence.
Five records of violence were found in the medical fi les of women who did not report any episode in the questionnaire. Additionally, among the women who
re-Table 3. Prevalences, aggressors and perceptions of violence occurring at least once in the woman’s lifetime, according to the
type of violence among public health service users. Metropolitan area of São Paulo, 2001-2002.
Variable
Psychological violence (Psy)
Physical violence (Phy)
Sexual violence (S)
Phy and/or S violence
Psy. Phy and/or S violence Total
% 95% CI % 95% CI % 95% CI % 95% CI % 95% CI
Any aggressor 68.9 66.4;71.4 49.6 47.7;51.4 26 24.4;28 54.8 53.1;56.6 76.0 74.2;77.8 3,193 Aggressors other than
partners 44.8 43.0;46.5 20.5 19.1;21.9 9.3 8.3;10.4 25.6 24.1;27.1 52.7 50.9;54.4 3,193 Intimate partner 52.9 51.1;54.6 40.3 38.6;42.1 21.0 19.6;22.5 45.3 43.5;47.1 61.1 59.4;62.9 3,089* Perception of violence 11.0 8.7;13.6 34.8 31.7;37.9 66.6 63.3;69.8 49.9 47.6;52.3 39.1 37.1;41.1 3,193** Records in medical fi le 2.1 1.6;2.7 1.5 1.1;2.0 0.7 0.4;1.0 1.8 1.4;2.3 3.1 2.5;3.8 3,051*** * 142 medical fi les not located
** Women with partners at some time during their lives
*** Chi-square test for any aggressor and Chi-square partition; p<0.05
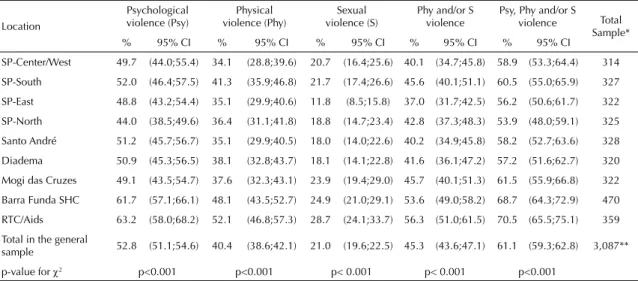
Table 4. Prevalence of psychological, physical and sexual violence by partner or former partner at some time during the woman’s
lifetime among public health service users. Metropolitan area of São Paulo, 2001-2002.
Location
Psychological violence (Psy)
Physical violence (Phy)
Sexual violence (S)
Phy and/or S violence
Psy, Phy and/or S violence Total
Sample*
% 95% CI % 95% CI % 95% CI % 95% CI % 95% CI
SP-Center/West 49.7 (44.0;55.4) 34.1 (28.8;39.6) 20.7 (16.4;25.6) 40.1 (34.7;45.8) 58.9 (53.3;64.4) 314 SP-South 52.0 (46.4;57.5) 41.3 (35.9;46.8) 21.7 (17.4;26.6) 45.6 (40.1;51.1) 60.5 (55.0;65.9) 327 SP-East 48.8 (43.2;54.4) 35.1 (29.9;40.6) 11.8 (8.5;15.8) 37.0 (31.7;42.5) 56.2 (50.6;61.7) 322 SP-North 44.0 (38.5;49.6) 36.4 (31.1;41.8) 18.8 (14.7;23.4) 42.8 (37.3;48.3) 53.9 (48.0;59.1) 325 Santo André 51.2 (45.7;56.7) 35.1 (29.9;40.5) 18.0 (14.0;22.6) 40.2 (34.9;45.8) 58.2 (52.7;63.6) 328 Diadema 50.9 (45.3;56.5) 38.1 (32.8;43.7) 18.1 (14.1;22.8) 41.6 (36.1;47.2) 57.2 (51.6;62.7) 320 Mogi das Cruzes 49.1 (43.5;54.7) 37.6 (32.3;43.1) 23.9 (19.4;29.0) 45.7 (40.1;51.3) 61.5 (55.9;66.8) 322 Barra Funda SHC 61.7 (57.1;66.1) 48.1 (43.5;52.7) 24.9 (21.0;29.1) 53.6 (49.0;58.2) 68.7 (64.3;72.9) 470 RTC/Aids 63.2 (58.0;68.2) 52.1 (46.8;57.3) 28.7 (24.1;33.7) 56.3 (51.0;61.5) 70.5 (65.5;75.1) 359 Total in the general
sample 52.8 (51.1;54.6) 40.4 (38.6;42.1) 21.0 (19.6;22.5) 45.3 (43.6;47.1) 61.1 (59.3;62.8) 3,087** p-value for χ2 p<0.001 p<0.001 p< 0.001 p< 0.001 p<0.001
ported lifetime violence, from the total of 2,321 medical fi les that were found and examined, 3.8% (n=89) had at least one record of violence: 50% of them reported psychological violence, 34.7% physical violence and 15.3% sexual violence. Most of the records (69.1%) had exclusive, non-combined types of violence.
Among all the records in the medical fi les, 55.3% were from the Barra Funda SHC and 25.5% from the RTC/ Aids. These records represented, respectively, 16% and 9.4% of the cases reported in the questionnaires at these sites. At all the other sites, a maximum of fi ve medical fi les had a record of violence. The records were concentrated in mental health care activities (34% of the total), considering all types of violence.
Table 4 presents the prevalence of the different types of lifetime violence by an intimate partner according to study sites. The high rates for all the types of violence stand out. Comparing the different research sites, there was homogeneity in the observed prevalence for all types of violence, except for the RTC/Aids and Barra Funda SHC. These were the highest rates and they dif-fered from all the other sites. These other sites, in turn, did not differ between each other, except in the case of sexual violence, in which the SP-East site, with the lowest prevalence, differed from the rest.
Large overlaps between the types of violence were found in most cases (62%). The single forms corre-sponded to 26% of the psychological type of cases, 9% of the physical type and 3% of the sexual type.
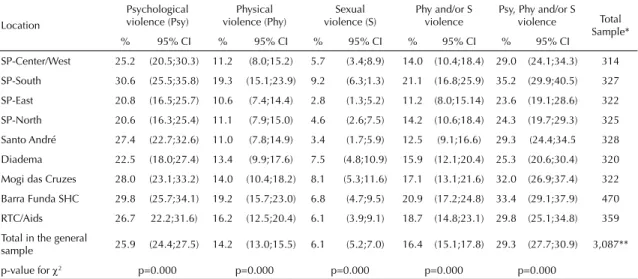
Table 5 presents the prevalence of current violence by intimate partners (within the past 12 months) accord-ing to the different sites. The magnitude of current violence was also high. The SP-South site had the
highest prevalence of all forms of current violence. For all the types of violence, except sexual, SP-South did not differ from the Diadema and Mogi sites, and these three sites differed from all others. Regarding sexual violence, SP-South did not differ from Diadema and Mogi, but these three sites differed from all others. Also in this case, the RTC/Aids and Barra Funda SHC sites did not differ from the rest.
The severity of the episodes was examined only for physical violence by partners. Severe lifetime violence was 62.1% of the cases. Severe physical violence in the past 12 months was 54.6%. The severe form was therefore predominant.
Regarding the recurrence of episodes of violence by an intimate partner and considering the 1,885 cases of lifetime psychological, physical or sexual abuse, the “many times” category was predominant (53.7%). The same was seen for other types of lifetime violence: physical and/or sexual violence (43.7%), psychological (54.5%), sexual (42.5%) and physical (40.6%). The “many times” category was also predominant for all cases of current violence: psychological (52.4%), physi-cal (37.5%), sexual (38.0%) and at least one type of violence (50.9%). The recurrence was therefore high, such that the “many times” category was predominant, both for current violence and lifetime violence.
DISCUSSION
The present study was designed to analyze the preva-lence of different types of viopreva-lence against women by different aggressors, among health service users. High prevalence and differences in the frequency of lifetime violence were found within the different health
Table 5. Occurrence of psychological, physical and sexual violence by partner or former partner in the last year among public
health service users. Metropolitan area of São Paulo, 2001-2002.
Location
Psychological violence (Psy)
Physical violence (Phy)
Sexual violence (S)
Phy and/or S violence
Psy, Phy and/or S violence Total
Sample*
% 95% CI % 95% CI % 95% CI % 95% CI % 95% CI
SP-Center/West 25.2 (20.5;30.3) 11.2 (8.0;15.2) 5.7 (3.4;8.9) 14.0 (10.4;18.4) 29.0 (24.1;34.3) 314 SP-South 30.6 (25.5;35.8) 19.3 (15.1;23.9) 9.2 (6.3;1.3) 21.1 (16.8;25.9) 35.2 (29.9;40.5) 327 SP-East 20.8 (16.5;25.7) 10.6 (7.4;14.4) 2.8 (1.3;5.2) 11.2 (8.0;15.14) 23.6 (19.1;28.6) 322 SP-North 20.6 (16.3;25.4) 11.1 (7.9;15.0) 4.6 (2.6;7.5) 14.2 (10.6;18.4) 24.3 (19.7;29.3) 325 Santo André 27.4 (22.7;32.6) 11.0 (7.8;14.9) 3.4 (1.7;5.9) 12.5 (9.1;16.6) 29.3 (24.4;34.5 328 Diadema 22.5 (18.0;27.4) 13.4 (9.9;17.6) 7.5 (4.8;10.9) 15.9 (12.1;20.4) 25.3 (20.6;30.4) 320 Mogi das Cruzes 28.0 (23.1;33.2) 14.0 (10.4;18.2) 8.1 (5.3;11.6) 17.1 (13.1;21.6) 32.0 (26.9;37.4) 322 Barra Funda SHC 29.8 (25.7;34.1) 19.2 (15.7;23.0) 6.8 (4.7;9.5) 20.9 (17.2;24.8) 33.4 (29.1;37.9) 470 RTC/Aids 26.7 22.2;31.6) 16.2 (12.5;20.4) 6.1 (3.9;9.1) 18.7 (14.8;23.1) 29.8 (25.1;34.8) 359 Total in the general
sample 25.9 (24.4;27.5) 14.2 (13.0;15.5) 6.1 (5.2;7.0) 16.4 (15.1;17.8) 29.3 (27.7;30.9) 3,087**
p-value for χ2 p=0.000 p=0.000 p=0.000 p=0.000 p=0.000
services. Services with special health care organization presented the highest prevalence for all types of life-time intimate partner violence. The clientele of these services consisted basically of socially excluded people who presented great social vulnerabilities (Barra Funda SHC) or medical-sanitary vulnerabilities (RTC/Aids). The same differences were found for current violence, except for sexual violence. Even though these two services contrast, differing from each other with regard to schooling levels and unemployment rates, these dif-ferences still persist.
This fi nding provides motivation for at least two ad-ditional specifi c studies. The fi rst one would analyze social exclusion, related social vulnerability, and violence. This motivation is reinforced by the SP-South site’s high prevalence of current violence while having the lowest educational level when statistically compared with the other sites. The second study would examine the supposition, also suggested by the pres-ent fi ndings, that vulnerability to violence is higher among women who either are living with HIV/Aids or consider themselves at greater risk of having sexually transmitted diseases and HIV/Aids. This supposition also reaffi rms many of the warnings in the literature.3,7,8
The combination of these fi ndings would also reinforce the need to study the association between violence and educational level, since RTC/Aids users presented the highest prevalence and, at the same time, the highest schooling levels in the sample, differing from the rest. Nevertheless, the mean years of schooling among these women corresponded only to the start of the high school level.
Another two relevant fi ndings reaffi rm the literature: the intimate or former partner was the main aggressor, including in relation to sexual violence; and overlapping between the types of violence predominated.3,7,8
All the fi ndings regarding prevalence of intimate part-ner violence are compatible with those from interna-tional studies on primary health care services.5,7,13-15 The
prevalence of physical and sexual violence in this study were, however, higher than those from other Brazilian studies.10,19 This may have been because of differences
in how the questionnaire was applied, thereby resulting in greater revelation, or because of the samples’ size. Additionally, the data showed the high recurrence and severity of intimate partner violence.
The perception rate of having experienced violence was much lower that the prevalence found, even though this perceptions were from the same women who answered the questionnaire on violence. This would indicate a mismatch between reported aggression based on speci-fi ed actions and the notion of violence, thus reaffi rming the fi ndings from a study on primary care in São Paulo.18
That study suggested that violence was not recognized as the appropriate name for all of the situations of abuse
that were experienced. The use of this term (violence) was associated by the women more with situations of aggression by strangers and particularly in sexual abuse. The present study confi rms this last observation regard-ing sexual violence from any perpetrator.
With regard to the records of violence in medical fi les, the rate was generally low. This fi nding can be under-stood considering studies that have indicated health professionals’ great diffi culty in dealing with violence as a consultation issue.12,21,22 Even the SP-East site,
part of the Family Health Program, was not different from the other sites, also presenting low percentages of violence records. A study carried out in São Paulo2
among professionals from this same site revealed that the increased amount of information from the com-munity agents on the existence of domestic violence against women did not result in a larger number of recorded cases.
It should be emphasized that, at the time of this survey, none of the services had specifi c attendance for violence or any previous awareness-raising activities for the teams. Such awareness-raising took place in all the par-ticipating services only at the time of the fi nal research activity and as a product of the study itself.
Among the limiting factors of this study, the use of a convenience sample for selecting the services can be highlighted. This implied losing its representativeness of the public healthcare network of the Greater São Paulo area, thus impeding the inferences for this popula-tion. However, within each of these health services, the group of users was represented by a consecutive sample of interviewed women, taking into consideration the distribution of attendance volumes, according to day of the week and time of the day. Consecutive samples of this type are considered to be the best method for researching health services users.9
Another limiting factor is the bias of revelation and subjectivity that may be involved in such reports of violence, especially those related to psychological violence. Concerning the bias in revelation, interna-tional recommendations on the best method for rev-elation within the context of face-to-face interviews were taken into account.24 And even if there might be
overreporting, it is the underreporting of experiences that has been extensively shown in the literature.7 The
another person. In this respect, a subjective appreciation was induced, albeit of collective nature and therefore subject to variations on various cultural bases. In an attempt to control this possible information bias, focal groups with women of similar characteristics to the investigated population were conducted prior to this study, in order to validate the questions. Psychological violence remains a relatively neglected research subject when compared to physical and sexual violence, within both the national and international contexts. Neverthe-less, psychological violence was considered important in the present study because of the suffering and damage to health caused both when it occurs alone and when it is together with other types of violence. However, in terms of the capacity to objectively assess abuse and violent actions, neither psychological nor sexual violence is equal to physical violence.
In this regard, the construction of specifi c questions in the questionnaire is backed up in the literature25 and
this has been successfully used in transcultural multi-country studies.6
In summary, violence against women was shown to be a relevant question among health services users, which has repercussions in questions regarding the care provided. However, the descriptive nature of this study did not allow further analysis. Thus, it is necessary to deepen the knowledge in order to defi ne policies and intervention programs more precisely, especially with regard to violence by intimate partners and the diffi cul-ties faced by professionals and these women in dealing with this subject.
ACKNOWLEDGEMENTS
1. Armitage P, Berry G. Statistical methods in medical research. Londres: Blackwell Scientifi c Publications; 1973.
2. Batista KBC. Violência contra mulher e Programa Saúde da Família: a emergência da demanda na visão dos profi ssionais. In: Vilela W, Monteiro S, organizadores. Gênero e Saúde: Programa Saúde da Família em questão. Rio de Janeiro: ABRASCO; 2005, p.119-37.
3. Campbell JC. Health consequences of intimate partner violence. Lancet. 2002; 359(9314):1331-6.
4. D’Oliveira AFPL, Senna DM. Saúde da mulher. In: Schraiber LB, Nemes MIB, Mendes-Gonçalves RB. Saúde do adulto: programas e ações na Unidade Básica. São Paulo: Hucitec; 1996. p. 86-108.
5. Eisenstat SA, Bancroft L. Domestic violence. N Engl J Med. 1999;341(12):886-92.
6. Garcia-Moreno C, Jansen HAFM, Ellsberg M, Heise L, Watts C. WHO Multi-country study on women’s health and domestic violence against women: initial results on prevalence, health outcomes and women’s responses. Geneva: World Health Organization, 2005.
7. Heise L, Ellsberg M, Gottemoeller M. Ending violence against women. Popul Rep. 1999;27(4):1-43.
8. Heise L, Garcia-Moreno C. Intimate Partner Violence. In: Krug EG, Dahlberg LL, Mercy JA, Zwi AB, Lozano R, editores. World Report on violence and health. Geneva: World Health Organization; 2002. p.91-121.
9. Hulley SB, Newman TB, Cumming SR. Choosing the study subjects. In: Hulley SB, Cummings SR, Browner WS, Grady D, Hearst N, Newman TB, editores. Designing clinical research: an epidemiologic approach. Philadelphia: Lippincott Williams & Wilkins; 2001. p.18-30.
10. Kronbauer JFD, Meneghel SN. Perfi l da violência de gênero perpetrada por companheiro. Rev Saude Publica. 2005;39(5):695-701.
11. Krug EG, Dahlberg LL, Mercy JA, Zwi AB, Lozano R, editores. World Report on violence and health. Geneva: World Health Organization; 2002.
12. Maiuro RD, Vitalino PP, Sugg NK, Thompson DC. Rivara FP, Thompson RS. Development of a health care provider survey for domestic violence: psychometric properties. Am J Prev Med. 2000;19(4):245-52.
13. McCauley J, Kern DE, Kolodner K, Dill L, Schroeder AF, DeChant HK, et al. The “battering syndrome”:
prevalence and clinical characteristics of domestic violence in primary care internal medicine practices.
Ann Intern Med.1995;123(10):737-46.
14. Naumann P, Langford D, Torres S, Campbell J, Glass N. Women battering in primary care practice. Fam Pract.
1999;16(4):343-52.
15. Richardson J, Coid J, Petruckevitch A, Chung WS, Moorey S, Feder G. Primary Care. BMJ. 2002; 324(7332):274.
16. Saltzman LE, Green YT, Marks JS, Thacker SB. Violence against women as a public health issue: comments from the CDC. Am J Prev Med. 2000;19(4):325-9.
17. Schraiber LB, d’Oliveira AFPL, França-Junior I, Pinho AA. Violência contra a mulher: estudo em uma unidade de atenção primária à saúde. Rev Saude Publica. 2002;36(4):470-7.
18. Schraiber LB, D’oliveira AFPL, Hanada H, Figueiredo W, Couto M, Kiss L, et al. Violência vivida: a dor que não tem nome. Interface Comum Saúde Educ.
2003;7(12):41-54.
19. Silva IV. Violência contra mulheres: a experiência de usuárias de um serviço de urgência e emergência de Salvador, Bahia, Brasil. Cad Saude Publica.
2003;19(Supl 2):263-72.
20. Stark E, Flitcraft AH. Spouse abuse. In: Rosemberg ML, Fenley MA, editores.Violence in America: a public health approach. New York: Oxford University Press; 1991. p.123-57.
21. Sugg NK, Innui T. Primary care physician’s response to domestic violence. Opening Pandora’s Box. JAMA. 1992;267(23):3157-60.
22. Sugg NK, Thompson RS, Thompson DC, Maiuro R, Rivara FP. Domestic violence and primary care. Attitudes, practices and beliefs. Arch Fam Med. 1999; 8(4):301-6.
23. Watts C, Zimmerman C. Violence against women: global scope and magnitude. Lancet. 2002;359(9313):1232-7.
24. World Health Organization. Putting women’s safety fi rst: Ethical and safety recommendations for research on domestic violence against women. Geneva; 1999. (Report n.WHO/EIP/GPE/99.2).
25. World Health Organization. WHO Multi-country Study on Women’s Health and Domestic Violence against Women. Geneva; 1999.
REFERENCES