1
Hitit University, School of Medicine, Department of Anesthesiology. Kuzey Kampüs, 19030, Çorum, Turkey. Correspondência para/Correspondence to: Ö YAĞAN. E-mail: <ozguryagan@hotmail.com>.
2
Ordu University, School of Medicine, Department of Anesthesiology. Ordu, Turkey. 3
Ordu University, School of Medicine, Department of Biochemistry. Ordu, Turkey. 4
Ordu University, School of Medicine, Department of Gastroenterological Surgery. Ordu, Turkey.
Support: Ordu University Scientific Research Projects Coordination Department (Project nº 2013; AR-1352). This study was presented as an oral presentation at “Balkan States Anesthesia Days-III”. Skopje, Macedonia; 2016.
Comparison of the effects of continuous
versus intermittent enteral feeding on
plasma leptin and ghrelin levels in
Intensive Care Units
Comparação do efeito da alimentação enteral
contínua com o efeito da alimentação
intermitente nos níveis plasmáticos
de leptina e grelina em Unidades
de Terapia Intensiva
Özgür YAĞAN1
Nilay TAŞ2
Sema Nur AYYILDIZ3
Murat KARAKAHYA4
Tevfik NOYAN3
A B S T R A C T
Objective
The aim of this prospective randomized trial is to verify whether there is an association between the methods of administration of enteral nutrition and the leptin and ghrelin hormones, which have a major role in the regulation of energy metabolism.
Methods
nutrition. In addition to routine biochemical assays, blood samples were taken from the patients for leptin and ghrelin analyses on the 1th, 7th, and 14th days of enteral nutrition.
Results
There was no statistically significant difference between the groups regarding descriptive statistics and categorical variables such as underlying diseases, complications, steroid use and others (p>0.05). The decrease in the number of white blood cells and in creatinine and C-reactive protein levels over time were statistically significant (p=0.010, p=0.026, p<0.001 respectively). There was no statistically significant difference between the groups with respect to leptin and ghrelin levels (p=0.982 and p=0.054). Leptin levels did not change over time; however, the ghrelin levels of both groups were significantly higher on the 7th and 14th days than on the first day of analysis (p=0.003).
Conclusion
This study revealed that both continuous and intermittent enteral nutrition feeding regimens were well tolerated in Intensive Care Unit patients showing minor complications. The method of administration of enteral nutrition alone did not affect the leptin and ghrelin levels. Randomized controlled large cohort trials are needed to to compare intermittent and continuous enteral nutrition to determine which one is more adaptable to diurnal patterns of secretion metabolic hormones.
Keywords: Energy metabolism. Enteral nutrition. Ghrelin. Leptin.
R E S U M O
Objetivo
Este ensaio aleatório prospectivo tem por objetivo verificar se existe uma associação entre o programa de administração de nutrição enteral e os hormonios leptina e grelina, os quais funcionam no metabolismo energético.
Métodos
Este estudo incluiu 38 pacientes de Unidades de Terapia Intensiva, com idades entre os 18 e os 85 anos, que receberam nutrição enteral. Os pacientes foram escolhidos aleatoriamente para receberem nutrição enteral utilizando infusão contínua (n=19) ou intermitente (n=18). Além de exames bioquímicos de rotina, foram colhidas amostras de sangue dos pacientes para análises dos níveis de leptina e grelina no 1º, 7º e 14º dias de nutrição enteral.
Resultados
Não houve diferença estatística significante entre os grupos em relação a dados descritivos e variáveis categóricas tais como doenças subjacentes, complicações, utilização de esteroides e outros (p>0,05). A diminuição no número de leucócitos e nos níveis de creatinina e proteína C-reativa com o tempo foi estatisticamente significativa (p=0,010, p=0,026, p<0,001, respetivamente). Não existiu diferença com significância estatística entre os grupos em relação aos níveis de leptina e grelina (p=0,982 e p=0,054). Embora os níveis de leptina não mudaram com o tempo, os níveis de grelina de ambos os grupos foram significativamente superiores no 7° e 14° dias quando comparados aos verificados na análise do primeiro dia (p=0,003).
Conclusão
Este estudo revelou que os programas de nutrição enteral contínua e intermitente foram bem tolerados com pequenas complicações apresentadas pelos pacientes em Unidades de Terapia Intensiva. O padrão de administração de nutrição enteral por si só não afetou os níveis de leptina e grelina. Estudos controlados aleatórios em coortes maiores são necessários para verificar qual programa de administração de nutrição enteral, intermitente ou a contínuo, é mais adaptável ao padrão de secreção diurno de hormônios metabólicos.
Palavras-chave: Metabolismo energético. Nutrição enteral. Grulina. Leptina.
I N T R O D U C T I O N
Leptin and ghrelin are two hormones which play an important role in energy metabolism.
mainly produced by the stomach and plays a role in many metabolic events in the body [3]. Plasma ghrelin levels increase before meals and decrease after eating [4]. The effects of leptin and gherlin on energy homeostasis, neuroendocrine and immune functions, glucose, and lipid metabolism are known, but there is little information about the relationship between these hormones with feeding in Intensive Care Units (ICU).
Leptin and ghrelin, like some other Gastrointestinal System (GIS) hormones, are secreted in a diurnal pattern. However, secretion may be affected by situations such as presence of nutrients in the intestinal lumen and low gastric pH. It is known that continuous enteral feeding may disrupt this physiology and the diurnal pattern of secretion of some hormones [5].
Our hypothesis is that the method of administration of enteral nutrition will affect plasma leptin and ghrelin levels. In order to test this hypothesis, this study verified whether the intermittent or continuous administration of enteral feeding had an effect on plasma leptin and ghrelin levels.
M E T H O D S
This prospective randomized study was approved by Ethics Committee of the Ondokuz Mayıs University (2013/475), and it was registered at ClinicalTrials.gov (NCT02282501) and conducted in accordance with the Helsinki Declaration. The present study was carried out at the Ordu University Education and Research Hospital, secondary Medical ICU, from August 2014 to October 2015. It included patients with dysphagia, aged from 18 to 85 years, who would start receiving enteral nutrition. Exclusion criteria were patients with contraindications for enteral nutrition, irreversible coma, morbid obesity, advanced renal and liver failure, multiple trauma, burns, and serious or severe sepsis. Some patients were subsequently removed from the study due to monitoring duration of less than
fourteen days (because of death or discharge), use of corticosteroid or immunosuppressant medication, massive blood transfusion, development of severe sepsis or multiple organ failure, lack of tolerance of enteral nutrition or not reaching the expected calorie content within 3 days, blood sugar >200mg.dL-1 in spite of insulin treatment, and if they underwent an open gastrostomy or had a jejunostomy history.
All patients included in the study and/or their relatives signed the Informed Consent Form. After anamnesis and physical examination, demographic data were collected, and Sequential Organ Failure Assessment, Acute Physiology and Chronic Health Evaluation II, and Glasgow Coma Score scores were recorded for the patients. All patients had a 12-14 Fr feeding tube inserted through the nasal pathway, and gastric insertion was confirmed radiologically and clinically. Patients were randomly allocated to two groups using a computer generated sequence of numbers and a sealed envelope technique. Group 1 (n=19) patients received enteral feeding of 4-hour infusions with 1 hour break during 24 hours. Group 2 (n=19) patients were administered enteral feeding of at least 30 minutes 6-8 times within a 24 hour period and were not fed for 6 hours after midnight.
infusion volume was reduced and prokinetic agents were used, if necessary.
During feeding, the head of the bed was raised to an angle of 30-45°, and the solutions were administered at room temperature; afterwards, the tube was flushed with 20-30mL of tap water. All patients received stomach protector medication (Ranitidine 50mg, Ulcuran amp, Yavuz İlaç, Istanbul, Turkey or pantoprazole 40mg, Pantpas flakon, Nycomedİlaç, Istanbul-Turkey) by IV administration. Intubated patients were sedated to achieve 3-4 values on Ramsey Sedation Score for compliance with mechanical ventilation. During the study, patients were monitored for signs of gastrointestinal intolerance (vomiting, diarrhea, etc.), and developing complications were recorded. Patients’ daily basal fluid requirements were calculated according to with body weight, as recommended by Holliday & Segar [6]. The daily fluid requirements that were not met with feeding solution administered were supplemented with an IV balanced electrolyte solution based on vital function parameters (mean arterial pressure, pulse, hourly urine output, central venous pressure).
Patients’ hemogram was recorded daily; urea and creatinine levels were measured daily, and total bilirubin, triglyceride, total protein, cholesterol, activated partial throboplastin time, albumin, prealbumin, and C-reactive protein levels measured twice a week. For the measurement of leptin and ghrelin levels, venous blood samples were taken on the 1st, 7th, and 14th day (T0, T1, and T2) between 6-8 am in 10mL-flat bottom tubes. Since peptides in cells are easily disintegrated by protease, to accurately measure serum ghrelin amounts, approximately 20-30µL of the protease inhibitor aprotinin were added per each mL of blood to the tubes. Blood samples were centrifuged for 10 minutes at 2000xg, placed in sterile eppendorfs, and stored at -80°C in a freezer until analysis. Serum was allowed to thaw, and the tubes were inverted several times for homogenization before analysis.
Serum leptin and ghrelin levels were measured using the Enzyme-Linked Immunosorbent Assay (ELISA, BioTek ELX800 reader, BioTek ELX50 washer, Winooski, Vermont, United States). Quantitative determination of serum leptin was performed by sandwich enzyme immunoassay (Leptin-Sandwich-ELISA, EIA-2395, DRG Instruments GmbH, Marburg, Germany), and serum ghrelin was measured using the double-antibody sandwich ELISA (Human Ghrelin ELISA Kit, DZE201120973, Sunredbio, Shanghai, China), according to the manufacturer’s instructions.
Power analysis and statistical analysis
Based on a study on the effect of bolus tube feeding on leptin and ghrelin concentration in healthy volunteers [7], power analysis was carried out using with the Minitab 13.0 statistical software (State College, Pennsylvania, United States), at 95% confidence interval, with 80% power and equal number of patients (17) in each group. Considering participant dropout, the groups included 19 patients.
R E S U L T S
Data of a total of 37 patients were assessed (Figure 1). Descriptive statistics for the patients included in the study and the comparison of variables between the groups are given in Table 1. As can be seen from Table 1, the differences
between the feeding groups are not statistically significant for all variables (p>0.05).
The frequency distribution of categorical variables such as sex, underlying disease, and complications for the 37 patients investigated, and the comparison of this frequency distribution
Table 1. Descriptive statistics and results of t-test/Mann-Whitney U test. Ordu, Turkey (2014-2015).
Parameters Continuous feeding (n=19) Intermittent feeding (n=18) p-value
Mean SD Median Mean SD Median
Age (year) 75.74 13.15 80 77.83 8.76 80.0 0.574NS
Apache II 22.74 4.78 23 23.61 3.05 23.5 0.242NS
GCS 9.68 2.21 10 9.17 1.50 9.0 0.533NS
SOFA 4.89 1.79 5 5.39 1.24 5.0 0.323NS
BMI (kg/m2) 25.47 3.02 26 23.83 3.01 22.5 0.108NS
Calculating calories (kcal) 1731.60 194.51 1700 1622.20 296.16 1700.0 0.191NS
Days of entubation 9.05 6.18 10 8.83 6.49 11.5 0.915NS
Note: NS: Statistically Not Significant (according to t-test, p>0.05 and according to Mann-Whitney U test, p>0.05).
Apache: Acute Physiology and Chronic Health Evaluation; GCS: Glasgow Coma Scale; SOFA: Sequential Organ Failure Assesment; BMI: Body Mass Index; SD: Standard Deviation.
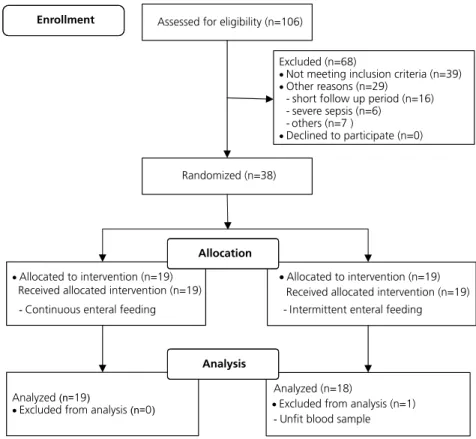
Figure 1. Flow diagram of the randomized trial.
Assessed for eligibility (n=106)
Excluded (n=68)
Not meeting inclusion criteria (n=39)
Other reasons (n=29)
- short follow up period (n=16) - severe sepsis (n=6)
- others (n=7 )
Declined to participate (n=0)
Enrollment
Randomized (n=38)
Allocated to intervention (n=19)
Received allocated intervention (n=19)
-Continuous enteral feeding
Allocated to intervention (n=19)
Received allocated intervention (n=19) - Intermittent enteral feeding
Allocation
Analyzed(n=19)
Excluded from analysis(n= )0
Analyzed (n=18)
Excluded from analysis (n=1)
-Unfit blood sample
between the groups are given in Table 2. Table 2 shows that the frequency distributions are not dependent on the feeding group (p>0.05) for all variables. In the continuous enteral nutrition group, 2 patients (10.2%) had diarrhea, and in the intermittent enteral nutrition group, 1 patient (5.5%) had diarrhea and 2 (11.1%) had vomiting. There was no statistically significant difference between the groups in terms of GIS-related complications (p>0.05).
The laboratory parameters and time-based statistics are given in Table 3. Table 3 also shows the differences in these variables between the groups, according to time and the two-way analysis of variance, evaluating the association between these factors and the Bonferroni post-hoc test results (if necessary). As shown in Table 3, the differences between the groups with respect to the change in the hematologic and biochemical blood parameters during the time periods were not statistically
significant (p>0.05). Whereas, the differences in White Blood Cell (WBC), platelet, creatinine, total bilirubin, C-Reactive Protein (CRP), and ghrelin parameters were statistically significant over time (p<0.01, p<0.01, p<0.05, p<0.05, 0.001, p<0.01, respectively), the differences in the group means were not statistically significant (p>0.05). As for the other variables, both differences in time and group means were not statistically significant (p>0.05). In other words, the means did not vary between the groups or at different times.
D I S C U S S I O N
In the present study investigating the effects of continuous and intermittent enteral nutrition on leptin and ghrelin levels, in terms of morning plasma leptin and ghrelin levels, there was no statistically significant difference between continuous and intermittent enteral nutrition feeding regimens.
Table 2. Frequency distribution and results of Chi-square test for categorical variables based on the groups evaluated. Ordu, Turkey (2014-2015).
Note: MV: Mechanical Ventilation.
Parameters Continuous feeding Intermittent feeding p-value
n % n %
Outcome
Inpatients 7 36.8 6 33.3
0892
Discharged 4 21.1 5 27.8
Exitus 8 42.1 7 38.9
Respiratory type
Spontaneous 4 21.1 5 27.8
0.892
Mechanical ventilation 8 42.1 7 38.9
Spontaneous + MV 7 36.8 6 33.3
Patient acceptance
Emergency service 9 47.4 11 61.1
0.839
In-hospital 7 36.8 6 33.3
Other Intensive Care Unit 2 10.5 1 5.6
Other hospital 1 5.3 0 0.0
Underlying diseases
Respiratory disease 7 36.8 7 38.9
0.922
Cardiovascular disease 1 5.3 2 11.1
Neurologic disease 6 31.6 5 27.8
Gastrointestinal disease 2 10.5 1 5.6
Urologic disease 2 10.5 1 5.6
Known as the satiety hormone, leptin is mainly synthesized in adipose tissue, and low
levels have been detected in the placenta, gastric epithelium, skeletal muscle, pituitary, and breast
Table 3. Descriptive statistics and results of Analyse of Variance (ANOVA) for blood parameters. Ordu, Turkey (2014-2015).
Parameter Period
Continuous feeding (n=19) Intermittent feeding (n=18)
Mean SEM SD Mean SEM SD Grand Mean (n=37)
Mean ± SEM WBC
x10.e3.uL-1
1 10.842 0.842 3.671 11.389 1.329 5.638 11.108 ± 0.768AB
2 11.316 0.905 3.945 12.167 1.294 5.491 11.730 ± 0.775A
3 9.526 1.135 4.948 9.833 1.532 6.501 9.676 ± 0.933B
G Mean 10.561±0.559 11.130±0.798
p-value Group: 0.704NS; Time: 0.010**; GroupXPeriod Int: 0.922NS
APTT sec
1 31.595 1.708 7.447 28.678 0.924 3.918 30.176 ± 1.002
2 34.405 2.019 8.802 30.139 1.266 5.372 32.330 ± 1.242
3 33.163 1.437 6.266 31.533 1.866 7.915 32.370 ± 1.161
G Mean 33.054±0.997 30.117±0.813
p-value Group: 0.072NS; Time: 0.201NS; GroupXPeriod Int: 0.638NS
Albumin g.dL-1
1 2.782 0.112 0.487 2.733 0.080 0.340 2.758 ± 0.069
2 2.742 0.074 0.322 2.628 0.063 0.265 2.687 ± 0.049
3 2.826 0.103 0.450 2.828 0.072 0.306 2.827 ± 0.063
G Mean 2.783±0.056 2.730±0.042
p-value Group: 0.527NS; Time: 0.190NS; GroupXPeriod Int: 0.754NS
CRP mg.dL-1
1 8.530 1.298 5.657 8.934 1.096 4.649 8.727 ± 0.842A
2 6.688 0.786 3.427 6.236 0.787 3.340 6.468 ± 0.550B
3 5.763 0.467 2.035 5.511 0.710 3.0115 5.641 ± 0.415B
G Mean 6.994±0.542 6.894±0.538
p-value Group: 0.914NS; Time: 0.000***; GroupXPeriod Int: 0.842NS
Prealbumin mg.dL-1
1 9.790 0.812 3.537 9.944 0.834 3.539 9.865 ± 0.574
2 11.053 1.02448 4.466 11.389 0.682 2.893 11.216 ± 0.614
3 10.632 0.6269 2.733 11.444 0.776 3.294 11.027 ± 0.494
G Mean 10.491±0.480 10.926±0.445
p-value Group: 0.613NS; Time: 0.087NS; GroupXPeriod Int: 0.874NS
Leptin ng.mL-1
1 4.905 0.951 4.143 4.669 0.540 2.28875 4.790 ± 0.547
2 5.311 1.060 4.618 5.194 0.795 3.37438 5.254 ± 0.658
3 5.227 0.964 4.201 4.979 0.927 3.93284 5.107 ± 0.661
G Mean 5.148±0.563 4.947±0.438
p-value Group: 0.867NS; Time: 0.472NS; GroupXPeriod Int: 0.982NS
Ghrelin pg.mL-1
1 2595.890 366.076 1595.690 2635.560 318.488 1351.231 2615.190 ± 240.254B
2 2946.320 535.376 2333.648 4481.670 577.049 2448.210 3693.240 ± 407.981A
3 2817.890 417.489 1819.794 4073.440 511.130 2168.541 3428.700 ± 340.160A
G Mean 2787.702±253.000 3730.222±294.000
p-value Group: 0.089NS; Time: 0.003**; GroupXPeriod Int: 0.054NS
Note: NS: Statistically Not Significant (according to t-test, p>0.05); *Statistically significant (according to ANOVA, p<0.05); **Statistically
significant (according to ANOVA, p<0.01); ***Statistically significant (according to ANOVA, p<0.001) means that do not share a common
uppercase letter are significantly different (according to Bonferroni test, p<0.05).
glands, and its receptors can be found in the hypothalamus [1]. The main role of leptin in the body is a negative feedback signal regulating food intake and energy metabolism. It is thought to have a role in many physiological situations such as reproduction, hematopoiesis, gastrointestinal functions, angiogenesis, sympathetic nervous system regulation, determination of bone density and thermogenesis [8]. Glucose, fatty acids, sympathetic nervous system, insulin, glycocorticoids, growth hormones, and catecholamine play a role in the synthesis and release of leptin. Leptin is released in a pulsatile and diurnal pattern. Serum leptin levels begin to increase after lunch, and its peak occurs in the middle of the night, reducing to lowest levels in the early morning hours [9]. The amount of fat is a major determinant of leptin levels in the body. There is a correlation between obesity, diabetes Mellitus, and especially fasting serum insulin levels and serum leptin levels [1].
In this study, there was no statistically significant difference between morning leptin levels in patients administered continuous and intermittent enteral nutrition. In the group that received intermittent feedings, blood samples were taken after 6 hours of fasting; therefore, it was expected that leptin levels would be lower than those of patients receiving continuous enteral nutrition. Since insulin increases in response to feeding causing leptin production, the decrease in insulin levels during fasting, causes a decrease in leptin concentrations [10]. There are studies that have demonstrated that feeding does not have a major effect on leptin concentration. Although Schoeller et al. [11] argued that feeding pattern is a physiological factor affecting the diurnal rhythm of leptin levels, these authors found no evidence of a signal for leptin level regulation.
Ghrelin is an adipogenic peptide mainly produced in the stomach. The effects of ghrelin on the body include the stimulation of growth hormone release, feeding behavior, carbohydrate and energy balance, gastric motility and gastric
acid secretion, cell proliferation, and endocrine and exocrine functions of the pancreas [3]. Ghrelin secretion by the stomach is largely linked to nutritional status. Ghrelin levels increase in the preprandial period and decrease in the postprandial period. Additionally, ghrelin levels are subject to diurnal variations and are affected by age, sex, body mass index, growth hormone, glucose, and insulin [12].
The level of ghrelin is controlled by body weight in the long term. Ghrelin levels increase with weight loss and decrease with weight gain. Studies of obese individuals have reported an inverse correlation between insulin resistance and hyperinsulinemia with ghrelin concentration [3,13]. Increased plasma levels of ghrelin due to fasting have been reported to reduce after eating, especially foods rich in sugar and fat [14].
It has been shown that continuous enteral nutrition does not reduce appetite and nutrition intake [15]. A study of 6 healthy volunteers with bolus enteral nutrition reported that food intake and ghrelin concentrations in circulation were suppressed [7]. In this study, a positive correlation was found between daily food intake and ghrelin concentration, but a negative correlation was found with leptin, insulin, glucose, and glucagon during bolus feeding. In the present study, in the intermittent enteral nutrition group, morning plasma ghrelin levels of patients were higher than those of patients in the continuous enteral nutrition group. Although this difference was not statistically significant, it was at the limit of significance (p=0.054).
In a new review comparing continuous and intermittent enteral nutrition in the ICU in terms of nutritional status, patient tolerance and complications, the authors reported insufficient evidence to support one method over the other [19]. Another study comparing continuous and bolus enteral nutrition in the ICU reported that there was no significant difference between the groups in terms of occurrence of aspiration, high gastric residual volume, vomiting, and diarrhea [16].
The most common GIS complications of enteral nutrition are nausea and vomiting, high gastric residual volume, diarrhea, and constipation. Due to this type of complications, patients receiving enteral nutrition do not to reach targeted values. Another concern related to high gastric residual volume is the risk of aspiration. A study comparing intermittent and continuous enteral nutrition in the ICU found diarrhea and vomiting rates of 20% and 5%, respectively, in continuously fed patients; these rates were reported as 15% and 20% in the intermittent group [20]. Another study comparing continuous and bolus enteral nutrition in critical patients did not identify differences in terms of complications (the complication rate for diarrhea and vomiting was 14%) [21]. In the present study, GIS complication rates were similar to those reported in the literature, and there was no statistical difference between the groups.
The main limitation of this study is the multiple situations that are expected to affect leptin and ghrelin levels in the ICU. For example, it is reported that leptin levels increase during inflammatory events [22]. Again, similarly, changes in leptin levels are expected with sepsis [23]. In our study, CRP and WBC levels showed a statistically significant decrease in the 3rd measurement, and there was no difference between the groups. However, nothing can be said in terms of inflammation degree. Another limitation may be related to the evaluation of sufficient nutrition of patients. Due to the
relatively short duration of the present study and that no significant changes were expected, anthropometric measurements such as mid-upper arm circumference and triceps skin fold thickness were not performed. However, measuring patient weight in the ICU may have been valuable. In this study, there was no significant difference in the serum prealbumin levels, which was used to monitor nutritional sufficiency. Prealbumin is a sensitive test to evaluate nutritional status. The half-life of prealbumin is 2-3 days, and it is known to be a more sensitive marker for acute changes when compared to albumin [24].
The present study revealed that both continuous and intermittent enteral nutrition feeding regimens were well tolerated in ICU patients showing minor complications. The method of administration of enteral nutrition alone did not affect the plasma leptin and ghrelin levels. Randomized controlled large cohort trials are needed to compare intermittent and continuous enteral nutrition to determine which one is more adaptable to diurnal patterns of secretion metabolic hormones.
A C K N O W L E D G M E N T S
The authors would like to thank Assistant Professor Yeliz Kaşko Arici, Ordu University for helping wıth statistical analysis and Pharmacist, Burhanettin Sertaç Ayhan, Ordu University for helping with blood analysis.
C O N T R I B U T O R S
All authors contributed equally to all stages of conception and design of this study.
R E F E R E N C E S
2. Paz-Filho G, Mastronardi CA, Licinio J. Leptin treatment: Facts and expectations. Metabolism. 2015;64(1):146-56. https://doi.org/10.1016/j. metabol.2014.07.014
3. Müller TD, Nogueiras R, Andermann ML, Andrews ZB, Anker SD, Argente J, et al. Ghrelin. Mol Metab. 2015;4(6):437-60. https://doi.org/10.1016/j. molmet.2015.03.005
4. Kasacka I, Arciszewski M, Łebkowski W. Extraordinary level of hormone and number of ghrelin cells in the stomach and duodenum of an obese woman. Acta Histochem. 2014;116(1):230-4. https://doi.org/10.1016/j.acthis.2013.05.007 5. Bowers DF. The initiation and progression of tube
feeding. In: Zaloga GP, editor. Nutrition in critical care. Saint Louis: Mosby; 1994. p.361-9.
6. Holliday MA, Segar WE. The maintenance need for water in parenteral fluid therapy. Pediatrics. 1957;19(5):823-32.
7. Stratton RJ, Stubbs RJ, Elia M. Bolus tube feeding suppresses food intake and circulating ghrelin concentrations in healthy subjects in a short-term placebo-controlled trial. Am J Clin Nutr. 2008;88(1):77-83.
8. Klok MD, Jakobsdottir S, Drent ML. The role of leptin and ghrelin in the regulation of food intake and body weight in humans: A review. Obes Rev. 2007;8(1):21-34.
9. Licinio J, Negrão AB, Mantzoros C, Kaklamani V, Wong ML, Bongiorno PB, et al. Synchronicity of frequently sampled, 24-h concentrations of circulating leptin, luteinizing hormone, and estradiol in healthy women. Proc Natl AcadSci. 1998;95(5):2541-6.
10. Meier U, Gressner AM. Endocrine regulation of energy metabolism: Review of pathobiochemical and clinical chemical aspects of leptin, ghrelin, adiponectin, and resistin. Clin Chem. 2004;50(9):1511-25.
11. Schoeller DA, Cella LK, Sinha MK, Caro JF. Entrainment of the diurnal rhythm of plasma leptin to meal timing. J Clin Invest. 1997;100(7):1882-7. 12. Ariyasu H, Takaya K, Tagami T, Ogaw Y,
Hosada K, Akamizu T, et al. Stomach is a major source of circulating ghrelin, and feding state determines plasma ghrelin-like immunoreactivity levels in humans. J Clin Endocrinol Metab. 2001;86(10):4753-8.
13. Sato T, Nakamura Y, Shiimura Y, Ohgusu H, Kangawa K, Kojima M. Structure, regulation and function of ghrelin. J Biochem. 2012;151(2):119-28. https://doi.org/10.1093/jb/mvr134
14. Massanet PL, Petit L, Louart B, Corne P, Richard C, Preiser JC. Nutrition rehabilitation in the intensive care unit. JPEN J Parenter Enteral Nutr.
2015;39(4):391-400. https://doi.org/10.1177/0148 607114567901
15. Stratton RJ, Stubbs RJ, Elia M. Short-term continuous enteral tube feding schedules do not suppress appetite and food intake in healthy men in a placebo-controlled trial. J Nutr. 2003;133(8):2570-6.
16. Kadamani I, Itani M, Zahran E, Taha N. Incidence of aspiration and gastrointestinal complications in critically ill patients using continuous versus bolus infusion of enteral nutrition: A pseudo-randomised controlled trial. Aust Crit Care. 2014;27(4):188-93. https://doi.org/10.1016/j.aucc.2013.12.001 17. Tavares de Araujo VM, Gomes PC, Caporossi C.
Enteral nutrition in critical patients; should the administration be continuous or intermittent? Nutr Hosp. 2014;29(3):563-7. https://doi.org/10.3305/ nh.2014.29.3.7169
18. David A, Lloyd J, Powell-Tuck J. Artificial nutrition: Principles and practice of enteral feeding. Clin Colon Rectal Surg. 2004;17(2):107-18. https:// doi.org/10.1055/s-2004-828657
19. Aguilera-Martinez R, Ramis-Ortega E, Carratala- -Munuera C, Fernandez-Medina JM, Saiz-Vinuesa MD, Barrado-Narvion MJ. Effectiveness of continuous enteral nutrition versus intermittent enteral nutrition in intensive care patients: A systematic review. JBI Database System Rev Implement Rep. 2014;12(1):281-317.
20. Yousry A. Continuous versus bolus infusion of enteral nutrition in intensive care unit. AAMJ. 2012;10(3):Suppl-2.
21. Serpa LF, Kimura M, Faintuch J, Ceconello I. Effects of continuous versus bolus infusion of enteral nutrition in critical patients. Rev Hosp Clin Fac Med São Paulo. 2003;58(1):9-14.
22. Yousef AA, Amr YM, Suliman GA. The diagnostic value of serum leptin monitoring and its correlation with tumor necrosis factor-alpha in critically ill patients: A prospective observational study. Crit Care. 2010;14(2):R33. https://doi.org/10.1186/ cc8911
23. Tzanela M, Orfanos SE, Tsirantonaki M, Kotanidou A, Sotiropoulou Ch, Christophoraki M, et al. Leptin alterations in the course of sepsis in humans. In Vivo. 2006;20(4):565-70.
24. Yu PJ, Cassiere HA, Dellis SL, Manetta F, Kohn N, Hartman AR. Impact of preoperative prealbumin on outcomes after cardiac surgery. J Parenter Enteral Nutr. 2015;39(7):870-4. https://doi.org/10. 1177/0148607114536735