Assessment levels of the user’s
satisfaction in a private hospital
*ANÁLISE DA SATISFAÇÃO DOS USUÁRIOS DE UM HOSPITAL PRIVADO
ANÁLISIS DE SATISFACCIÓN DE LOS USUARIOS DE UN HOSPITAL PRIVADO
* Part of the thesis, “Análise dos níveis de satisfação dos usuários de um hospital privado”, University of São Paulo School of Nursing, 2008. 1 Nurse Supervisor at Hospital Adventista de São Paulo. São Paulo, SP, Brazil. [email protected] 2 PhD, Faculty at Professional Orientation Department, University of São
O
RIGINAL
A
R
TICLE
RESUMO
Trata-se de um estudo exploratório-descri-tivo de abordagem quantitativa, cujo obje-tivo foi analisar a satisfação dos usuários re-ferente aos serviços prestados em unidades de internação. O local da investigação foi um hospital privado do Município de São Paulo, e a amostra constituiu-se de 71 usuários. A coleta de dados ocorreu de março a agosto de 2007, por meio de um instrumento deri-vado da escala Service Quality do modelo avaliativo de Parasuraman et al. O nível de satisfação geral oscilou em torno de 95%, sendo garantia (96%) e confiabilidade (96%) as dimensões de maior relevância, seguidas da empatia (95%), responsividade (93%) e tangibilidade (88%). As equipes médica e de enfermagem apresentaram maiores ní-veis de satisfação, e 91% dos usuários de-monstraram intenção de indicar o hospital. Esta pesquisa permitiu conhecer os atribu-tos intervenientes na satisfação dos usuári-os da referida instituição, contribuindo para confirmar ou reformular os processos assis-tenciais e gerenciais.
DESCRITORES
Qualidade da assistência à saúde. Avaliação de serviços de saúde. Satisfação dos consumidores. Satisfação do paciente. Wilma Batista Souza da Cruz1, Marta Maria Melleiro2
ABSTRACT
The objective of this study was to analyze the satisfaction of the users of a private hospital in terms of a number of attributes of the ser-vices in units. This exploratory, descriptive study used a quantitative approach and was developed in a private hospital in the city of São Paulo. The casuistry consisted of 71 us-ers and data collection was performed dur-ing the period from March to August 2007, using a derivative of the scale model of the Service Quality (SERVQUAL) of the evaluative model of Parasuraman et al. The level of over-all satisfaction ranged around 95%. The as-surance (96%) and reliability (96%) were con-sidered the most important dimensions of quality, followed by empathy (95%), respon-siveness (93%) and tangibility (88%). Medi-cal and nursing staffs introduced high levels of satisfaction. 91% has intention to recom-mend the hospital. This research provided the knowledge of the attributes most important in terms of satisfaction and contributed to confirming or reshaping assistance and man-agement processes.
KEY WORDS
Quality of health care. Health services evaluation. Consumer satisfaction. Patient satisfaction.
RESUMEN
Se trata de un estudio exploratorio descripti-vo, de abordaje cuantitatidescripti-vo, cuyo objetivo fue analizar la satisfacción de los usuarios respec-to de los servicios prestados en unidades de internación. El trabajo se localizó en un hos-pital privado del Municipio de São Paulo, Bra-sil, y la muestra consistió en 71 usuarios. La recopilación de datos se realizó entre marzo y agosto de 2007, a través de un instrumento derivado de la escala Service Quality del mo-delo evaluativo de Parasuraman et al. El nivel de satisfacción general osciló en torno al 95%, resultando garantía (96%) y confiabilidad (96%) las dimensiones de mayor relevancia, seguidas de empatía (95%), responsividad
(93%) y tangibilidad (88%). Los equipos mé-dicos y de enfermería presentaron mayores niveles de satisfacción, y el 91% de los usua-rios manifestaron intenciones de recomendar al hospital. Esta investigación permitió cono-cer los atributos que hacen a la satisfacción de los usuarios de la referida institución, con-tribuyendo para confirmar los procesos asistenciales y gerenciales.
DESCRIPTORES
INTRODUCTION
When assessing the quality of health services, both pri-vate and public, controversies are raised regarding the most appropriate ways to measure users’ satisfaction levels, tak-ing into account their perception regardtak-ing service deliv-ery and the impact these satisfaction attributes generate.
In the users’ point of view, satisfaction occurs when their needs and expectations are met in a way that their percep-tions are positive and the expected results are achieved. Under this scope, measuring such perceptions has become a subject of study. However, there has been neither con-sensus nor uniformity in assessment proposals.
For this reason, a need for the development of users’ satisfaction assessment systems in the health sector is perative and can represent an important tool for the im-provement of management strategies for the sector.
It is understood that, through the implementation of these assessment systems, users will perceive the value of the services being delivered. This interaction is individual, although the same techniques are used; individual re-sponses both on the execution and the receiving of the service are different. Therefore, quality can be understood as the user’s level of satisfaction regarding any type of ser-vice. It can be defined, above all, as what users perceive (1),
and for the service provider, as technical and functional quality(2). Technical quality is defined according to the
ac-curacy in performing the techniques, procedures and diag-nosis and functional quality regarding the way a service is provided to the user.
Assessing a service is more complex than assessing a product. A product is tangible, and users can detect de-fects, check functioning, compare durability, and verify quality according to the manufacturer’s specifications, whilst a service is firstly compared, and then simultaneously produced and consumed. Possible defects are experienced and perceived, a fact that characterizes its inseparability (production–consumption). This inseparability enhances the importance of the relationship between service pro-viders and users, and also the variation in the quality of the service provided. Another feature of service is its short duration, meaning that it can neither be stored nor put into inventory.
Services are also intangible. They are judged by their per-formance, the experiences lived by those who use them. At the same time they are heterogeneous and can be differ-ently judged and performed according to service providers and users(3). In this way, the relationship between users’
pectations and perceptions are related as follows: when ex-pectations are lower than perceptions, good quality is per-ceived; when expectations are equal to perceptions, the quality perceived is acceptable; when expectations are higher than perceptions, poor quality is perceived(4).
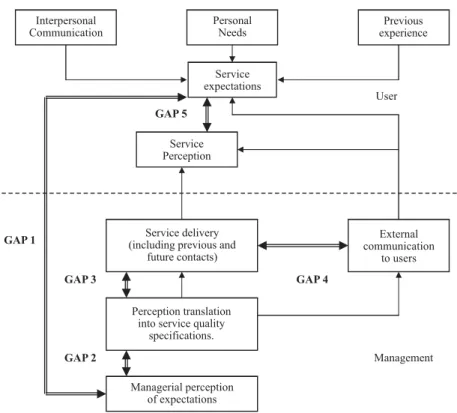
Figure 1 illustrates the assessment model, explaining service quality gaps.
Figure 1 - Services Quality GAP Model Interpersonal
Communication
Personal Needs
Previous experience
Service delivery (including previous and
future contacts)
External communication
to users
Perception translation into service quality
specifications.
Managerial perception of expectations
Service expectations
Service Perception
GAP 1
User
GAP 5
GAP 3
GAP 2
GAP 4
In Figure 1, five corporation gaps that are normally found between users’ expectations and perceptions are observed. They are the following: 1 – not acknowledging what users expect to receive; 2 – not selecting the correct service project and standards; 3 – not providing the standard ser-vice; 4 – not matching performance and promises; and 5 – established according to the four previous gaps(5).
With a view to understanding how users perceived and assessed service quality, the authors(5) created twelve
fo-cus groups, with three groups in each one of the four dif-ferent services investigated (retail bank, credit card, stock
broker, and maintenance and repair). Results obtained with these focus groups confirm that users are influenced by the dimensions of the process and not only by the service qual-ity assessment results. The pattern of answers obtained revealed ten general assessment criteria implemented by users, disregarding the type of service investigated.
After the statistics analysis to determine interrelation-ships concerning these dimensions, three remained unal-tered: tangibility, reliability and responsiveness (6). The seven
remaining criteria were inserted into two other dimensions: guarantee and empathy(7), as shown in the following chart:
Chart 1 - Original model and refined model of the five assessment dimensions of Parasuraman et al.
Original Model Refined Model Description
Tangibility Tangibility Physical aspects of what is provided to users.
Reliability Reliability The ability to accurately accomplish what was promised.
Responsiveness Responsiveness Ability to help users and promptly provide the service, capturing the notion of flexibility and the ability to adjust the service to the users' needs.
Competence Courtesy Credibility Safety
Guarantee Competence and courtesy extended to users and the safety provided throughoperations.
Access Communication Understanding the user
Empathy Individual attention provided to users.
Source; Marshall G, Murdoch L, 2001
Hence, Parasuraman, Zeithaml and Berry elaborated a psychometric scale of quality dimensions called Service
Qual-ity (SERVQUAL), the first attempt to put the technique in
prac-tice to construct users’ satisfaction. The SERVQUAL scale con-sisted of two actions with 22 affirmations regarding users’ expectations, and 22 regarding perceptions. Therefore, they should score expectations and perceptions of the service provided in each one of the dimensions considered as the most important, as well as their attributes(4-5).
In Brazil, the instrument developed and validated for health services(8) presents attributes that allow for users to
assess the different dimensions of the service. They are based on the five resulting dimensions from the studies(5),
according to the SERVQUAL scale model.
In face of these considerations, this study was devel-oped using the theoretical reference mentioned. We be-lieve that this theoretical reference will add value in deter-mining the users’ satisfaction in the health care theme.
OBJECTIVE
Analyze users’ satisfaction regarding a compound of service attributes provided in hospital units and medical and surgery clinics of a private hospital.
METHOD
This is an exploratory-descriptive study using a quanti-tative approach, with prospective data collection.
The study was carried out in the Adventist Hospital of São Paulo (HASP). This private health institution is located in the neighborhood of Liberdade and has been provid-ing services for more than 60 years to insured or private users living in the City of São Paulo and from the interior of the State, in addition to those from other states in the country.
Casuistry/sample was statistically calculated. Seventy-one users of the HASP surgery and medical clinics composed the sample. Inclusion criteria were: literate individuals, older than 18 years of age, under favorable medical conditions and with hospital stay times of over 3 days in surgery clin-ics or medical clinclin-ics.
Con-sent Form designed according to the recommendations of Resolution 196/96(9), of the National Council of Health.
Data collection was carried out throughout the period of March to August of 2007, through an instrument called
Assessment of the service provided by a private hospital
from the users’ point of view.
The data collection instrument is composed of two parts, where the first is composed of the identification of socio-de-mographic data and the second of measurable service at-tributes on a scale varying from 1 to 6, according to a ques-tionnaire validated by a Brazilian author(8), as mentioned above.
The researcher, with hospital discharges in hand, deliv-ered questionnaires and agreed with the participants on when to collect them.
For data analysis, computer resources were used: Win-dows Excel® and Statistic Package for Social SciencesR (10)
version 15.0 system, both in the Windows XP environment. Variables were analyzed descriptively. For quantitative vari-ables, the analysis was performed by observing minimum and maximum values and calculating averages, standard deviation and means. For qualitative variables, relative and absolute frequencies were calculated.
For statistical data analysis, Chi-Square and Exact (11) tests
were used. In the single-varied analysis of correlations be-tween constructions and satisfaction, the Pearson’s corre-lation coefficient was employed. The multi-varied study used the multiple linear regression model. With a view to select the main constructions that were associated with sat-isfaction, the Stepwise selection process was used. The sig-nificant level used for the tests was 5%.
RESULTS AND DISCUSSION
The age bracket among the 71 participants varied be-tween 25 and 99 years old, with the average being 68.2
years old and the mean 73.5 years old. Forty-one (57.7%) participants were females and 30 (42.3%) were males. The education level was registered as more than eleven years of school (66.2%). Forty-two (59.2%) medical clinics users and 29 (40.8%) from surgery clinics participated in this study. Sixty-eight (95.8%) users had some type of insurance and 3 (4.2%) were private users.
Assessment of hospital services is a process that requires useful information regarding quality and management, and also on users’ expectations and needs. Transformations in these practices value new understandings through a more logical dialogue within the team and with users, as well as the opportunity for the exploration of new concepts, sci-entific study and larger political and idealistic responsibil-ity from managers (12).
This study demonstrates elevated levels of trust in the institution, a necessary condition to drive users to return for the service.
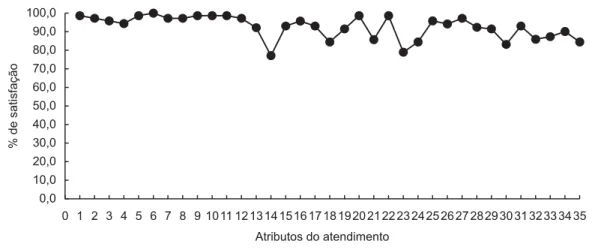
Satisfaction levels for care delivery attributes, presented in Figure 2, regard: 1-4 the medical team (1 attention-in-terest, 2 manners, 3 performance, 4 guidelines - explana-tions); 5-12 the nursing team ( 5- attention-interest, 6 man-ners, 7 performance, 8 explanations – guidelines, 9 care delivery, 10 waiting time for answering patient calls for as-sistance, 11 daily general quality, 12 night general quality);
13-20 the nutrition service (13 nutritionist care delivery,
14 meal quality-flavor, 15 food appearance, 16 tempera-ture, 17 quantity, 18 variety, 19 regularity, 20 kitchen staff attention); 21-28 the general attributes ( 21 comforta-bleness of room , 22 cleanliness, 23 bathroom facilities, 24 noise at night, 25 privacy, 26 treatment results, 27 guide-lines for outpatient treatment, 28 guideguide-lines for outpatient food intake), and 29 – 35 the initial service (29 information counter location, 30 waiting time, 31 courtesy, 32 quick-ness, 33 clear information, 34 general organization, 35 com-fort of the facilities while waiting).
0,0 10,0 20,0 30,0 40,0 50,0 60,0 70,0 80,0 90,0 100,0
0 1 2 3 4 5 6 7 8 9 10 11 12 13 14 15 16 17 18 19 20 21 22 23 24 25 26 27 28 29 30 31 32 33 34 35 Atributos do atendimento
%d
es
a
ti
s
fa
ç
ã
o
In Figure 2, the attributes that generated the most sat-isfaction, considering surgery and medical clinics, were 1 – attention –interest of the medical team, n=70 (98.6%); 5 – attention – interest of the nursing team, n=70 (98.6%); 6 – manners of the nursing team, n=71 (100%); 9 – care deliv-ery service of the nursing team, n=68 (98.6%); 11 – nursing quality during the day, n=70 ( 98.6%); 20 – kitchen maid attention serving the meal, n=70 (98.6%), and 22 - room cleanliness, n=70 (98.6%).
The attributes that most highly impacted satisfaction were 14 – meal flavor—quality, n=54 (76.0%); 23 – bathroom facilities, n=56 (78.9%) and 30 – waiting time for the initial service, n=59 (83.1%). Attributes’ total values that refer to the group of users from the medical and surgery clinics do not present significant variability among themselves.
The users’ satisfaction levels suggest a positive association between satisfaction and the attributes from the medical team. The doctors’ efforts in solving users’ problems is associated with adherence and to the success of the treatment. Also, un-derstanding medical information is considered important for the results of the treatment and for satisfaction purposes. The predominant dimensions were guarantee and empathy.
As for service attributes regarding the medical team, there was a variance between 92.4% and 100%. These re-sults could relate to emotional and cognitive aspects in the doctor-user relationship (working alliance), to the elder user-doctor relationship, to the high levels of respect of users who are more familiar with some doctors, to the in-formation provided by doctors, to the quality of the com-munication between doctors and users, to the trust in the professional, and to empathy(13). Satisfaction is related to
receiving attention, being provided with information and the interest demonstrated by the doctors in the users.
Regarding the attributes related to the nursing team (5 – 12), users demonstrate satisfaction in the service received. The predominant quality dimensions for these attributes are reliability and responsiveness. Users’ satisfaction is a nursing care delivery measure that serves as a quality indi-cator of the care provided in hospitals(14).
Also, users’ satisfaction regarding the care received is considered to be only a functional quality measure of the care. The provided technical care quality is understood, generally, as difficult to assess by users. In this way, satis-faction is not a completely appropriate measure for quality of care, since the attribute involves a broad scope of fac-tors. Nursing technical care quality is a difficult and com-plex concept to measure; however, studies demonstrate that, almost always, users express high levels of satisfac-tion with the care received(15).
The continuous search for care quality with a view to achieving excellence is fundamental. It is a dynamic and exhausting process of continuously identifying the inter-vening factors in the nursing team work process. It requires the implementation of actions by the nurse and the
elabo-ration of instruments that will enable quality care levels assessment in a systematic way of the service provided(16).
Countless factors contribute to achieving care quality, prov-ing as necessary the actions of a multidisciplinary team, in-cluding nutrition and dietary services. The role of this hospital service has been, for many years, to produce meals, a task that does not require technological or scientific competence. This perspective helps in understanding current challenges for the effective delivery of nutritional care into nutrition services. Also, it enhances the separation between meal production services and dietary services, a service that is currently within doctors’ and nutritionists’ scopes of practice. This separation, based on the thinking that considers hospital food control as a support activity for users, justifies the low acknowledgement of its therapeutic function, in addition to the still predomi-nant vision of such service as only producing meals(17).
While staying in hospital, inadequate food intake is high-lighted as a worsening trigger of the nutritional state of the user and is associated with an increase in morbidity and mortality rates and a lengthening of the average stay. Regarding users older than 65 years of age physiologic needs, the ability to taste food and digestion decrease and dietary conformity to doctor’s orders must also be consid-ered. This study demonstrated the need for interventions to improve dietary satisfaction levels, a fact that also high-lights the value of the participation of the nutritional ser-vices in the user’s therapy.
In addition, general attributes of the service were val-ued in regards to tangible and less subjective aspects of the users’ perception. They were: comfort, safety, privacy during the hospital stay and outpatient treatment. The fol-lowing figures affirm that users are satisfied regarding the following attributes: 22 – room cleanliness, n=71 (100%), 25 – privacy, n=68 (96%) and 27 – guidelines for outpatient treatment, n=66 ( 93%). Inversely, lower levels of satisfac-tion refer to 23 – bathroom facilities, n=56 (78.9%), 24 – noise level at night, n=60 (84.5%) and 28 - guidelines for food intake at home, n=65 (91.5%).
Guidelines regarding attribute 27 – treatment continu-ity- are strongly associated with high levels of satisfaction from users, suggesting that more effective guidelines for treat-ment continuity can enhance users’ levels of satisfaction re-garding this service. Results, when analyzed under this scope, indicate that users are satisfied with the guidelines received, with a discrete predominance in surgery clinics.
of higher complexity, humanizing the service, reducing costs, enhancing productivity, and engendering a good image of the hospital in the community(18-19).
Waiting time is one of the attributes considered by re-searchers to be a service dissatisfaction generator. Associa-tions between waiting time and the speed of initial data input previous to the service and hospital stay were not observed, suggesting that other reasons can justify the delay of some users in being admitted to the hospital.
This study observed that the most relevant dimension was guarantee (95.9%), followed by reliability (95.7%), a fact that is justified since it regards a health institution. Users consider empathy as the third most relevant attribute (95%), followed by responsiveness (93%) and tangibility (88%). The lowest lev-els of satisfaction are related to tangible aspects of the service and they cannot be attributed to the quality of hospital care. The attributes of guarantee, reliability and responsiveness can be inferred to be the highest satisfaction generators.
Recommending the hospital to a relative-friend was clas-sified as: I have doubts, and I would not recommend in 3 (4.2%) participants; I have doubts, but I would recommend in 3 (4.2%) participants; and Yes, I would recommend in 65 (91.5%) par-ticipants. Satisfied users tend to engage in favorable propa-ganda for the institution. Indicators such as willing to recom-mend and recommend to others are broadly-used measures to assess the global impact of users’ satisfaction.
The trust users demonstrate in regards to the hospital was classified as moderate trust in 4 (5.6%) users, high trust in 16 (22.5%) users and total trust in 51 (71.8%) users.
This investigation demonstrated a 95.8% level of satis-faction for the hospital.
CONCLUSIONS
The instrument used in this study allowed for learning about users’ levels of satisfaction in the surgery and
medi-cal clinics, and which attributes impacted general satisfac-tion. Female users were predominant; however, this differ-ence showed no statistical significance. Users with elevated educational levels were predominant and they were asso-ciated with high levels of satisfaction. Older users demon-strated satisfaction with the service.
Considering the percentage referring to the number of users in each clinic, all attributes showed satisfaction regard-ing the services focusregard-ing on the medical and nursregard-ing team.
Users demonstrated satisfaction regarding general at-tributes; inversely, the lowest levels of satisfaction were attributed to bathroom facilities, noise levels at night and guidelines for out-patient nutrition. Also, waiting time is an attribute that is considered as a dissatisfaction genera-tor for the service. No association between waiting time and quickness in filling out data before the service were observed, inferring that other aspects can justify the delay for some users to be admitted to the hospital.
High levels of satisfaction were achieved among users both in the medical clinic and the surgery clinic. Attributes of the service that require more attention from managers and the implementation of measures to improve users’ sat-isfaction levels in these attributes were detected. Regard-ing the attributes guarantee, reliability, responsiveness and empathy, we can infer that users from the institution – this study’s scenario- value these dimensions. They are more closely related to the performance of collaborators than to attributes that refer to responsiveness and tangibility. Tan-gibility presented the lowest levels of satisfaction.
Since tangible aspects of the service are easily measur-able, these results enable concrete interventions that can be detected by users.
Consequently, this research allowed for learning about the service attributes that interfere in users’ satisfaction in the HASP, contributing towards confirming or reformulat-ing management and care processes.
REFERENCES
1. Oliver RL. A cognitive model of the antecedents and consequences of satisfaction decisions. J Mark Res. 1980;17(4): 460-9.
2. Groonros C. A service quality model and its marketing implications. Eur J Mark. 1984;18(4):36-44.
3. Lovelock CH. Why marketing management needs to be different for services. Chicago: American Marketing Association; 1981.
4. Zeithaml V, Parasuraman A, Berry LL. Delivering service quality: balancing customer perceptions and expectations. New York: The Free Press; 1990.
5. Zeithaml V, Parasuraman A. Service quality. Cambridge: Mar-keting Science Institute; 1990.
6. Parasuraman, A, Zeithaml V, Berry LL. Refinement and reassessment of the SERVQUAL dimensions. J Retail. 1991;67(4):420-50.
7. Marshall G, Murdoch L. Service quality in consulting marke-ting engineers. Oxford: Oxford Brookes University; 2001.
9. Conselho Nacional de Saúde. Resolução n.196, de 10 de outubro de 1996. Dispõe sobre normas regulamentadoras de pesquisas envolvendo seres humanos. Bioética. 1996;4(2 Supl):15-25.
10. SPSS base user’s guide 12.0 [programa de computador]. Chi-cago; 2006.
11. Rosner B. Fundamentals of biostatistics. Boston: PWS; 1986.
12. Mehry EE. Em busca da qualidade dos serviços de saúde: os serviços de porta aberta para a saúde e o modelo tecnoassis-tencial em defesa da vida (ou como aproveitar os resíduos do cotidiano dos serviços de saúde e colegiadamente reorgani-zar o processo de trabalho na busca da qualidade das ações de saúde). São Paulo: Hucitec; 1994.
13. Willians S, Weinman J, Dale J. Doctor-patient communication and patient satisfaction: a review. Farm Pract. 1998;15(5): 480-92.
14. Gotlieb JB. Understanding the effects of nurses on the process by which patients develop hospital satisfaction. Holist Nurs Pract. 2002;16(5):49-60.
15. Waltz CF, Strickland OL, Lenz ER. Measurement in nursing and health research. Springer; 2005.
16. Mota NVVP, Melleiro MM, Tronchin DMR. A construção de indicadores de qualidade de enfermagem: relato da experi-ência do Programa de Qualidade Hospitalar. Rev Adm Saúde. 2007;9(34):9-14.
17. Garcia RWD. A dieta hospitalar na perspectiva dos sujeitos na sua produção e em seu planejamento. Rev Nutr. 2006;19(2):129-44.
18. Quinto N, Gastal FL. Acreditação hospitalar: proteção dos usuários dos profissionais e das instituições de saúde. Porto Alegre: Dacasa; 1997.