NURSING WORKLOAD AT A GASTROENTEROLOGY UNIT
1Marcia Raquel Panunto2 Edinêis de Brito Guirardello3
Panunto MR, Guirardello EB. Nursing workload at a gastroenterology unit. Rev Latino-am Enfermagem 2009 novembro-dezembro; 17(6):1009-14.
One of the biggest challenges nurses face is the need to justify the quantity and quality of staff for care delivery. For this, management instruments are available which help them to determine the staff needed in the nursing team. This descriptive study aims to evaluate the nursing workload at a specialized clinical and surgical gastroenterology unit. To collect data, the Nursing Activities Score (NAS) was used during 30 consecutive days, with 1080 comments, obtained from the records of 149 patients. The mean NAS score was 34.9% and, considering that each point of NAS corresponds to 0.24 hour, on the average, 8.4 hours of nursing care were required within 24 hours. This means that this profile is of patients who demand intermediate and semi-intensive care, which suggests that the NAS study can be used to evaluate the workload of nurses at that unit.
DESCRIPTORS: workload; nursing assessment; nursing staff
CARGA DE TRABAJO DE ENFERMERÍA EN UNA UNIDAD DE GASTROENTEROLOGÍA
Uno de los mayores desafíos enfrentados por el enfermero se refiere a la necesidad de justificar la cantidad y calidad de personal que se necesita en una unidad para la prestación de asistencia. Para eso, dispone de herramientas administrativas que auxilian en la determinación del personal necesario en el equipo de enfermería. Se trata de un estudio descriptivo, que tuvo por objetivo evaluar la carga de trabajo de enfermería en una unidad clínica y quirúrgica, especializada en gastroenterología. Para la recolección de datos, se utilizó el Nursing Activities Score (NAS) por 30 días consecutivos, totalizando 1.080 observaciones, obtenidas de los registros de 149 pacientes. El promedio de la puntuación del NAS fue de 34,9% y, considerando que cada punto del NAS corresponde a 0,24h, fueron requeridas, en promedio, 8,4 horas de enfermería para la asistencia en las 24h. Eso significa que el perfil de esos pacientes corresponde al de aquellos que requieren cuidados intermediarios y semi-intensivos, lo que sugiere que el NAS puede ser utilizado para evaluar la carga de trabajo de enfermería en la referida unidad.
DESCRIPTORES: carga de trabajo; evaluación en enfermería; personal de enfermería
CARGA DE TRABALHO DE ENFERMAGEM EM UMA UNIDADE DE GASTROENTEROLOGIA
Um dos maiores desafios enfrentados pelo enfermeiro refere-se à necessidade de justificar o quantitativo e qualitativo de pessoal para a prestação da assistência. Para isso, dispõe de ferramentas gerenciais que auxiliam na determinação do pessoal necessário na equipe de enfermagem. Trata-se, aqui, de estudo descritivo, que objetivou avaliar a carga de trabalho de enfermagem em uma unidade clínica e cirúrgica, especializada em gastroenterologia. Para a coleta de dados, utilizou-se o Nursing Activities Score (NAS) por 30 dias consecutivos, totalizando 1080 observações, obtidas do registro de 149 pacientes. A média da pontuação do NAS foi de 34,9% e, considerando que cada ponto do NAS corresponde a 0,24h, foram requeridas, em média, 8,4 horas de enfermagem na assistência nas 24h. Isso significa que o perfil desses pacientes corresponde ao daqueles que requerem cuidados intermediários e semi-intensivos, o que sugere que o NAS pode ser utilizado para avaliar a carga de trabalho de enfermagem na referida unidade.
DESCRITORES: carga de trabalho; avaliação em enfermagem; recursos humanos de enfermagem
Faculdade de Ciências Médicas, Universidade Estadual de Campinas, Brazil:
1Basic Scientific FAPESP, Process nº 2007/59957-1. 2RN, e-mail: [email protected]. 3Associate Professor, e-mail: [email protected].
INTRODUCTION
O
ne of the biggest challenges nurses face isthe need to justify the quantity and quality of staff for
care delivery to clients. This process can result in
conflicts, however, as the growing need to decrease
costs and increase nursing service delivery arouses
questions about institutions’ nursing staff (1).
For service management to justify a given
nursing staff, nowadays, nurses have management
tools at their disposal to rank patients in terms of
care complexity level, consequently helping to
determine the nursing staff needed for quality care
delivery. These include instruments developed in Brazil
for adult hospitalized patients(2-6), for residency
nursing(7) and for pediatric patients(8), as well as others
validated for the Brazilian culture, such as the
Therapeutic Intervention Scoring System (TISS-28)(9)
and the Nursing Activities Score (NAS)(10).
Differently from the above instruments, the
NAS assesses the number of nursing hours spent per
patient during one work shift, based on its total score
(10-11)
. It contains 23 items, which cover basic activities
(monitoring, medication, hygiene procedures,
administrative tasks, among others), mechanical
ventilation, cardiovascular, renal, neurological and
metabolic support, besides specific interventions. The
sum of these items shows the time nursing activities
consume in 24-hour patient care delivery. Scores can
range from zero to 100 (%) or more, which can mean
that more than one nursing professional was needed
to deliver care to the patient on a given day(11).
Although the NAS was constructed for
application to patients from critical care units, it is
considered useful to assess nursing workload at
tertiary and quaternary hospital units, where clients’
care complexity level is high. It should be reminded
that the NAS score does not depend on patient
severity, as its construction and validation were based
on nursing activities(11).
The Patient Classification System (PCS)(2,4)
has been used for staff dimensioning at hospitalization
units, classifying patients in care groups or categories.
While this type of tool identifies the patient’s level of
complexity, the NAS permits measuring the workload
in terms of direct and indirectly related nursing care
hours. However, studies using the NAS have been
applied to ICU patients, evidencing its reliability to
assess workloads for patients who require intensive
care(12-15).
The choice of a patient classification instrument
to identify the workload should not only be based on
its specific indication, but should also take into account
an institution’s care delivery dynamics and complexity.
In view of difficulties to apply an instrument
that permits classifying patients into care complexity
levels, this research aims to measure the nursing
workload at a clinical and surgical unit like
gastroenterology.
METHOD
This descriptive study was carried out at a
gastroenterology unit of a teaching hospital in the
interior of São Paulo state. The unit is subdivided into
two nursing wards, gastroclinic and gastrosurgery,
totaling 36 beds, eight for the gastroclinic and 28 for
gastrosurgery.
To collect data, the NAS was used to measure
the nursing workload, besides a form to characterize
the patients’ demographic and clinical data. For the
study, all adult patients attended at the unit during
the research period were considered.
Approval for the research was obtained from
the institution’s Ethics Committee (Process No 758/
2007), requesting dispensation from the signing of
the free and informed consent term (FICT). This
request was justified to the Ethics Committee as the
assessment of patient care demands is considered a
daily nursing activity and because the patient was
not submitted to any other procedure in function of
the application of the instrument.
Before data collection, the instrument was
submitted to a 15-day pretest to allow the researcher
to become familiar with the tool and adapt some of
its aspects to the patients’ profile at the unit. The
researcher herself collected the data during 30
consecutive days, from April 14th to May 14th 2008.
Data were collected based on patient assessment,
information in nursing notes and patient files, as well
as verbal information provided by the nursing team
which was not recorded in the files.
The collected data were transferred to a
Microsoft® Excel worksheet and analyzed through
SPSS® 16.0 for Windows. Frequency tables were
elaborated for the categorical variables and descriptive
statistics (mean, standard deviation, median,
minimum and maximum) for the continuous variables.
between the posts and the categorical variables, and
Fisher’s exact test was applied when expected levels
were below five. Mann-Whitney’s non-parametric test
was used to compare the wards in terms of categorical
variables. The significance level was set at 5%, i.e. p
≤0.05.
RESULTS
The NAS was applied during 30 consecutive
days to the 36 beds at the gastroenterology unit
(gastroclinic and gastrosurgery nursing wards),
totaling 1080 observations, obtained from 149 patients’
records. To measure the workload at the unit, the
researcher decided to consider the bed, independently
from the subject occupying it. Hence, the collected
data followed bed occupation dynamics.
In the group of 149 patients, 56.4% came
from gastrosurgery and 43.6% from the gastroclinic.
Most cases referred to elective hospitalization. Mean
age at the unit was 50 years (min=18 and max=90),
and patients’ mean hospitalization time was 7 days
(min=1 and max=67). In this group, 59.7% were men
and 40.3% women.
Data indicated that, at the gastroclinical ward,
male patients with liver diseases predominated when
compared with the gastrosurgery ward. On the other
hand, in gastrosurgery, most patients were
hospitalized for less than five days and were submitted
to surgical treatment.
T h e w o r k l o a d a c c o r d i n g t o t h e N A S ,
including mean and median scores for the unit and
w a r d s , i s s h o w n i n Ta b l e 1 . M i n i m u m s c o r e s
equalling zero mean that the bed was empty during
a data collection day.
t i n
U N Mean SD Median Minimum Maximum pvalue*
c i n il c o r t s a
G 540 37.2 23.9 35.6 0 136 0.001 y r e g r u s o r t s a
G 540 32.6 20 29.9 0 113 l
a t o
T 1080 34.9 22.2 33.7 0 136
Table 1 – NAS workload score at gastroenterology unit (%). Campinas, 2008
*Mann-Whitney
The observation of mean NAS scores per bed
revealed that four beds, with generators, located in
two rooms at the gastroclinical ward, obtained the
highest mean workload scores, ranging between 44.9
and 68.3%, when compared with other beds at the
unit. On the other hand, the four beds at the
gastrosurgery ward, with the same characteristic,
scored equal or lower than other beds at this ward.
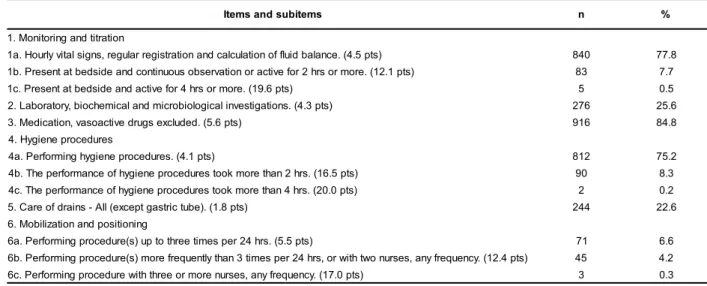
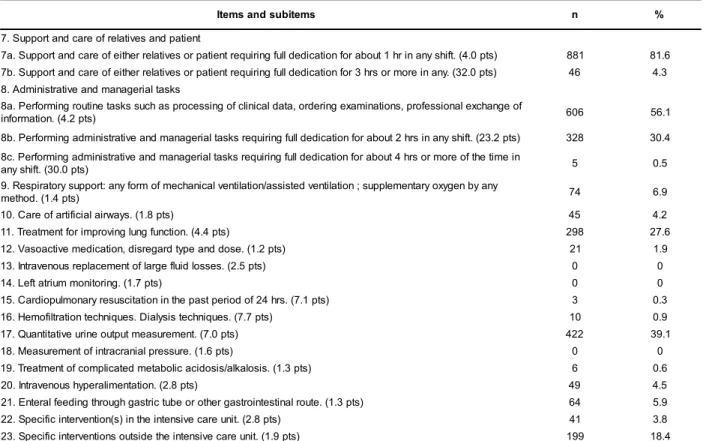
As the NAS permits identifying nursing
activities during 24-hour patient care, the recording
frequency of instrument items and subitems can be
calculated (Table 2).
Table 2 - Frequency of item and subitem performance of Nursing Activities Score. Campinas, 2008
s m e t i b u s d n a s m e t
I n %
n o i t a r t i t d n a g n i r o t i n o M . 1 ) s t p 5 . 4 ( . e c n a l a b d i u l f f o n o i t a l u c l a c d n a n o i t a r t s i g e r r a l u g e r , s n g i s l a t i v y l r u o H . a
1 840 77.8
) s t p 1 . 2 1 ( . e r o m r o s r h 2 r o f e v i t c a r o n o i t a v r e s b o s u o u n i t n o c d n a e d i s d e b t a t n e s e r P . b
1 83 7.7
) s t p 6 . 9 1 ( . e r o m r o s r h 4 r o f e v i t c a d n a e d i s d e b t a t n e s e r P . c
1 5 0.5
) s t p 3 . 4 ( . s n o i t a g i t s e v n i l a c i g o l o i b o r c i m d n a l a c i m e h c o i b , y r o t a r o b a L .
2 276 25.6
) s t p 6 . 5 ( . d e d u l c x e s g u r d e v i t c a o s a v , n o i t a c i d e M .
3 916 84.8
s e r u d e c o r p e n e i g y H . 4 ) s t p 1 . 4 ( . s e r u d e c o r p e n e i g y h g n i m r o f r e P . a
4 812 75.2
) s t p 5 . 6 1 ( . s r h 2 n a h t e r o m k o o t s e r u d e c o r p e n e i g y h f o e c n a m r o f r e p e h T . b
4 90 8.3
) s t p 0 . 0 2 ( . s r h 4 n a h t e r o m k o o t s e r u d e c o r p e n e i g y h f o e c n a m r o f r e p e h T . c
4 2 0.2
) s t p 8 . 1 ( . ) e b u t c i r t s a g t p e c x e ( ll A -s n i a r d f o e r a C .
5 244 22.6
g n i n o i t i s o p d n a n o i t a z il i b o M . 6 ) s t p 5 . 5 ( . s r h 4 2 r e p s e m i t e e r h t o t p u ) s ( e r u d e c o r p g n i m r o f r e P . a
6 71 6.6
) s t p 4 . 2 1 ( . y c n e u q e r f y n a , s e s r u n o w t h t i w r o , s r h 4 2 r e p s e m i t 3 n a h t y l t n e u q e r f e r o m ) s ( e r u d e c o r p g n i m r o f r e P . b
6 45 4.2
) s t p 0 . 7 1 ( . y c n e u q e r f y n a , s e s r u n e r o m r o e e r h t h t i w e r u d e c o r p g n i m r o f r e P . c
6 3 0.3
Table 2 - Continuation s m e t i b u s d n a s m e t
I n %
t n e i t a p d n a s e v i t a l e r f o e r a c d n a t r o p p u S . 7 ) s t p 0 . 4 ( . t f i h s y n a n i r h 1 t u o b a r o f n o i t a c i d e d ll u f g n i r i u q e r t n e i t a p r o s e v i t a l e r r e h t i e f o e r a c d n a t r o p p u S . a
7 881 81.6
) s t p 0 . 2 3 ( . y n a n i e r o m r o s r h 3 r o f n o i t a c i d e d ll u f g n i r i u q e r t n e i t a p r o s e v i t a l e r r e h t i e f o e r a c d n a t r o p p u S . b
7 46 4.3
s k s a t l a i r e g a n a m d n a e v i t a r t s i n i m d A . 8 f o e g n a h c x e l a n o i s s e f o r p , s n o i t a n i m a x e g n i r e d r o , a t a d l a c i n il c f o g n i s s e c o r p s a h c u s s k s a t e n i t u o r g n i m r o f r e P . a 8 ) s t p 2 . 4 ( . n o i t a m r o f n
i 606 56.1
) s t p 2 . 3 2 ( . t f i h s y n a n i s r h 2 t u o b a r o f n o i t a c i d e d ll u f g n i r i u q e r s k s a t l a i r e g a n a m d n a e v i t a r t s i n i m d a g n i m r o f r e P . b
8 328 30.4
n i e m i t e h t f o e r o m r o s r h 4 t u o b a r o f n o i t a c i d e d ll u f g n i r i u q e r s k s a t l a i r e g a n a m d n a e v i t a r t s i n i m d a g n i m r o f r e P . c 8 ) s t p 0 . 0 3 ( . t f i h s y n
a 5 0.5
y n a y b n e g y x o y r a t n e m e l p p u s ; n o i t a l i t n e v d e t s i s s a / n o i t a l i t n e v l a c i n a h c e m f o m r o f y n a : t r o p p u s y r o t a r i p s e R . 9 ) s t p 4 . 1 ( . d o h t e
m 74 6.9
) s t p 8 . 1 ( . s y a w r i a l a i c i f i t r a f o e r a C . 0
1 45 4.2
) s t p 4 . 4 ( . n o i t c n u f g n u l g n i v o r p m i r o f t n e m t a e r T . 1
1 298 27.6
) s t p 2 . 1 ( . e s o d d n a e p y t d r a g e r s i d , n o i t a c i d e m e v i t c a o s a V . 2
1 21 1.9
) s t p 5 . 2 ( . s e s s o l d i u l f e g r a l f o t n e m e c a l p e r s u o n e v a r t n I . 3
1 0 0
) s t p 7 . 1 ( . g n i r o t i n o m m u i r t a t f e L . 4
1 0 0
) s t p 1 . 7 ( . s r h 4 2 f o d o i r e p t s a p e h t n i n o i t a t i c s u s e r y r a n o m l u p o i d r a C . 5
1 3 0.3
) s t p 7 . 7 ( . s e u q i n h c e t s i s y l a i D . s e u q i n h c e t n o i t a r tl i f o m e H . 6
1 10 0.9
) s t p 0 . 7 ( . t n e m e r u s a e m t u p t u o e n i r u e v i t a t i t n a u Q . 7
1 422 39.1
) s t p 6 . 1 ( . e r u s s e r p l a i n a r c a r t n i f o t n e m e r u s a e M . 8
1 0 0
) s t p 3 . 1 ( . s i s o l a k l a / s i s o d i c a c il o b a t e m d e t a c il p m o c f o t n e m t a e r T . 9
1 6 0.6
) s t p 8 . 2 ( . n o i t a t n e m il a r e p y h s u o n e v a r t n I . 0
2 49 4.5
) s t p 3 . 1 ( . e t u o r l a n i t s e t n i o r t s a g r e h t o r o e b u t c i r t s a g h g u o r h t g n i d e e f l a r e t n E . 1
2 64 5.9
) s t p 8 . 2 ( . t i n u e r a c e v i s n e t n i e h t n i ) s ( n o i t n e v r e t n i c i f i c e p S . 2
2 41 3.8
) s t p 9 . 1 ( . t i n u e r a c e v i s n e t n i e h t e d i s t u o s n o i t n e v r e t n i c i f i c e p S . 3
2 199 18.4
In items 1, 4, 6, 7 and 8, only one subitem can be scored
DISCUSSION
Study data appoint the predominance of male
patients, submitted to surgical treatment and
hospitalized for less than five days. The greatest
hospitalization turnover was found at the
gastrosurgical ward.
At that ward, most patients were admitted
for surgical patients, but patients for clinical treatment
were also attended, as some of these, in the late
post-operative period, are hospitalized for clinical
compensation. At the gastroclinic, on the other hand,
these percentages did not differ because the unit
offers beds for clinical as well as surgical care.
According to the NAS, the mean workload at
the gastroenterology unit was 34.9%. The comparison
between both wards showed a difference, with a
higher score for the gastroclinical than for the
gastrosurgery ward. These results could not be
compared with other studies, however, as the
application of this instrument has been restricted to
intensive care units, but some of the reasons for these
differences can be due to the level of dependence
and clinical procedures performed. Studies carried
out at ICU appoint a higher mean workload(10,12-15) than
what was found in this research, although one of those
studies(14) reported a lower minimum NAS score than
the mean score found at the gastroenterology unit.
The gastroclinical ward obtained the highest
mean workload scores, for beds with generators as
well as for other beds at the ward, which means that
these beds were occupied by patients with greater
nursing care demands. It is interesting to highlight
that, in gastrosurgery, some of the beds not equipped
for care delivery to patients with high care demands
scored the same or higher than beds with generators.
The most frequent NAS items were: 1a. Hourly vital signs, regular registration and calculation of fluid balance; 3. Medication, vasoactive drugs excluded; 4a. Performing hygiene procedures; 7a. Support and care of either relatives or patient requiring full dedication for about 1 hr in any shift and 8a. Performing routine tasks.
Unscored items are relatived to activities
performed at a specialized intensive care unit(14-15),
according to expectations for the gastroenterology
patient profile.
To obtain NAS workload results comparable
with the total nursing hours recommended by the
according to the type of care the patient demands,
the NAS score needs to be transformed into hours.
Each NAS point is equivalent to 0.24hr(14) and,
on the average, 34.9% of the workload at the
gastroenterology unit was measured, 8.4 hours of
nursing service were delivered during 24-hour care.
In view of recommendations established in COFEN
resolution No 293/2004(16), the obtained score
evidences a profile of patients demanding
intermediary and semi-intensive care, suggesting that
the NAS can be used to assess the nursing workload
at that unit.
CONCLUSIONS
This research permitted measuring the
nursing workload at a specialized clinical and surgical
gastroenterology care unit. The workload, according
to the NAS, corresponded to 34.9% for the unit, with
differences between the nursing wards, i.e. 37.2%
for the gastroclinic and 32.63% for the gastrosurgical
ward.
The total score resulted in an average 8.4
hours of nursing care during 24 hours, corresponding
to the profile of patients demanding intermediary and
semi-intensive care. Although the NAS is applicable
to ICU, its utility to determine the nursing workload
at the study unit could be demonstrated.
In view of these results, the importance of
nurses assessing the nursing workload at their unit is
highlighted, using instruments for this goal, either to
make the nursing work process more oriented to
patient demands or to help nurses to administer the
staff in hospital service management.
As this was the first experience of using the
NAS at a clinical and surgical unit, the researchers
recommend its application in other studies with the
same patient profile and hospital reality, as well as its
validation for other than intensive care units.
REFERENCES
1. Gaidzinski RR, Fugulin FMT, Castilho V. Dimensionamento de pessoal de enfermagem em instituições de saúde. In: Kurcgant P, coordenador. Gerenciamento em Enfermagem. Rio de Janeiro (RJ): Guanabara Koogan; 2005. p .127-37. 2. Fugulin FMT, Gaidzinski RR, Kurcgant P. Sistema de classificação de pacientes: identificação do perfil assistencial dos pacientes das unidades de internação do HU-USP. Rev Latino-am Enfermagem 2005 janeiro-fevereiro; 13(1):72-8. 3. Santos F, Rogenski NMB, Baptista CMC, Fugulin FMT. Sistema de classificação de pacientes: proposta de complementação do instrumento de Fugulin et al. Rev Latino-am Enfermagem 2007 setembro-outubro; 15(5):980-5. 4. Perroca MG, Gaidzinski RR. Sistema de classificação de pacientes: construção e validação de um instrumento. Rev Esc Enferm USP 1998; 32(2):153-68.
5. Hokama CSM, Serrano CDBH. Sistema de classificação de pacientes (SCP) – ENFSCORE. In: Bork AMT, organizador. Enfermagem de excelência: da visão à ação. Rio de Janeiro (RJ): Guanabara Koogan; 2003. p. 101-10.
6. Martins EAP, Haddad MCL. Validação de um instrumento que classifica os pacientes em quatro graus de dependência do cuidado de enfermagem. Rev Latino-am Enfermagem 2000 abril; 8(2):74-82.
7. Dal Ben LW. Instrumento para dimensionar horas diárias de assistência de enfermagem residencial [dissertação]. São Paulo (SP): Escola de Enfermagem/USP; 2000.
8. Dini AP. Sistema de classificação de pacientes pediátricos: construção e validação de instrumento [dissertação]. Campinas (SP): Universidade Estadual de Campinas; 2007. 9. Nunes B. Tradução para o português e validação de um
instrumento de medida de gravidade em UTI: Therapeutic Intervention Scoring System-28 (TISS-28) [dissertação]. São Paulo (SP): Escola de Enfermagem/USP; 2000. 10. Queijo AF. Tradução para o português e validação de um instrumento de medida de carga de trabalho de enfermagem em unidade de terapia intensiva: Nursing Activities Score (NAS) [dissertação]. São Paulo (SP): Escola de Enfermagem/ USP; 2002.
11. Miranda DR, Nap R, Rijk A, Schaufeli W, Iapichino G. Nursing Activities Score. Crit Care Med 2003; 31(2):374-82. 12. Balsanelli AP, Cunha ICKO, Whitaker IY. Estilos de liderança de enfermeiros em unidade de terapia intensiva: associação com perfil pessoal, profissional e carga de t rabalho . Rev. Latino-Am. Enfermagem [periódico na Internet]. 2009 Fev [citado 2009 Jun 02] ; 17(1): 28-33. Disponível em: http://www.scielo.br/scielo.php? s c r i p t = s c i _ a r t t e x t & p i d = S 0 1 0 4 - 1 1 6 9 2 0 0 9 0 0 0 1 0 0 0 0 5 & l n g = p t . d o i : 1 0 . 1 5 9 0 / S 0 1 0 4 - 1 1 6 9 2 0 0 9 0 0 0 1 0 0 0 0 5 .
13. Sousa CR, Gonçalves LA, Toffoleto MC, Leão K, Padilha KG. Preditores da demanda de trabalho de enfermagem para idosos internados em unidade de terapia intensiva. Rev. Latino-Am. Enfermagem [periódico na Internet]. 2008 Abr [citado 2009 Jun 02] ; 16(2):218-23. Disponível em: http:// www.scielo.br/scielo.php?script=sci_arttext&pid=S0104-11692008000200008&lng=pt. doi: 10.1590/S0104-1 10.1590/S0104-1 6 9 2 0 0 8 0 0 0 2 0 0 0 0 8 .
14. Conishi RMY. Avaliação do NAS – Nursing Activities Score – como instrumento de carga de trabalho de enfermagem em uma UTI geral adulto [dissertação]. São Paulo (SP): Escola de Enfermagem/ USP; 2005.
de enfermagem em uma unidade de terapia intensiva de adultos no primeiro dia de internação [dissertação]. São Paulo (SP): Escola de Enfermagem/USP; 2006.
16. Conselho Federal de Enfermagem [Página na internet]. Resolução 293/2004. Fixa e estabelece parâmetros para o
dimensionamento de pessoal de enfermagem nas unidades assistenciais das instituições de saúde e assemelhados [acesso em 29 fev 2008]. Disponível em: http:// w w w . p o r t a l c o f e n . c o m . b r / 2 0 0 7 / m a t e r i a s . a s p ? A r t i c l e ID=7121§ionID=34